첫번째 팀 프로젝트
음식 배달 서비스 데이터 분석을 통한 레스토랑 창업 및 마케팅 전략 구축하기
- 데이터 수집 방법
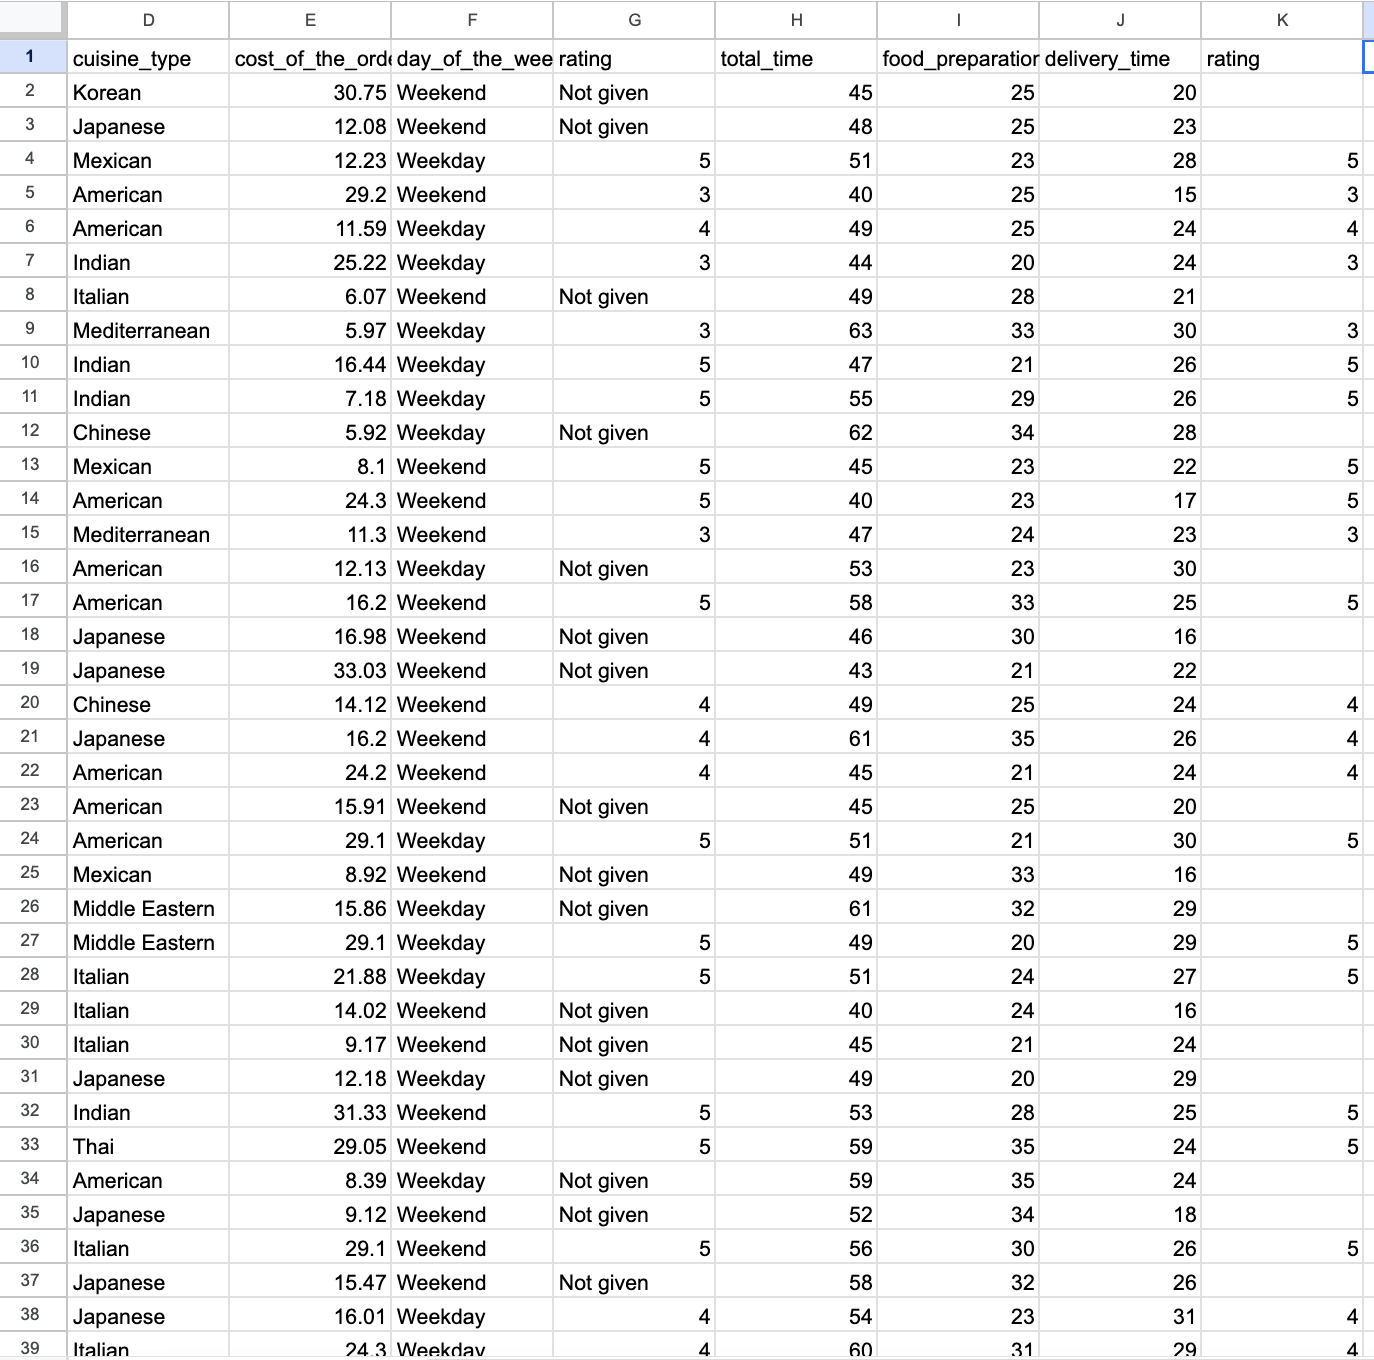
kaggle _ NYC Restaurants Data - Food Ordering and Delivery - 수집한 데이터의 형식과 속성 설명
9 columns x 1899 rows
- order_id : Unique ID of the order ( 주문의 고유 ID)
- customer_id : ID of the customer who ordered the food ( 음식을 주문한 고객의 ID)
- restaurant_name : Name of the restaurant ( 식당 이름 )
- cuisine_type : Cuisine ordered by the customer ( 고객이 주문한 요리 타입 )
- cost_of_the_order : Cost of the order ( 주문 비용 )
- day_of_the_week : Indicates whether the order is placed on a weekday or weekend (The weekday is from Monday to Friday and the ( 주문이 평일 또는 주말에 접수되었는지 여부)
- rating: Rating given by the customer out of 5 ( 5점 만점으로 평가한 평점 )
- food_preparation_time: Time (in minutes) taken by the restaurant to prepare the food. This is calculated by taking the difference between the timestamps of the restaurant's order confirmation and the delivery person's pick-up confirmation. ( 음식준비시간 )
- delivery_time : Time (in minutes) taken by the delivery person to deliver the food package. This is calculated by taking the difference ( 배달소요시간 )
- 분석내용
- 요일과 주문비용 상관관계 (동일)
- 총배달소요시간과 평점과의 상관관계(수경)
- 상위 10개 식당이름 - 인기식당 (수경)
- 상관 x > 음식 가격이 평점에 영향을 미치는 지(지호)
- cuisine_type별 주문 비용 (지호)
- cuisine_type별 주문 비율 (유림)
1-1. 가설설정 : 총배달소요시간이 길어지면 평점이 낮아질 것이다.
1-2. 분석하기 : 총배달소요시간과 평점과의 상관관계 (스프레드시트, pyhthon)
1) 스프레드시트
- 필터 > rating : 'Not given' 제외
- total_time = food_preparation + delivery_time
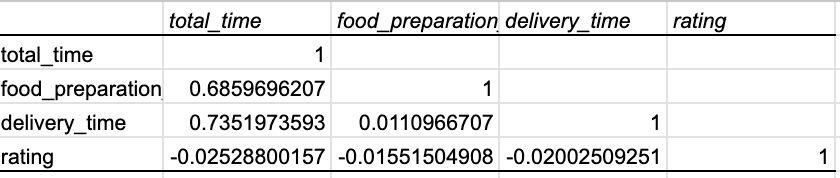
- rating, total_time, food_preparation, delivery_time 상관계수 구하기
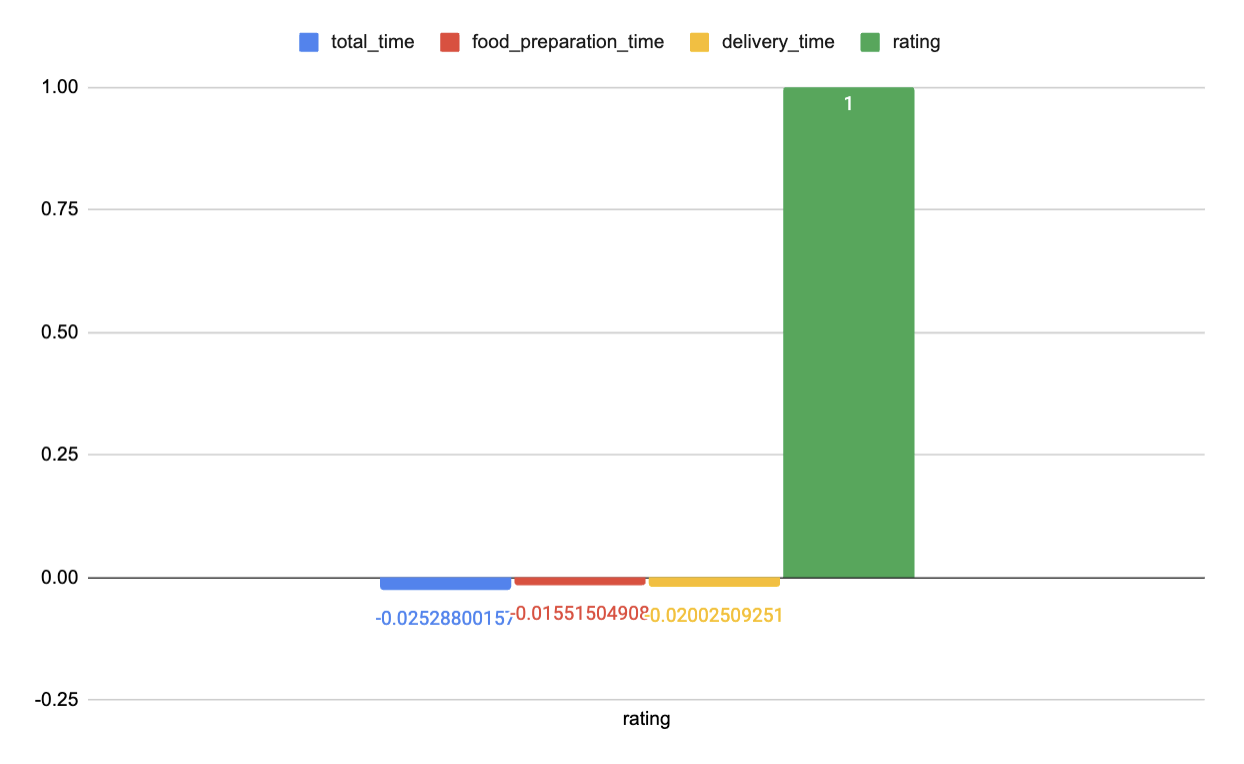
- 차트 삽입
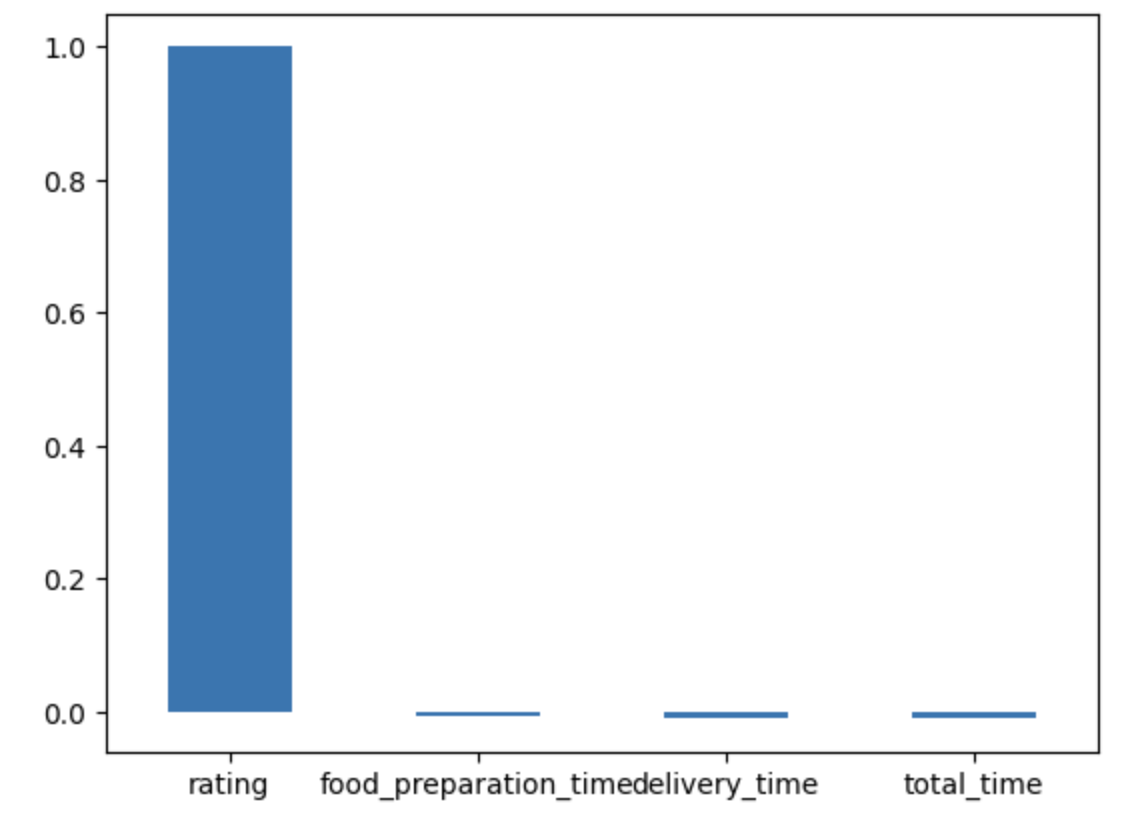
2) python#총배달소요시간과 평점과의 상관관계 구하기 #라이브러리 선언 import pandas as pd import matplotlib.pyplot as plt #데이터 불러오기 food_order = pd.read_table('/content/food_order.csv',sep=',') food_order #데이터 형식 확인하기 food_order.info() #데이터 전처리 #공백 확인 >>> 공백 없음 print(food_order.isnull().sum()) # 총소요시간 구하기 food_order['total_time'] = food_order['food_preparation_time'] + food_order['delivery_time'] food_order #상관계수 구할 컬럼만 뽑아내기 food_order_rating_time = food_order[['rating','food_preparation_time', 'delivery_time', 'total_time']] #rating의 'Not given'행 삭제하기 RT = food_order_rating_time[food_order_rating_time.rating != 'Not given'] RT #rating을 정수로 변환 RT['rating']=RT['rating'].astype('int') #상관계수구하기 corr=RT.corr(method='pearson') corr #바그래프 그리기 corr['rating'].plot.bar() #x축 레이블 45도 회전하기 plt.xticks(rotation=0)
❗️상관계수 구할 때 rating이 나오지 않았던 이유 : 문자이기 때문에 숫자로 변환해주어야 한다.(튜터님에게 문의)
#상관계수는 숫자일때만 연산 가능함! 데이터 형식 확인하고,
food_order.info()

#rating을 정수로 변환하는 과정이 필요하다.
RT['rating']=RT['rating'].astype('int')
1-3. 분석결과 : 총배달소요시간과 평점과는 유의미한 상관 관계가 확인되지 않는다. 평점에 영향을 미치는 다른 요인이 있을 것이다.
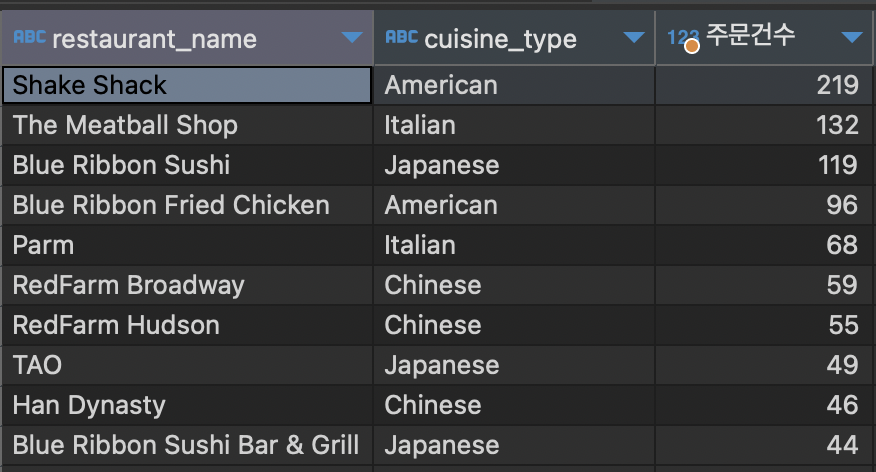
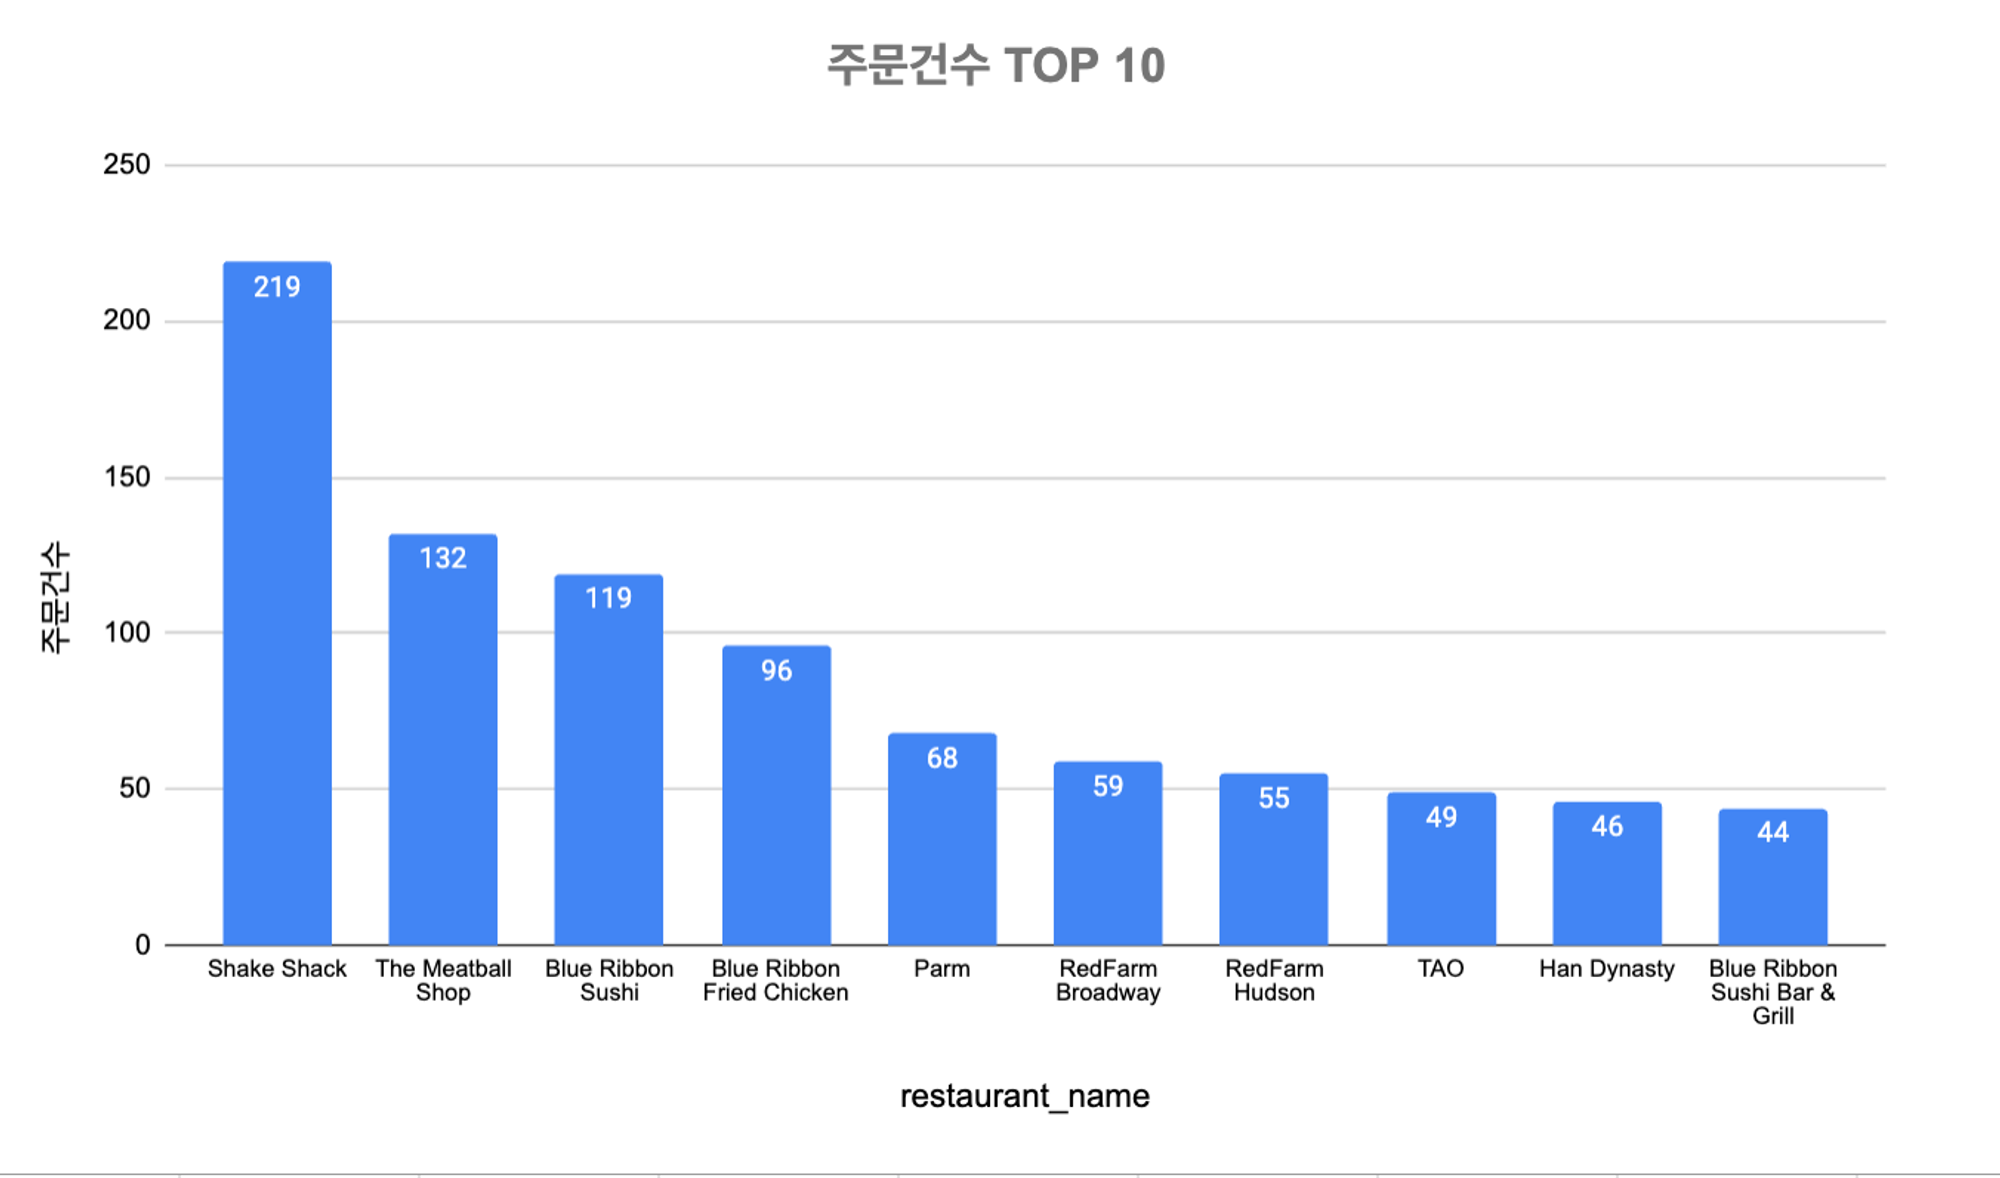
2-1. 주문건수 상위 10개 식당과 음식종류 분석하기
select restaurant_name,
cuisine_type,
count(restaurant_name) "주문건수"
from food_order
group by 1
order by 3 desc
limit 10
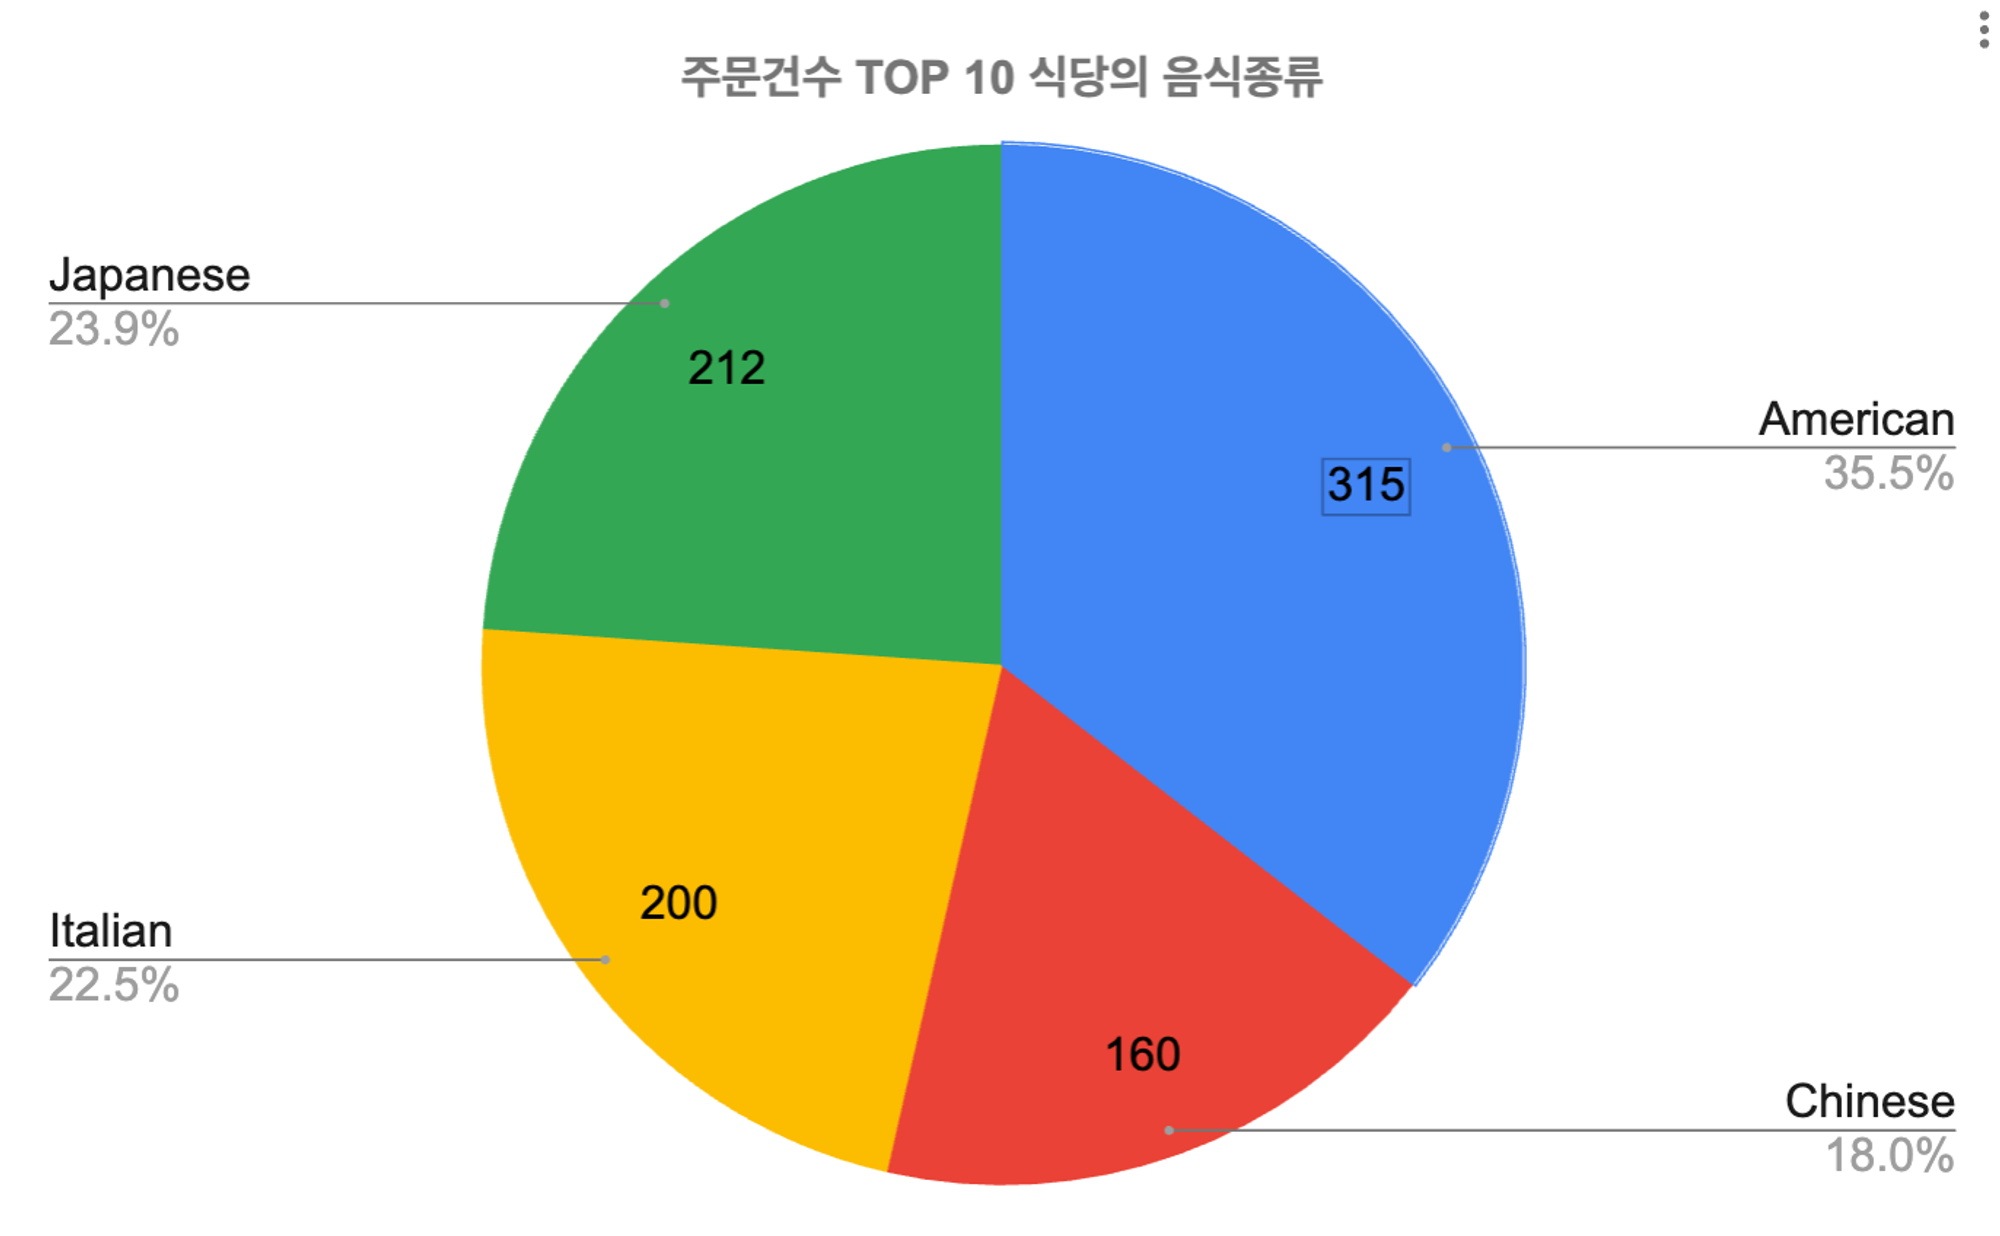
2-2. 분석결과 : 주문건수 상위 10개의 식당 중 음식종류별로 American > Japanese > Italian 순으로 주문건수가 많다

잘 하고 있는겨?