python_법정동 충전소 데이터 시각화(folium, 최단거리)
동별 충전접근성을 확인해보기로한다.
1. 법정동별 인근 충전소 평균 거리 순위
2. 인근 급속 충전소 거리가 500m가 넘는 충전소 개수
충전소간 거리 구하기
우선 급속충전소 데이터만 뺀다
charger_fast_df = charger_dong_df[charger_dong_df['기종(대)'] == '급속'].reset_index(drop = True)
charger_fast_df.head(3)
좌표 데이터에서 자기 자신과 같은 좌표는 제외하고 가장 가까운 좌표를 찾는다.
# 충전소 좌표에 대한 중복값을 제거하여 charger_point 생성
charger_point2 = charger_fast_df[['위도', '경도']].drop_duplicates().reset_index(drop=True)

# 인근충전소위도, 인근충전소경도 컬럼을 charger_point에 추가하고 초기화
charger_point2['인근충전소위도'] = None
charger_point2['인근충전소경도'] = None

# NearestNeighbors 모델을 사용하여 가장 가까운 인근 충전소 찾기
X = charger_point2[['위도', '경도']]
nbrs = NearestNeighbors(n_neighbors=2, algorithm='ball_tree').fit(X)

# 가장 가까운 인근 충전소 찾아서 인근충전소위도, 인근충전소경도 컬럼에 할당
def find_nearest_neighbor(row):
    # 현재 충전소의 좌표를 제외한 가장 가까운 이웃의 인덱스 찾기
    distances, indices = nbrs.kneighbors([row[['위도', '경도']]])
    nearest_index = indices[0][1]  # 자기 자신을 제외한 가장 가까운 이웃의 인덱스
    nearest_row = charger_point2.iloc[nearest_index]
    # 자기 자신과 동일한 좌표를 가진 행이 있으면 두 번째로 가까운 이웃 선택
    while (nearest_row['위도'] == row['위도']) and (nearest_row['경도'] == row['경도']):
        nearest_index = (nearest_index + 1) % len(charger_point2)  # 인덱스를 순환하도록 수정
        nearest_row = charger_point2.iloc[nearest_index]
    row['인근충전소위도'] = nearest_row['위도']
    row['인근충전소경도'] = nearest_row['경도']
    return row

# 충전소 좌표별로 가장 가까운 인근 충전소를 찾아서 인근충전소위도, 인근충전소경도 컬럼에 할당
charger_fast_df[['인근충전소위도(급속)', '인근충전소경도(급속)']] = charger_fast_df[['위도', '경도']].apply(find_nearest_neighbor, axis=1)[['인근충전소위도', '인근충전소경도']]
찾은 좌표로 최단거리를 계산한다
#인근 충전소와의 거리 계산

# 위도와 경도 간의 직선 거리를 계산하는 함수
def haversine(lat1, lon1, lat2, lon2):
    R = 6371  # 지구의 반지름 (단위: km)
    dlat = np.radians(lat2 - lat1)
    dlon = np.radians(lon2 - lon1)
    a = np.sin(dlat / 2) * np.sin(dlat / 2) + np.cos(np.radians(lat1)) * np.cos(np.radians(lat2)) * np.sin(dlon / 2) * np.sin(dlon / 2)
    c = 2 * np.arctan2(np.sqrt(a), np.sqrt(1 - a))
    distance = R * c * 1000  # 미터 단위로 변환
    return distance

# 위도와 경도 간의 직선 거리를 계산하여 인근충전소거리 컬럼에 추가
charger_fast_df['인근충전소거리(급속)'] = charger_fast_df.apply(lambda row: haversine(row['위도'], row['경도'], row['인근충전소위도(급속)'], row['인근충전소경도(급속)']), axis=1)
언제쯤 코드를 스스로 쓸 수 있을가...
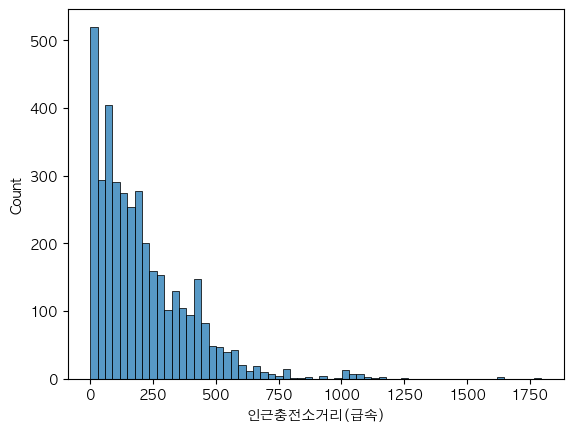
시각화 해보면 대충 이런 모습
그래도 대부분의 충전소가 반경 500m이내에는 위치해있다.
법정동별 인근 충전소 평균 거리 순위
bdong_nearly_charger_df = pd.DataFrame(charger_fast_df.groupby(['군구','법정동코드', '법정동명','법정동중심위도','법정동중심경도'])['인근충전소거리(급속)'].mean()).sort_values(by = '인근충전소거리(급속)', ascending=False)
bdong_nearly_charger_df.reset_index(inplace = True)
bdong_nearly_charger_df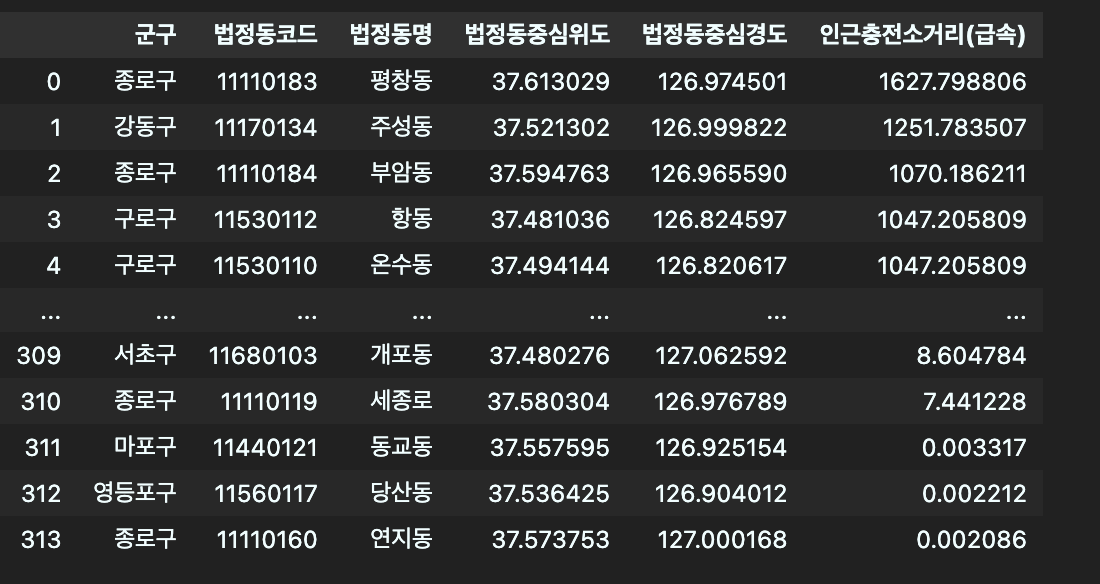
지도시각화
시각화를 하려면 우선 법정동 구역을 지도에 표시해야한다.
folium은 json파일을 쓰는데 법정동 경계 좌표 데이터가 json형식이 아무리 찾아도 없다.(행정동만 보임)
결국 수기로 변환해주었다.
- http://www.gisdeveloper.co.kr/?p=2332
이곳에서 읍면동 데이터를 받은 후 아래 사이트를 참고해서 json파일로 변환했다. - https://park9eon.com/how-to-convert-to-korea-shp-geojson/
아래 코드부터 다시 시작,
깨지는 글자로 encoding 추가.
지도 경계데이터라 좌표가 무지 많다. 그래서 서울시 코드(11)만 불러와서 변수에 저장한다.
#법정동 경계 좌표 json파일 불러오기
# JSON 파일 경로
json_file_path = '/Users/sookyeong/Documents/내배캠/팀프로젝트/project5_final/emd (2).json'

# JSON 파일 열기
with open(json_file_path, 'r', encoding='utf-8') as f:
    geo_data = json.load(f)

# EMD_CD가 앞 두글자가 '11'인 데이터만 필터링
filtered_features = [feature for feature in geo_data['features'] if feature['properties']['EMD_CD'][:2] == '11']

# 필터링된 데이터로 새로운 GeoJSON 생성
filtered_geo_data = {
    'type': 'FeatureCollection',
    'features': filtered_features
}
웬걸 아무 생각없이 시각화하려고 해도 지도가 제대로 안뜬다.
좌표계가 wgs84가 아니었던 것.
27.xxx, 135.xxx이런식으로 변환해주기 위해 다시 작업
#wgs84 좌표계로 변환
import geopandas as gpd
import json

# GeoJSON 데이터를 GeoDataFrame으로 변환
gdf = gpd.GeoDataFrame.from_features(filtered_geo_data)

# 좌표계를 WGS84로 변환
gdf.crs = "EPSG:5179"

# 좌표계가 설정된 상태에서 다시 변환
gdf_wgs84 = gdf.to_crs(epsg=4326)

# GeoDataFrame을 GeoJSON 형식으로 변환
wgs84_geojson = gdf_wgs84.to_json()

# 필요한 경우 딕셔너리로 다시 변환
wgs84_geojson_dict = json.loads(wgs84_geojson)

wgs84_geojson_dict
변환해준 좌표를 사용해서 folium 시각화
import folium

# Folium 지도 객체 생성
m = folium.Map(location=[37.55, 126.98], zoom_start=11, tiles='cartodbpositron')

folium.Choropleth(
    geo_data=wgs84_geojson_dict,
    data=bdong_nearly_charger_df,
    columns=['법정동코드', '인근충전소거리(급속)'],
    fill_color='PuBu',
    key_on='feature.properties.EMD_CD',  # GeoJSON 데이터에서 특정 속성 값의 키를 지정합니다.
    highlight=True,
    fill_opacity=0.5,
    line_opacity=0.5,
    legend_name='급속충전소',
    nan_fill_color='none'
).add_to(m)

# Folium 지도 객체 출력
m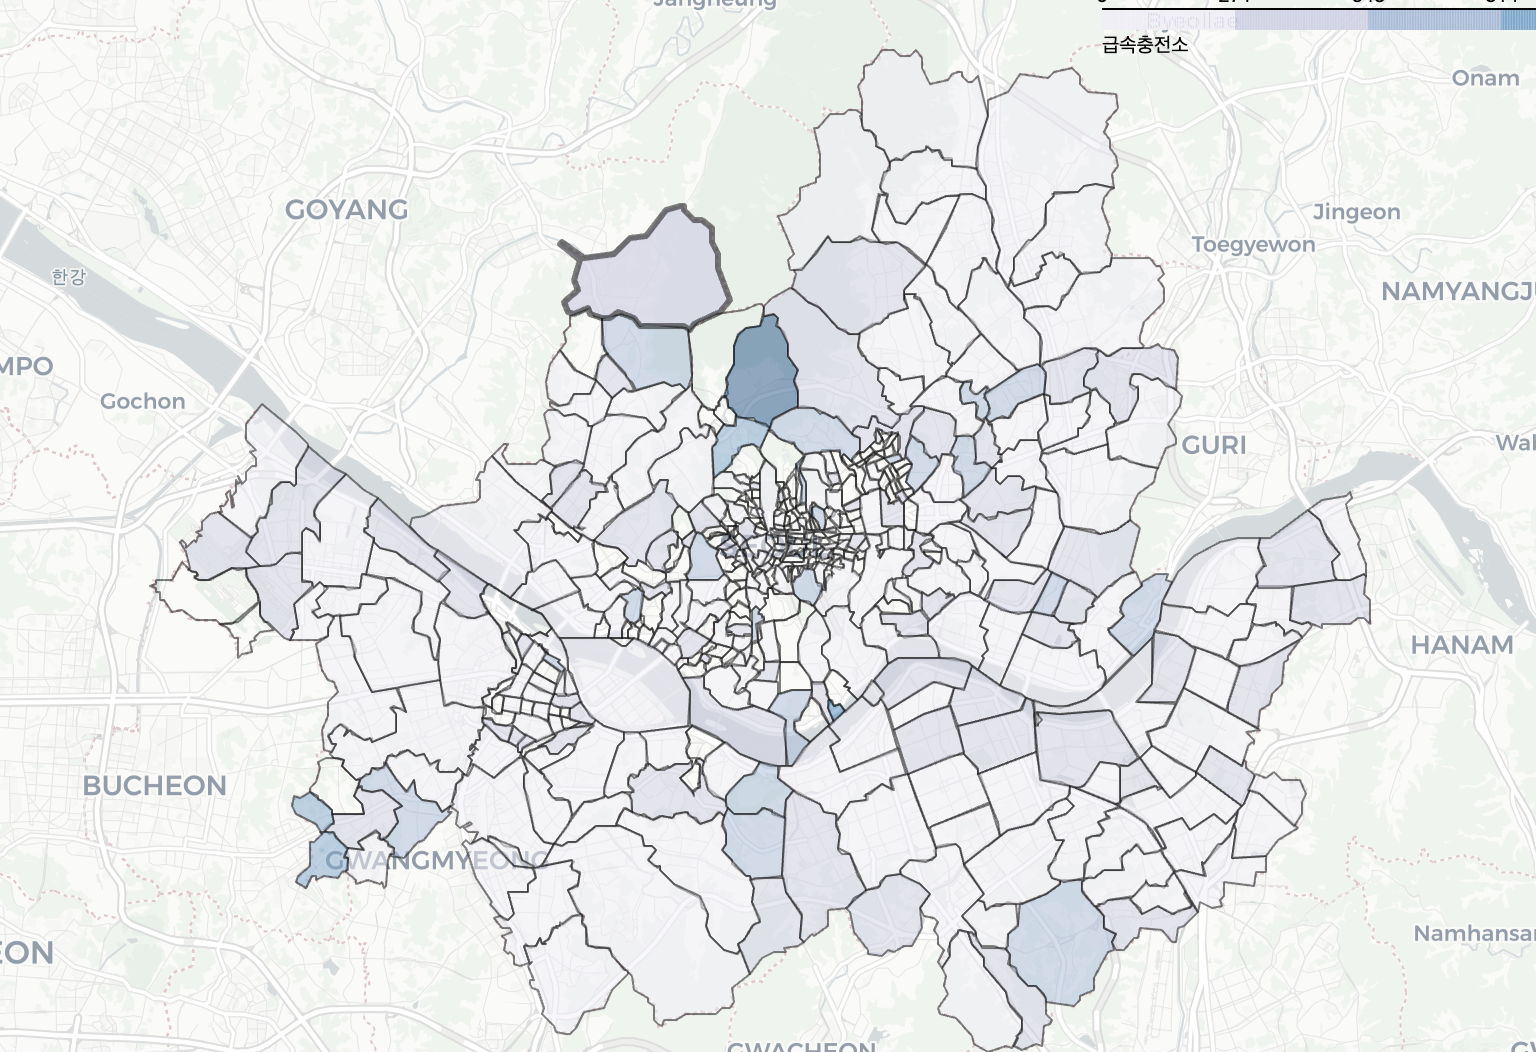
차충비, 인구밀도, 교통량등에도 지도를 사용할 수 있을 것 같다.
뭐하나 쉬운게 없는 ㅠ^ㅠ..

잘 하고 있는겨?