🚖 사용 데이터
sns.load_dataset("taxis")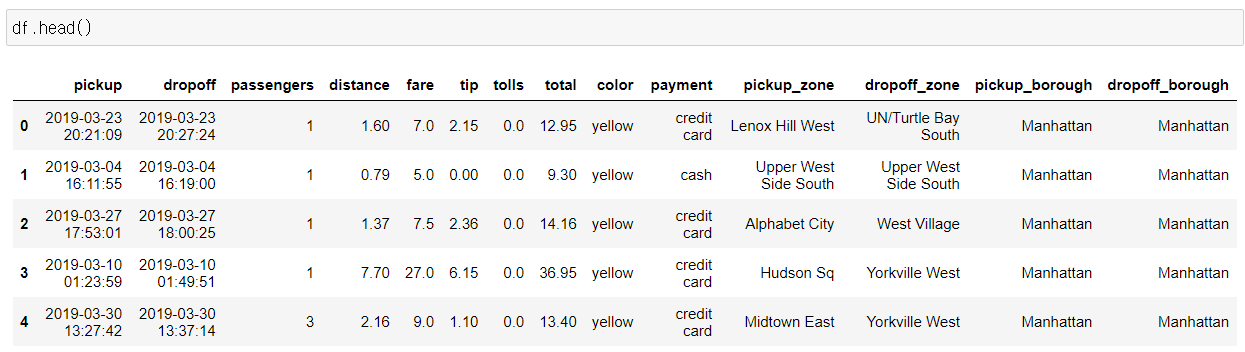
🚖 과제를 통해 새로 알게된 점
1. 시간 데이터의 구간을 groupby로 구현하기
- pd.Grouper() 사용 👉 공식문서 바로가기
Parameters
- key : str, defaults to None
Groupby key, which selects the grouping column of the target. - freq : str / frequency object, defaults to None
This will groupby the specified frequency if the target selection (via key or level) is a datetime-like object.
- key : str, defaults to None
df_g = df.groupby([pd.Grouper(key='pickup_time',freq='2H')]
	)["passengers", "distance", "fare", "tip", "tolls", "total"
    ].agg('mean')
df_g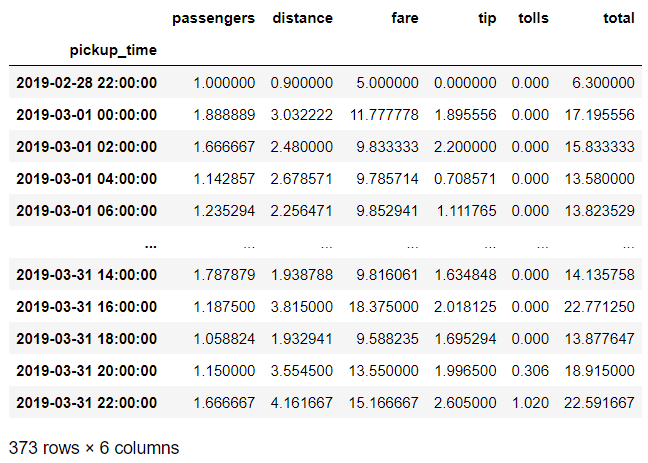
참고 블로그 : https://kkiho.tistory.com/42
2. 인덱스가 시간일 때, 특정 시간 추출하기
- 인덱스의 타입이 시간이더라도 그냥 일반적인 인덱스 슬라이싱으로 특정 시간 추출할 수 있다.
# 2019년 3월 23일 데이터만 가져오기
taxis_means = df_g['2019-03-23 06:00:00':'2019-03-23 22:00:00']
taxis_means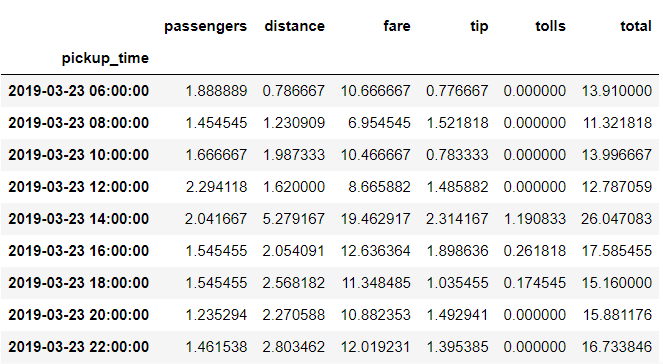
- 🤔 슬라이싱 말고 '2019-03-23'을 포함하는 인덱스를 가져오게 할 순 없나?
방법1) str 타입으로 변경하고 contains를 활용
방법2) pd.IndexSlice 활용
# 방법1
df_g[df_g.index.astype(str).str.contains("2019-03-23")]

# 방법2
idx = pd.IndexSlice
df_slice = df_g.loc[idx['2019-03-23 06:00:00':'2019-03-23 22:00:00'],:]
df_slice
참고 https://rfriend.tistory.com/503, https://seong6496.tistory.com/88
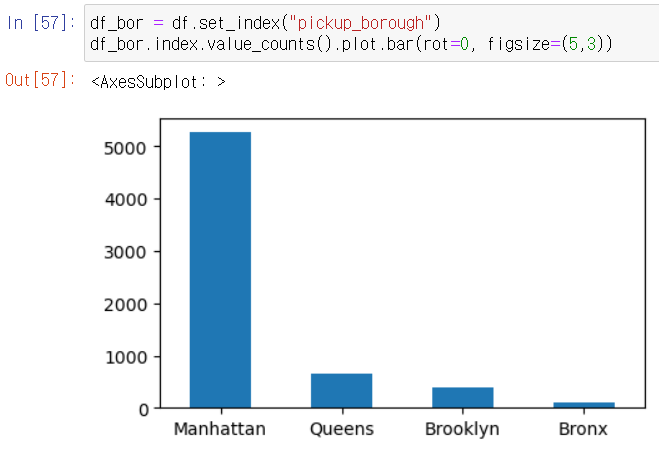
3. 인덱스 값의 빈도수를 시각화하기
- 데이터 프레임의 인덱스로 설정된 값의 빈도수를 시각화하고 싶다면 df.index.value_counts() 상태에서 그래프를 그리면 된다.
df_bor = df.set_index("pickup_borough")
df_bor.index.value_counts().plot.bar(rot=0, figsize=(5,3))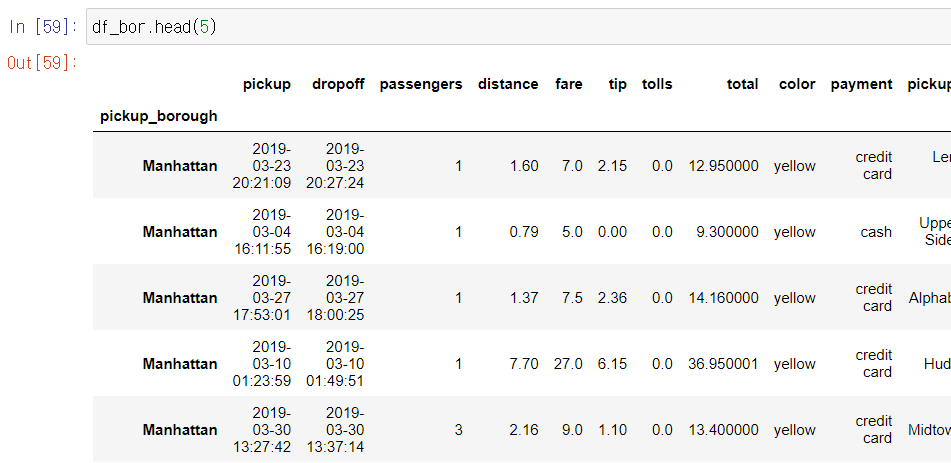

HR Analyst가 되고 싶은