우리 프로젝트의 주제는 손글씨로 작성한 노트 필기를 웹으로 옮기면 "깔끔하게" 정리해주는 것이다.
이 프로젝트에서 제일 중요한 것은 손글씨로 작성한 노트를 사진으로 찍어서 웹으로 옮기는 것이다. 더 세부적으로 들어가자면, 단순히 사진으로 찍은 손글씨 노트 필기를 하나의 이미지로 뭉뚱그려 인식하면 안된다. 손글씨, 사진, 그림, 그래프 등을 각각의 개체로 다르게 식별할 줄 알아야 한다.
그래서 사용자로 하여금 손글씨 개체는 폰트 종류나 글씨 크기, 글씨 속성(이탤릭체, 볼드체, 글씨 색 등)을 변경할 수 있어야 한다. 또한 사진, 그림, 그래프 등은 그 개체 내에 적혀져 있는 손글씨가 따로 분리되어서는 안된다. 사용자가 특정 사진, 그림 혹은 그래프가 포함된 영역을 클릭해서 옮길 때 그 영역 내에 있는 손글씨도 같은 개체로 묶여서 이동할 수 있도록 해야 한다.
이를 토대로 우리에게 필요로 한 기술을 정리하자.
- 이미지 속 손글씨 detection
- 이미지 속 개체 검출 및 분류 (사진, 표, 그래프 등으로)
- 각 개체별로 그룹화
- 사용자가 특정 그룹을 자유자재로 움직여서 원하는 위치에 배치 가능하도록
- 각 개체의 속성별로 자유로운 편집이 가능하도록
이에 따라 위의 기능을 아래의 기술로 해결해보고자 한다.
- openCV를 통한 도형 검출
- OCR을 통한 손글씨 detection
- 구글 Cloud vision api를 통한 이미지 분석 및 라벨링
해당 포스팅에서는 특히 OCR을 통한 손글씨 detection을 위해 image 전처리하는 과정에 대해서 심도 깊게 알아볼 예정이다.
OCR이란?
OCR(Optical character recognition, 광학 문자 인식)은 이미지(사진) 속 글자 위치를 찾고 어떤 글자인지 자동으로 알아내는 기술이다. 이러한 OCR에서는 당연하게 인식율이 매우 중요하고, 인식율을 높이기 위해서는 이미지의 품질이 무엇보다 중요하다.
Tesseract OCR 활용법
다양한 촬영기기와 다양한 촬영 환경은 고르지 못한 품질의 이미지들을 만들어내기에 이번 포스팅에서는 입력된 이미지의 전처리 과정을 담았다.
Image Outline 잡기
Tesseract 설치
pip install pytesseractImport Packages
from imutils.perspective import four_point_transform
from imutils.contours import sort_contours
import matplotlib.pyplot as plt
import pytesseract
import imutils
import cv2
import re
import requests
import numpy as np
Colab에서 Original image를 확인하기 위한 함수 선언
def plt_imshow(title='image', img=None, figsize=(8 ,5)):
    plt.figure(figsize=figsize)

    if type(img) == list:
        if type(title) == list:
            titles = title
        else:
            titles = []

            for i in range(len(img)):
                titles.append(title)

        for i in range(len(img)):
            if len(img[i].shape) <= 2:
                rgbImg = cv2.cvtColor(img[i], cv2.COLOR_GRAY2RGB)
            else:
                rgbImg = cv2.cvtColor(img[i], cv2.COLOR_BGR2RGB)

            plt.subplot(1, len(img), i + 1), plt.imshow(rgbImg)
            plt.title(titles[i])
            plt.xticks([]), plt.yticks([])

        plt.show()

    else:
        if len(img.shape) < 3:
            rgbImg = cv2.cvtColor(img, cv2.COLOR_GRAY2RGB)
        else:
            rgbImg = cv2.cvtColor(img, cv2.COLOR_BGR2RGB)

        plt.imshow(rgbImg)
        plt.title(title)
        plt.xticks([]), plt.yticks([])
        plt.show()
외부 URL의 Image 출력
url = 'Image URL을 여기에 넣으면 된다'
image_nparray = np.asarray(bytearray(requests.get(url).content), dtype=np.uint8)
org_image = cv2.imdecode(image_nparray, cv2.IMREAD_COLOR)
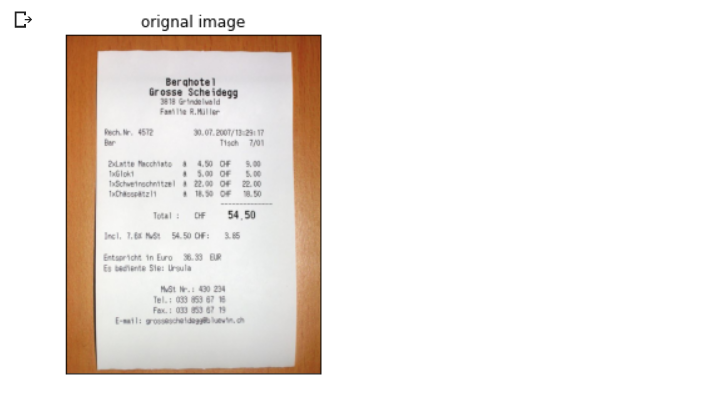
plt_imshow("orignal image", org_image)나는 우선 edge를 확실하게 구분할 수 있는 사진으로 준비했다. 링크가 길어 이미지 링크로 대신한다.
아래와 같은 출력 결과가 나온다면 정상적으로 진행되는 것이다.
Contours 찾기
image = org_image.copy()
image = imutils.resize(image, width=500)
ratio = org_image.shape[1] / float(image.shape[1])
# 이미지를 grayscale로 변환하고 blur 적용
# 모서리를 찾기 위한 연산
gray = cv2.cvtColor(image, cv2.COLOR_BGR2GRAY)
blurred = cv2.GaussianBlur(gray, (5, 5,), 0)
edged = cv2.Canny(blurred, 75, 200)
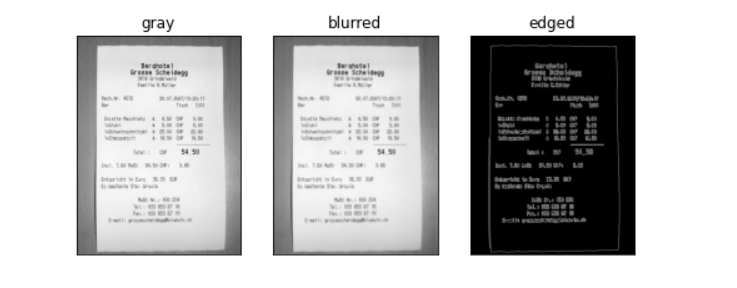
plt_imshow(['gray', 'blurred', 'edged'], [gray, blurred, edged])Contour는 같은 값을 가진 곳을 연결한 선이라고 생각하면 된다. 주로 image의 외곽선을 검출하기 위해 사용한다.
결과값으로는 아래와 같이 gray, blurred, edged image가 출력될 것이다.
Outline 잡기
# contours를 찾아 크기순으로 정렬
cnts = cv2.findContours(edged.copy(), cv2.RETR_EXTERNAL, cv2.CHAIN_APPROX_SIMPLE)
cnts = imutils.grab_contours(cnts)
cnts = sorted(cnts, key=cv2.contourArea, reverse=True)
exampleCnt = None
# 정렬된 contours 중 4개의 꼭지점을 갖는 도형 검출
for c in cnts:
peri = cv2.arcLength(c, True)
approx = cv2.approxPolyDP(c, 0.02 * peri, True)
# 가장 큰 1번째 contours를 영수증 영역으로 판단하고 break
if len(approx) == 4:
exampleCnt = approx
break
# 만약 추출한 outline이 없을 경우 오류
if exampleCnt is None:
raise Exception(("Could not find receipt outline."))
output = image.copy()
cv2.drawContours(output, [exampleCnt], -1, (0, 255, 0), 2)
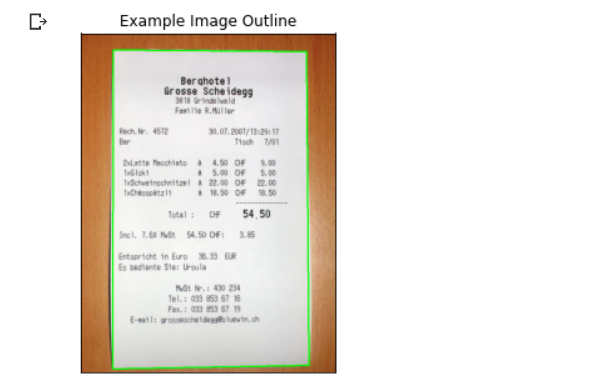
plt_imshow("Example Image Outline", output)출력 결과를 보면 아래와 같이 outline을 잡아준 것을 볼 수 있다.
이미지 보정
# 원본 이미지에 찾은 윤곽을 기준으로 이미지를 보정
example = four_point_transform(org_image, exampleCnt.reshape(4, 2) * ratio)
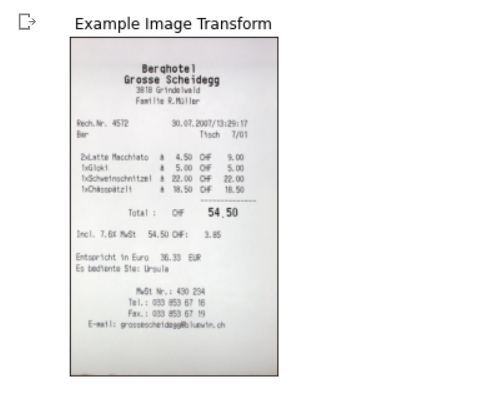
plt_imshow("Example Image Transform", example)기존 이미지에서 잡은 outline을 기준으로 image를 crop한다.
이미지 영역 추출
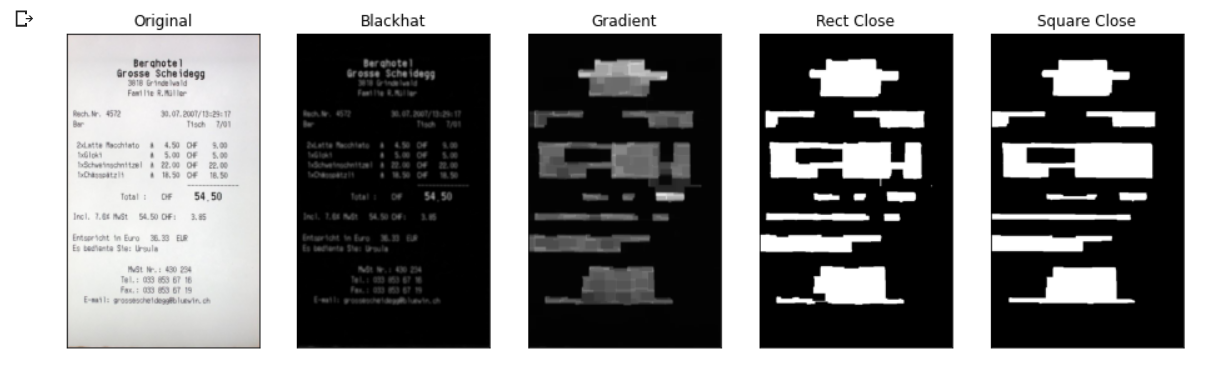
이미지 내 Grouping
gray = cv2.cvtColor(receipt, cv2.COLOR_BGR2GRAY)
(H, W) = gray.shape

rectKernel = cv2.getStructuringElement(cv2.MORPH_RECT, (30, 20))
sqKernel = cv2.getStructuringElement(cv2.MORPH_RECT, (50, 21))

gray = cv2.GaussianBlur(gray, (11, 11), 0)
blackhat = cv2.morphologyEx(gray, cv2.MORPH_BLACKHAT, rectKernel)

grad = cv2.Sobel(blackhat, ddepth=cv2.CV_32F, dx=1, dy=0, ksize=-1)
grad = np.absolute(grad)
(minVal, maxVal) = (np.min(grad), np.max(grad))
grad = (grad - minVal) / (maxVal - minVal)
grad = (grad * 255).astype("uint8")

grad = cv2.morphologyEx(grad, cv2.MORPH_CLOSE, rectKernel)
thresh = cv2.threshold(grad, 0, 255, cv2.THRESH_BINARY | cv2.THRESH_OTSU)[1]

close_thresh = cv2.morphologyEx(thresh, cv2.MORPH_CLOSE, sqKernel)
close_thresh = cv2.erode(close_thresh, None, iterations=2)

plt_imshow(["Original", "Blackhat", "Gradient", "Rect Close", "Square Close"], [receipt, blackhat, grad, thresh, close_thresh], figsize=(16, 10))
아래와 같은 결과를 얻을 수 있다.
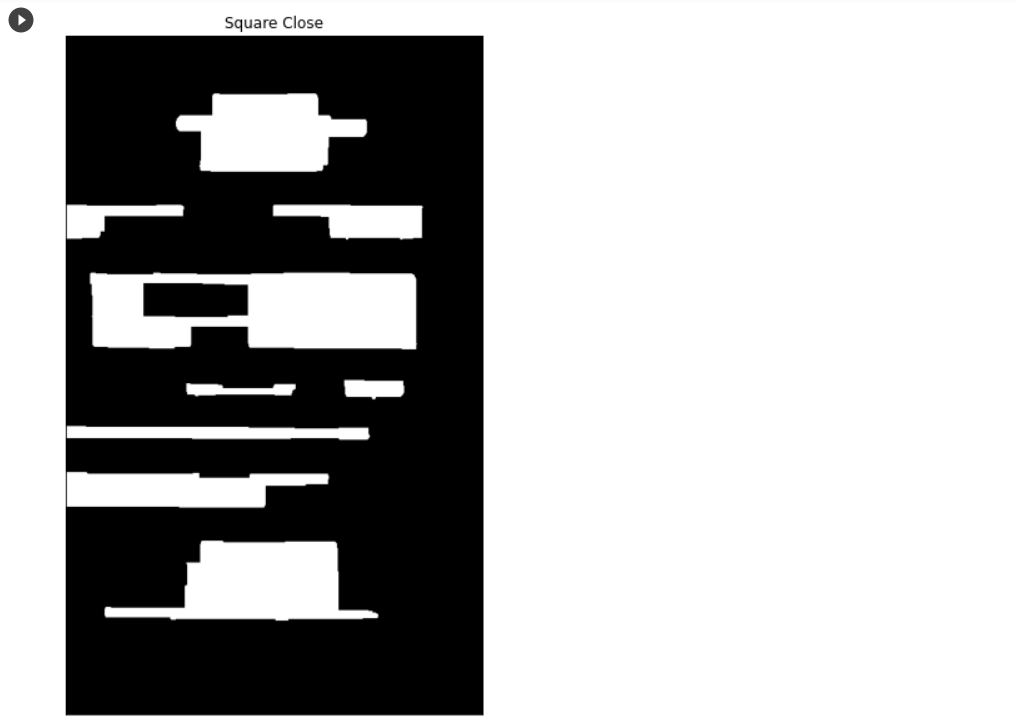
마지막에 얻은 Square Close를 더 크게 확대해보자.
plt_imshow(["Square Close"], [close_thresh], figsize=(16, 10))아래 출력값처럼 잘 grouping된 것을 알 수 있다.
Grouping된 영역 detection
Grouping 된 영역의 윤곽선을 찾고 그 윤곽선이 특정 조건 (Ex. 종횡비 등)에 만족하는 영역만 추출한다.
cnts = cv2.findContours(close_thresh.copy(), cv2.RETR_EXTERNAL, cv2.CHAIN_APPROX_SIMPLE)
cnts = imutils.grab_contours(cnts)
cnts = sort_contours(cnts, method="top-to-bottom")[0]

roi_list = []
roi_title_list = []

margin = 20
receipt_grouping = receipt.copy()

for c in cnts:
  (x, y, w, h) = cv2.boundingRect(c)
  ar = w // float(h)

  if ar > 3.0 and ar < 6.5 and (W/2) < x:
    color = (0, 255, 0)
    roi = receipt[y - margin:y + h + margin, x - margin:x + w + margin]
    roi_list.append(roi)
    roi_title_list.append("Roi_{}".format(len(roi_list)))
  else:
    color = (0, 0, 255)

  cv2.rectangle(receipt_grouping, (x - margin, y - margin), (x + w + margin, y + h + margin), color, 2)
  cv2.putText(receipt_grouping, "".join(str(ar)), (x, y - 15), cv2.FONT_HERSHEY_SIMPLEX, 0.65, color, 2)

  plt_imshow(["Grouping Image"], [receipt_grouping], figsize=(16, 10))
아래와 같이 적절하게 추출된 것을 알 수 있다.
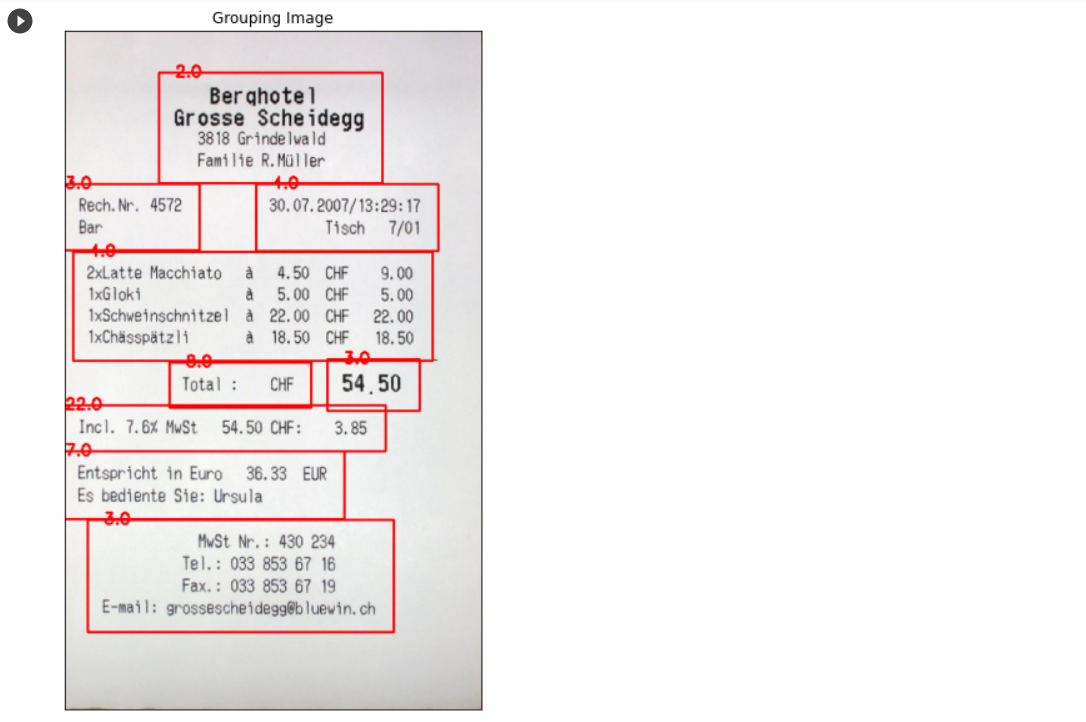
여기까지가 내가 담당한 이미지 전처리 과정 및 이미지 내 영역 추출 튜토리얼이었다.

잘 읽었어요~