Spring Boot + Actuator + Micrometer로 Prometheus 연동하기
이 글은 기존 운영했던 WordPress 블로그인 PyxisPub: Development Life (pyxispub.uzuki.live) 에서 가져온 글 입니다. 모든 글을 가져오지는 않으며, 작성 시점과 현재 시점에는 차이가 많이 존재합니다.
작성 시점: 2020-08-22
이제까지 블로그에서 Prometheus, Grafana 에 대해 여러 번 다룬 적이 있었다.
- Monitoring with cAdvisor + Prometheus + Grafana
- Alert with Grafana
두번째 글 까지 해서 기본적인 Host에 대한 정보를 수집하고 알려주는 것을 했다면, 이제는 직접 서비스에 대한 정보를 수집하고 알려주는 것을 작성해보려고 한다.
마침 작년에 개발했던 개인 프로젝트의 API 서버를 다시 구성하는 일이 있어 마일스톤 'Prometheus 연동' 을 포함하여 진행하였고, 그에 대한 결과를 정리해보려고 한다.
글을 작성하는 시점(2020. 08. 23) 은 새 API 서버가 구성된지 약 일주일 정도밖에 지나지 않았으므로, 많은 데이터를 보여주고 있지는 않다. (기능도 별로 적기도 하다.)
의존성 준비
dependencies {
    ...
    implementation("org.springframework.boot:spring-boot-starter-actuator")
    implementation("io.micrometer:micrometer-registry-prometheus")
    ...
}
Actuator는 Spring Boot 애플리케이션의 정보를 다룰 수 있게 하며, micrometer-registry-prometheus 는 Prometheus가 읽을 수 있는 metrics를 제공하는 역할을 한다.
Actuator 설정
Actuator는 applications.yml 내 management.endpoints.web.exposure.include 라는 옵션을 통해 /actuator 페이지를 통해 노출할 엔드포인트를 설정할 수 있다.
management:
  endpoints:
    prometheus:
      enabled: true
    web:
      exposure:
        include: prometheus
이 글에서는 'Prometheus' 에 대한 연동을 기본으로 하므로, management.endpoints.web.exposure.include 옵션에 promethues 만 정의한다.
이를 설정하고, Spring Boot Application을 열면 아래와 같은 로그를 확인할 수 있다.
INFO 12928 --- [ main] o.s.b.a.e.web.EndpointLinksResolver : Exposing 1 endpoint(s) beneath base path '/actuator'해당 주소로 들어가면, 아래와 같은 json response가 반환되는 것을 확인할 수 있다.
{
  "_links": {
    "self": {
      "href": "http://[ip]:[port]/actuator",
      "templated": false
    },
    "prometheus": {
      "href": "http://[ip]:[port]/actuator/prometheus",
      "templated": false
    }
  }
}
_links 내 management.endpoints.web.exposure.include 에 정의한 항목이 보이게 되고, 각자의 endpoint는 /actuator/prometheus 와 같은 방식으로 접근할 수 있다.
이제 /actuator/prometheus 에 진입하게 되면 아래와 같은 형식의 텍스트가 나열된 것을 볼 수 있다.
# HELP jvm_threads_daemon_threads The current number of live daemon threads
# TYPE jvm_threads_daemon_threads gauge
jvm_threads_daemon_threads 19.0
# HELP system_cpu_count The number of processors available to the Java virtual machine
# TYPE system_cpu_count gauge
system_cpu_count 8.0
# HELP tomcat_sessions_expired_sessions_total
# TYPE tomcat_sessions_expired_sessions_total counter
tomcat_sessions_expired_sessions_total 0.0
여기서 system_cpu_count, jvm_threads_daemon_threads, tomcat_sessions_expired_sessions_total 각각이 Promethues가 인식할 수 있는 Metrics 가 되고, 각 메트릭 위에 HELP (도움말) 과 TYPE를 확인할 수 있다.
이제, 기본적인 메트릭 외에 다른 메트릭을 추가하는 것을 정리해보려고 한다.
타이머 추가하기
모니터링을 하는 일반적인 케이스는 특정 부분에 대해 실행 시간을 기록하고, 실행 시간이 어느 정도를 넘어가면 Alert를 연동하는 케이스가 있을 것이다.
이러한 타이머를 추가하기 위해, micrometer 는 여러 기능을 제공하는데, 먼저 Timer 객체에 대해 알아볼 필요가 있다.
Timer 객체는 아래와 같은 인터페이스를 제공한다.
public interface Timer extends Meter, HistogramSupport {
        void record(long amount, TimeUnit unit);
    <T> T recordCallable(Callable<T> f)
    static Sample start()
}record는 주어진 amount에 대한 기록, recordCallable 는 주어진 block에 대한 기록, start() 는 나중에 기록할 수 있는 Timer.Sample 객체를 제공한다.
가령, record는 아래와 같이 사용할 수 있다.
// registry 는 Autowired로 주입받은 MeterRegistry, 또는 SimpleMeterRegistry 등을 사용해도 된다.
val timer = Timber.builder("query_get_gallery_execution_time").register(registry)

fun recordMillis(name: String, millis: Long) {
    if (timerMap.containsKey(name)) {
        timerMap[name]?.record(Duration.ofMillis(millis))
    }
}

...

protected suspend fun <R> execute(name: String, block: suspend () -> R): R {
    val start = System.currentTimeMillis()
    val result = block()
    val time = System.currentTimeMillis() - start
    metricsTimer.recordMillis(name, time)
    return result
}
위에서는 execute라는 메서드로 통해 직접 time를 계산하고 있지만, timer.recordCallable 를 사용할 수도 있다.
이러한 방식으로 정의했을 경우, actuator의 endpoints에서는 아래와 같이 나오게 된다.
query_get_gallery_execution_time_seconds_max
query_get_gallery_execution_time_seconds_count
query_get_gallery_execution_time_seconds_sum
Timer 객체의 기본 TimeUnit는 Second로, Second에 대한 횟수와 전체 합계가 나온 것을 볼 수 있다. (이를 Grafana에 반영할 때의 Query는 후술하도록 한다.)
Timed 어노테이션
위 Timer 객체로 측정할 수 있지만, 좀 더 간편하게 메서드에 어노테이션을 달아주는 것 만으로도, 해당 메서드의 실행 시간을 측정할 수 있다.
그 것이 Timed 어노테이션이고, 만일 API Endpoint에 대해 측정하고 싶다면, Controller 메서드에 아래와 같이 달아줄 수 있다.
@Timed(value = "get-gallery")
@PostMapping("gallery")
fun getGallery(@RequestBody request: ...) = runBlocking {
...
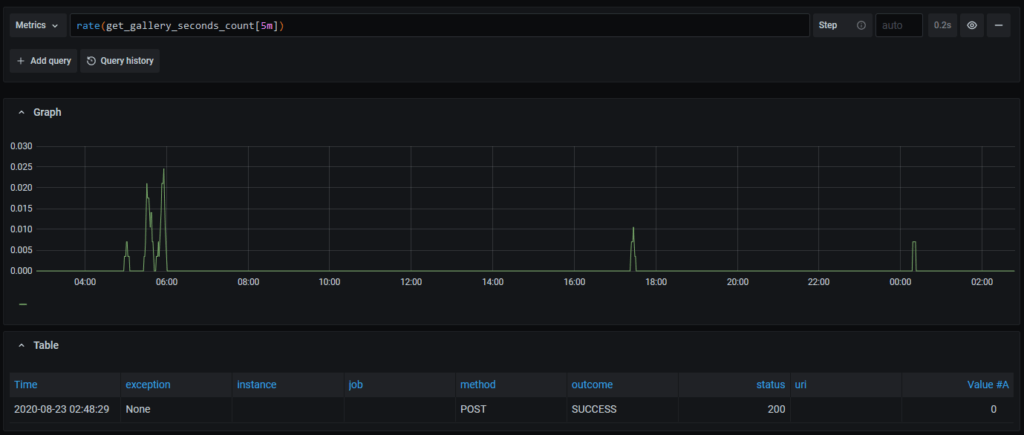
}이러한 방식으로 정의했을 경우, actuator의 endpoints에서는 아래와 같이 나오게 된다.
# HELP get_gallery_seconds_max
# TYPE get_gallery_seconds_max gauge
get_gallery_seconds_max{exception="None",method="POST",outcome="SUCCESS",status="200",uri="...",}
# HELP get_gallery_seconds
# TYPE get_gallery_seconds summary
get_gallery_seconds_count{exception="None",method="POST",outcome="SUCCESS",status="200",uri="...",}
get_gallery_seconds_sum{exception="None",method="POST",outcome="SUCCESS",status="200",uri="...",}
Timer 객체를 다룰 때와 마찬가지로 기본적인 TimeUnit는 Second이므로, _max, _count, _sum 세 개가 정의된 것을 확인할 수 있다.
차이점은 exception, method, outcome, status, uri 등의 정보를 추가로 제공한다는 점이다. 또한, Timed 어노테이션에 value를 붙이지 않았을 때에도 아래와 같이 uri에 대한 정보가 나오게 된다.
http_server_requests_seconds_count{exception="None",method="GET",outcome="SUCCESS",status="200",uri=,}
http_server_requests_seconds_sum{exception="None",method="GET",outcome="SUCCESS",status="200",uri=,}
http_server_requests_seconds_count{exception="IllegalStateException",method="GET",outcome="CLIENT_ERROR",status="400",uri=,}
http_server_requests_seconds_sum{exception="IllegalStateException",method="GET",outcome="CLIENT_ERROR",status="400",uri=,}
Prometheus에 추가하기
위와 같은 작업을 통해 Metrics를 추가했다면, 이제 Prometheus가 actuator endpoint에 접근할 수 있도록 prometheus.yml 에 아래와 같이 추가한다.
global:
  scrape_interval: 15s

scrape_configs:
  - job_name: 'cAdvisor'
    scrape_interval: 15s
    static_configs:
    - targets: ['cadvisor:8080']

...

  - job_name: '...'
    scrape_interval: 15s
    metrics_path: '/actuator/prometheus'
    static_configs:
    - targets: ['[container_name or ip]:[port]']
이제 15초마다 prometheus가 actuator에 접근하여 정보를 가져올 수 있게 되었다.
Grafana 연동하기
마지막으로, 추가한 Metrics 중 Timed 어노테이션으로 추가된 Metric 를 Grafana에 표시하려 한다.
Timer로 추가된 Metric 중 _sum, _count는 Counter 이므로, rate 를 추가하여 표시할 수 있다.

이를 이용해서, 5m 간의 평균 수행 시간을 산출할 수 있다.
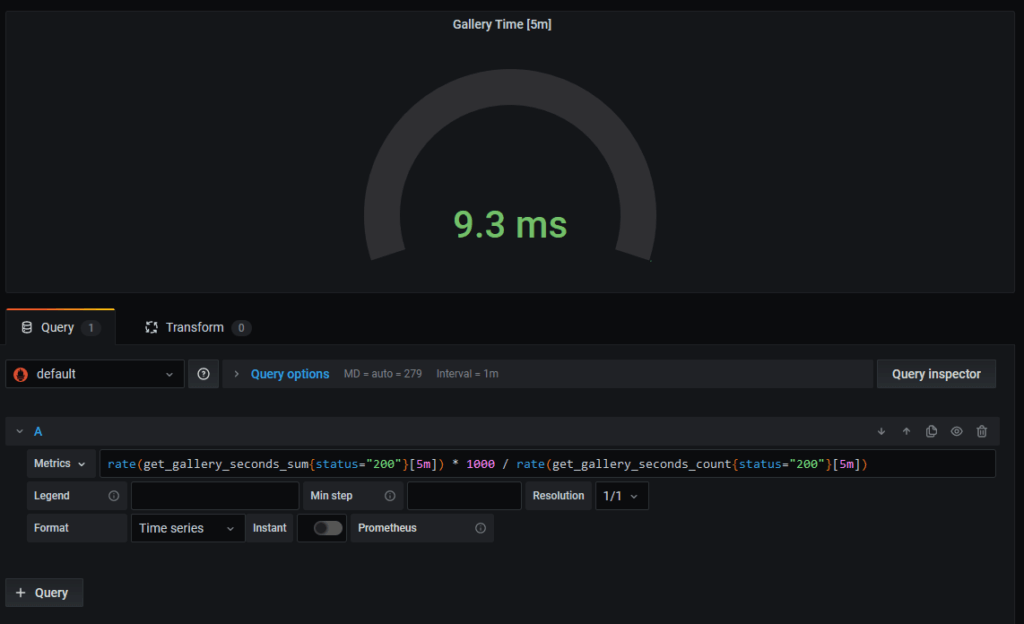
사용한 Query는 rate(get_gallery_seconds_sum{status="200"}[5m]) * 1000 / rate(get_gallery_seconds_count{status="200"}[5m]) 로 아래와 같은 작업을 거친다.
get_gallery_seconds_sum,get_gallery_seconds_countmetrics에 대해 정상 응답(200) 인 것만 선택하여 5분동안의 수치를 꺼낸다.- Timer 객체에서 기록/표시하는 단위가 서로 다르므로 (기록은 Millis, 표시는 Seconds)
get_gallery_seconds_sum에 1000을 곱하여 seconds 로 변환한다. - 두 개의 식을 나눠준다.
- 표시 기준은 Last (Not Null), 단위는 milliseconds (ms) 를 선택한다.