너무나.. 기본적인 내용이라 다들 언급을 안 한 것 같은데
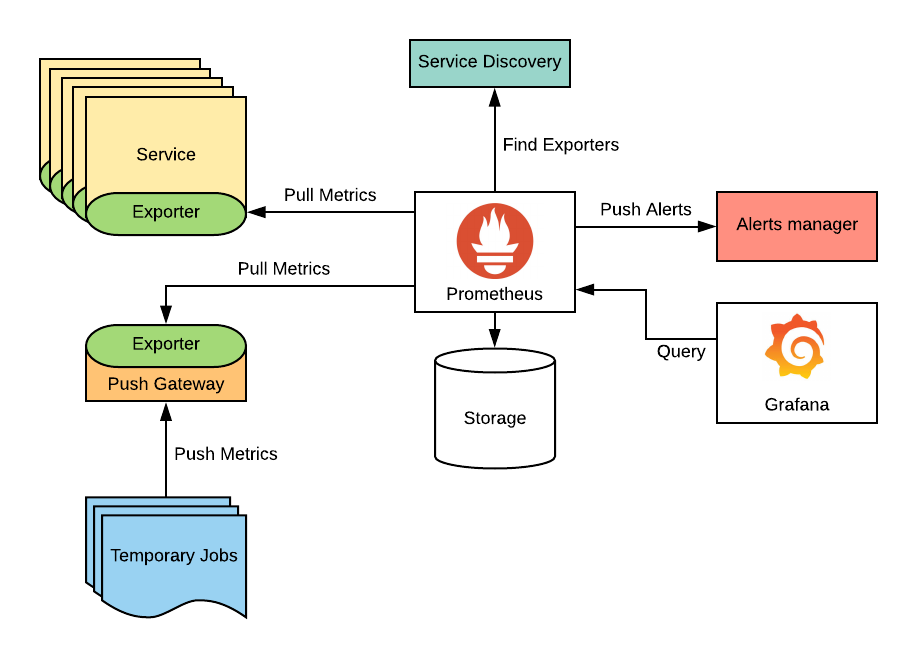
위 구조처럼 push gateway는 prometheus에 속해있다.
여러 가이드에서 localhost:9091로 접근하길래
eks에서 동작하는 나는 external ip를 빼려고 개지랄을 했는데, 그럴 이유가 없다.
로컬에서 쓰라고 만든
Get the PushGateway URL by running these commands in the same shell:
  export NODE_PORT=$(kubectl get --namespace monitoring -o jsonpath="{.spec.ports[0].nodePort}" services prometheus-pushgateway)
  export NODE_IP=$(kubectl get nodes --namespace monitoring -o jsonpath="{.items[0].status.addresses[0].address}")
  echo http://$NODE_IP:$NODE_PORT
를 이용하면 나는 지금 "http://10.0.0.113:31059" 이런 ip가 나오는데
그걸 프로그램에서 호출하도록 하면 되는 것이었다.
    axios({
      method: 'post',
      url: this.pushgatewayUrl,
      data: `${labels.toLabel()} ${this.consumeCounter}`,
      headers: {
        'Content-Type': 'application/x-www-form-urlencoded'
      }
    })
push gateway는 프로메테우스가 이미 보고 있기 때문에 굳이 그라파나에서 설정을 해 줄 이유도 없는 것이었다.
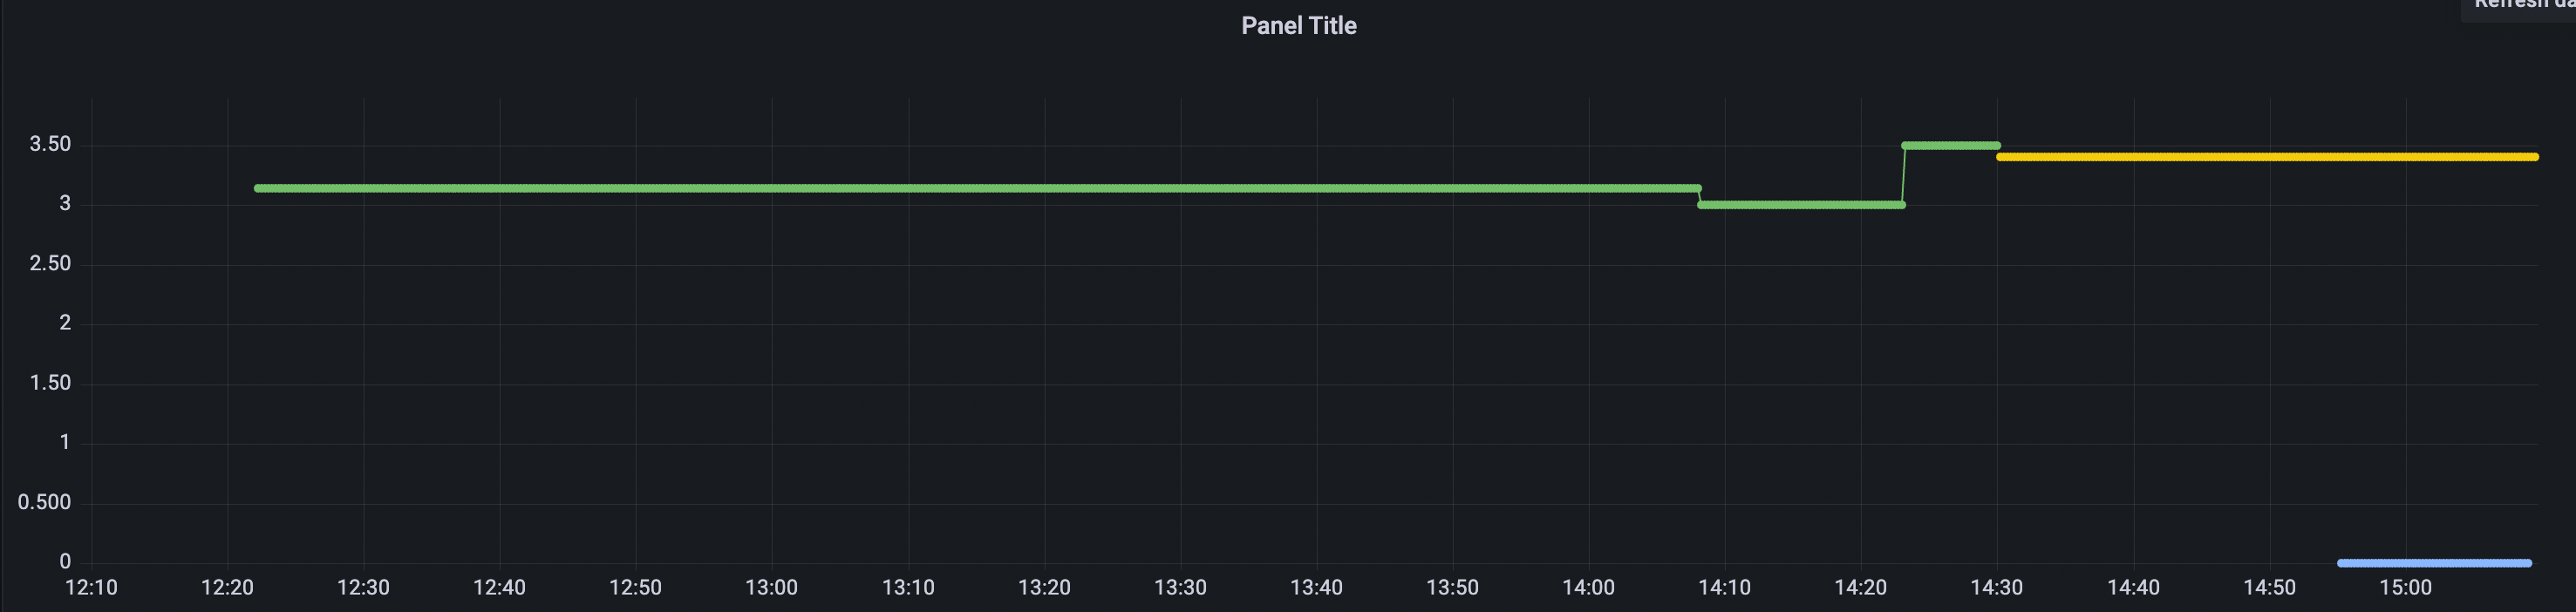
push gateway에 무슨 값이 들어갔는지 보려면
eks에 물린 ec2에 접속해서 curl을 한 다음 눈으로 보거나,
프로메테우스에서 바로 보면 된다.
내용추가
pushgateway의 ip는
kubectl get nodes --namespace monitoring -o jsonpath="{.items[0].status.addresses[0].address}"이라서 배포하거나, 새 인스턴스가 생기거나 하면 바뀌는데, 그걸 굳이 따라가야 할까 의문이 들었다.
그래서 인스턴스의 external ip 기반으로 여러군데에 curl을 해봤는데....
된다! 안된다.
클러스터 내부에서나 되고 외부에서는 응답이 없다.
 curl -X DELETE http://15.164.240.163:31059/metrics/job/some_job
curl: (28) Failed to connect to 15.164.240.163 port 31059 after 75008 ms: Operation timed out
마음 가는 길은 죽 곧은 길