Spring Boot Actuator
。
Spring의상태와 각종지표(Health,Metrics등 )을 확인하고 관리할 수 있도록 해주는모듈
▶어플리케이션 Background에서 모니터링 시Metric들을 노출된endpoint에서 수집하여 어떤 작업이 발생하는지 확인하는 등의 정보를 제공
。/actuator 엔드포인트를 통해CPU, 메모리 사용량, DB 커넥션 상태등 다양한 정보를 노출
。보통Actuator의Endpoint를 노출시켜서 해당Endpoint의Metric을Prometheus에서 수집하여Grafana로 시각화
▶/actuator/prometheus의엔드포인트에서Metric을 수집implementation 'org.springframework.boot:spring-boot-starter-actuator'。
build.gradle에 다음의존성을 정의 후
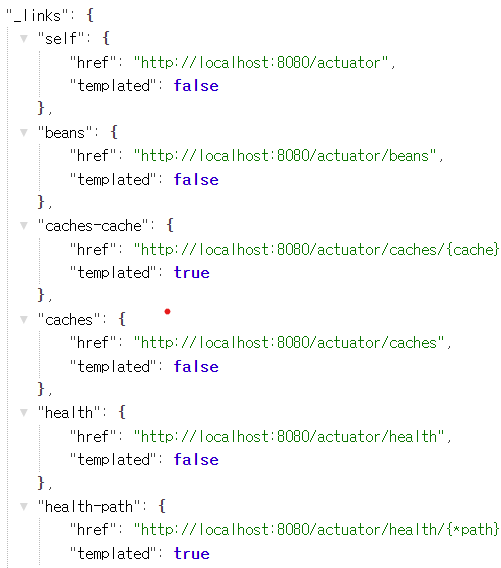
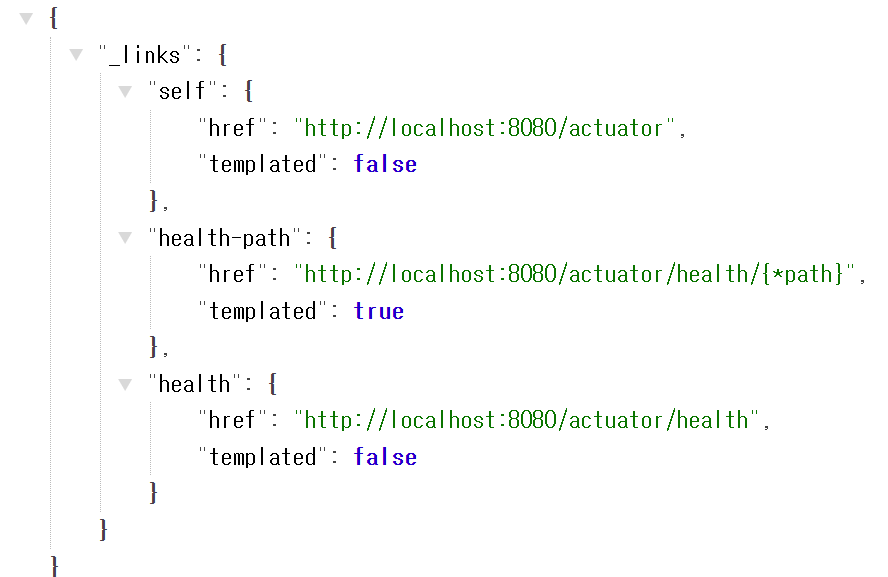
http://localhost:8080/actuator 접속.
▶JSON Format으로 현재 Page의 URL로 연결되는selflink /health URL로 연결되는healthlink가 반환.
。Actuator의Endpoint를 노출 시application.yml에서 정의.
▶기본 설정로actuator 의존성을 추가 시health endpoint만 노출되며 더 많은endpoint를 좀 더 노출시키기 위해 다음 구문을 추가.
management:endpoints:web:exposure:include: "엔드포인트1,...": 특정endpoint노출 시
management:endpoints:web:exposure:include: *: 모든end point를 노출 할 경우.
▶Endpoint를 많이 노출하면 해당 정보를 많이 수집한다는 것을 의미하며 이는 CPU와 메모리를 많이 사용한다는 의미이므로 좋지 않다.management: endpoints: web: exposure: include: "health,metrics,info,prometheus" endpoint: health: show-details: always # 상세한 헬스 정보 표시。 모니터링 시 다음처럼 설정하여 노출된
Endpoint로 표시되는Metric들을Prometheus에 의해 수집
end point 종류
prometheusendpoint
。Prometheus는/actuator/prometheus의엔드포인트에서Metric을 수집
▶spring-boot-starter-actuator 의존성에서 기본적으로 포함
beansendpoint :
application에 포함된 모든 spring bean을 해당 endpoint를 이용하여 선언.
healthendpoint :
application의 정상작동 여부 등 의 상태 정보를 확인
metricsendpoint :
application 관련 metrics 정보를 확인
mappingendpoint :
application에서 정의된 모든 request mapping 관련 세부 사항
configpropsendpoint :
application.properties에서 설정 가능한 모든 항목들이 표시.
envendpoint :
application 환경에 관한 세부 사항을 모두 표시.