1. 구글 maps 위도 경도 데이터 가져오기
import googlemaps

gmaps_key = API키
gmaps = googlemaps.Client(key=gmaps_key)
gmaps.geocode("서울영등포경찰서", language="ko")
2. pandas iterrows() 함수
idx : 데이터프레임의 인덱스
rows : 인덱스를 제외한 나머지 값
for idx, rows in crime_station.iterrows():
    station_name = "서울" + str(idx) + "경찰서"
    tmp = gmaps.geocode(station_name, language="ko")

    tmp_gu = tmp[0].get("formatted_address")

    lat = tmp[0].get("geometry")["location"]["lat"]
    lng = tmp[0].get("geometry")["location"]["lng"]

    crime_station.loc[idx, "lat"] = lat
    crime_station.loc[idx, "lng"] = lng
    crime_station.loc[idx, "구별"] = tmp_gu.split()[2]
칼럼제거
data frame의 칼럼 제거
del crime_anal_gu["강도검거"]
crime_anal_gu.drop(["살인검거", "절도검거", "폭력검거"], axis=1, inplace=True)
3. DataFrame 나눗셈
피제수.div(제수)
num = ["강간검거", "강도검거", "살인검거", "절도검거", "폭력검거"]
den = ["강간발생", "강도발생", "살인발생", "절도발생", "폭력발생"]

crime_anal_gu[num].div(crime_anal_gu[den].values).head()
일괄 열 추가
col = ["강간", "강도", "살인", "절도", "폭력"]
crime_anal_norm["범죄"] = np.mean(crime_anal_norm[col], axis=1)
#numpy는 axis=1 : 행, axis=0 : 열
4. Seaborn
set_style() : white, black, whitegrid, blackgrid
import seaborn as sns

# sns.set_style()

sns.set_style("dark")
plt.figure(figsize=(10,6))
plt.plot(x, y1, x, y2, x, y3, x, y4)
plt.show()- boxplot
- swarmplot
- lmplot
1) Boxplot
hue : 카테고리 데이터를 표현하는 옵션
palette : Set1, Set2, Set3 (colormap)
#boxplot hue, palette option
tips = sns.load_dataset("tips")

plt.figure(figsize=(8,6))
sns.boxplot(x="day", y="total_bill", data=tips, hue="smoker", palette="Set2")
plt.show()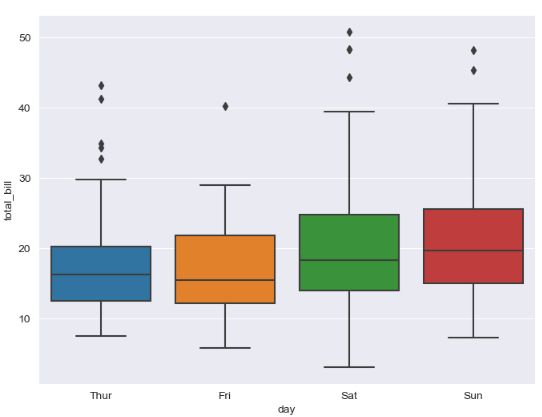
2) Swarmplot
color : 0<=x<=1, black~white
plt.figure(figsize=(8,6))
sns.swarmplot(x="day", y="total_bill", data=tips, color="0")
plt.show()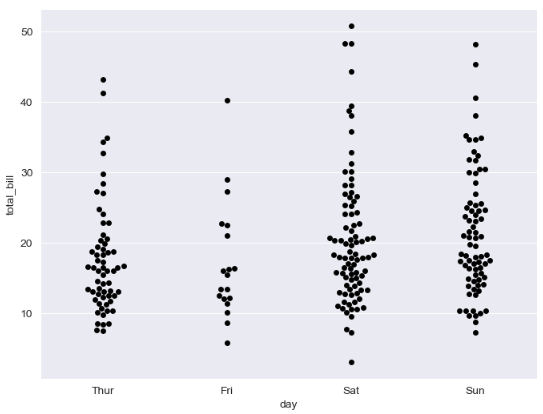
3) lmplot
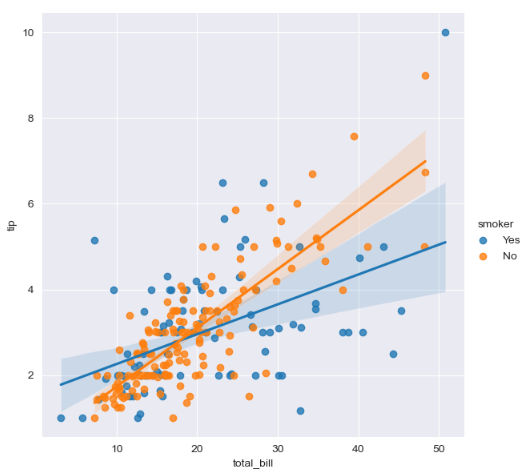
sns.set_style("darkgrid")
sns.lmplot(x="total_bill", y="tip", data=tips, height=6, hue="smoker")
ci : 신뢰구간, height : 크기
sns.set_style("darkgrid")
sns.lmplot(x="x", y="y", data=anscombe.query("dataset == 'I'"), ci=None, height=7)
4) heatmap
annot : heatmap에 숫자 표시여부
fmt : 값 표시형식(d : int, f : float)
# heatmap

plt.figure(figsize=(10, 8))
sns.heatmap(data=flights, annot=True, fmt="d")
plt.show()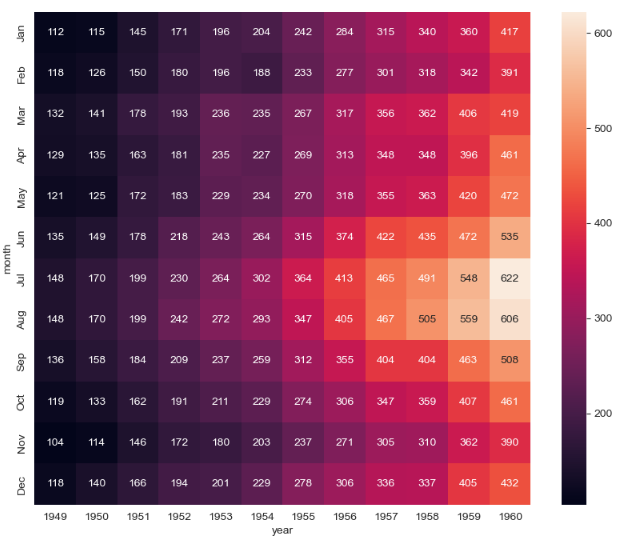
5) pairplot
sns.set_style("ticks")
sns.pairplot(iris)
plt.show()
#조건부 pairplot
sns.pairplot(iris, x_vars=["sepal_width", "sepal_length"], y_vars=["petal_width", "petal_length"])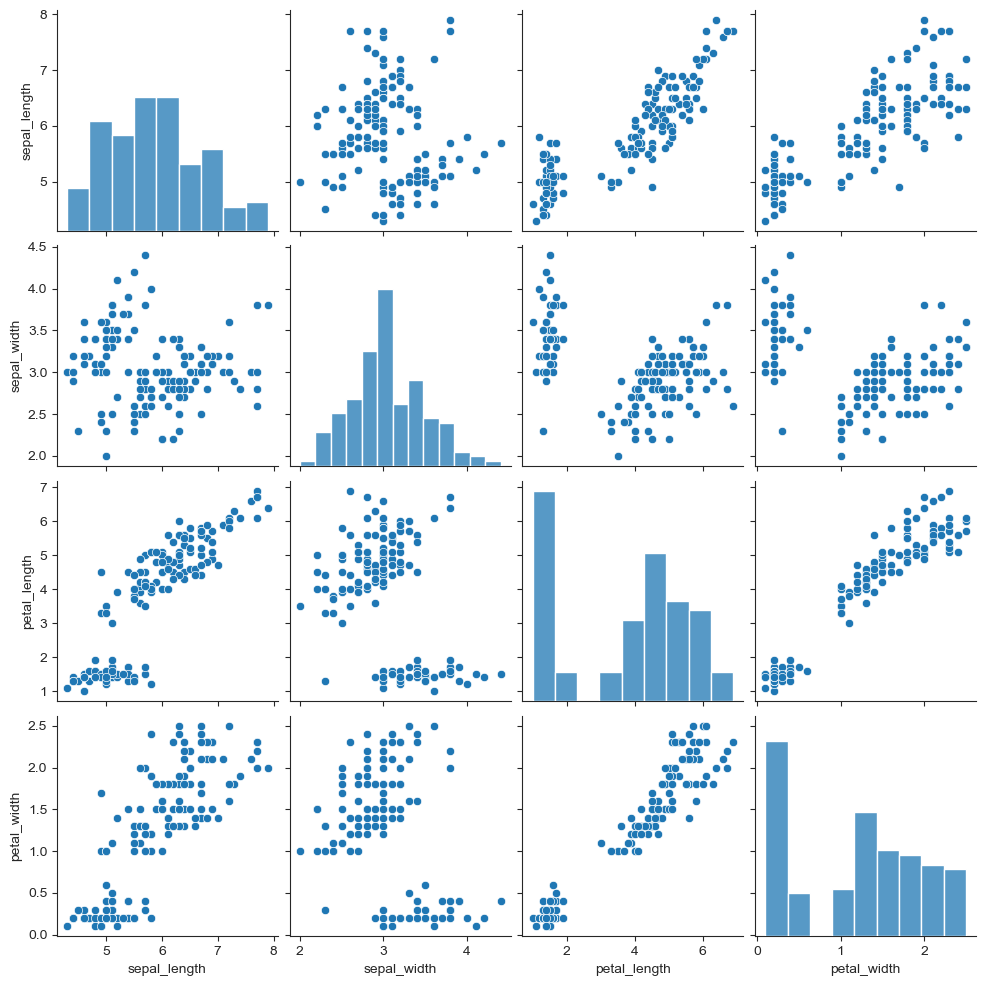

HR Anaylist!