파일 로딩 (mf4 파일 후처리 -> csv 파일 추출)
- asammdf로 필요한 데이터만 추출하여 csv 파일로 저장
- 폴더에 여러 개의 파일을 저장하고, file_list[i]의 i값을 조정하여 필요한 데이터를 plot하고, 이미지 파일로 저장
import os

def add_character_to_list_elements(input_list, char):
    # 문자열 리스트의 각 요소에 특정 문자(하위 경로)를 추가하는 메서드

    new_list = []
    for element in input_list:
        new_list.append(char + element)
    return new_list

path = './data/'
file_list = os.listdir(path)

file_list = add_character_to_list_elements(file_list, path)file_list['./data/data.csv']import pandas as pd
i = 0
file_list[i]'./data/data.csv'data = pd.read_csv(file_list[i])
data| timestamps | TC_Speed | Vtc_vVeh16 | Epm_N1tooth | |
|---|---|---|---|---|
| 0 | 0.006711 | 34939.120000 | 45.968750 | 1661.000000 |
| 1 | 0.010480 | 34971.246956 | 45.968750 | 1661.000000 |
| 2 | 0.010630 | 34972.525556 | 45.968750 | 1660.954670 |
| 3 | 0.016711 | 35024.360000 | 45.969224 | 1659.117005 |
| 4 | 0.026711 | 35127.520000 | 45.970003 | 1656.095027 |
| ... | ... | ... | ... | ... |
| 610395 | 3572.502276 | 8754.040000 | 0.000000 | 650.539497 |
| 610396 | 3572.505639 | 8751.497572 | 0.000000 | 652.000000 |
| 610397 | 3572.512276 | 8746.480000 | 0.000000 | 652.000000 |
| 610398 | 3572.522276 | 8741.280000 | 0.000000 | 652.000000 |
| 610399 | 3572.532276 | 8740.840000 | 0.000000 | 652.000000 |
610400 rows × 4 columns
file_list[i]'./data/data.csv'file_list[i] = file_list[i].strip(".csv")
file_list[i]
'/data/data'#file_list[i] = file_list[i].lstrip("./data/")
file_list[i] = file_list[i].strip("/data/") # 왜 다 지워버리나? (250819)
file_list[i]''다른 스케일의 그래프 여러 개 그리기(twinx())
# 다른 스케일의 그래프 여러 개 그리기

import matplotlib.pyplot as plt

fig, ax = plt.subplots()
fig.subplots_adjust(right=1)

twin1 = ax.twinx()
twin2 = ax.twinx()
#twin3 = ax.twinx()

twin2.spines.right.set_position(("axes", 1.2))

p1, = ax.plot(data.iloc[:, 0], data.iloc[:, 3], "b--", linewidth=0.5, label=("Engine speed (rpm)"))
p2, = twin1.plot(data.iloc[:, 0], data.iloc[:, 1], "r--", linewidth=0.5, label=("Turbo speed (rpm)"))
p3, = twin2.plot(data.iloc[:, 0], data.iloc[:, 2], "g--", linewidth=0.5, label=("Vehicle Speed (km/h)"))

ax.set_xlim(0, round(data.iloc[-1, 0]+100, -1))
ax.set_ylim(0, 7000)
twin1.set_ylim(0, 250000)
twin2.set_ylim(0, 200)

ax.set_xlabel("Time (sec)")
ax.set_ylabel("Engine speed (rpm)")
twin1.set_ylabel("Turbo speed (rpm)")
twin2.set_ylabel("Vehicle speed (km/h)")

ax.yaxis.label.set_color(p1.get_color())
twin1.yaxis.label.set_color(p2.get_color())
twin2.yaxis.label.set_color(p3.get_color())

tkw = dict(size=4, width=1)
ax.tick_params(axis='y', colors=p1.get_color(), **tkw)
twin1.tick_params(axis='y', colors=p2.get_color(), **tkw)
twin2.tick_params(axis='y', colors=p3.get_color(), **tkw)
ax.tick_params(axis='x', **tkw)

ax.legend(handles=[p1, p2, p3])

title = file_list[i].strip(".csv").strip("./data/")

plt.title(title, pad=20)
# plt.show()

# 그래프를 이미지 파일로 일괄 출력
file_list[i] = title +'.png'
plt.savefig(file_list[i], facecolor='#ffffff', bbox_inches='tight')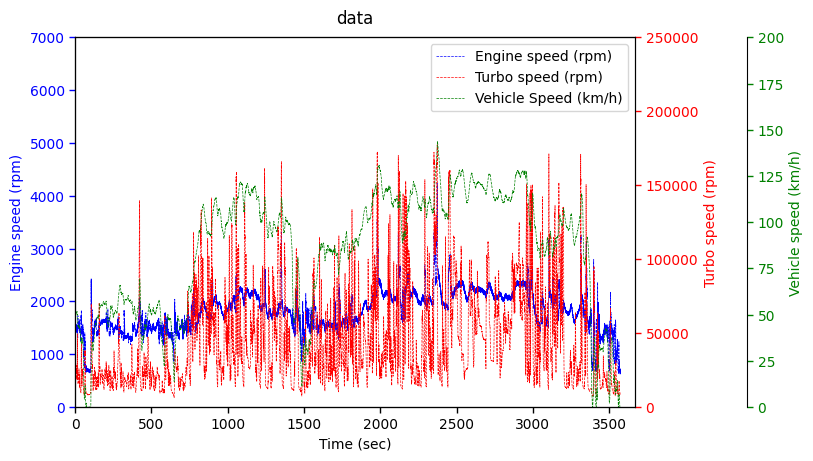

Hello, I'm Terry! 👋 Enjoy every moment of your life! 🌱 My current interests are Signal processing, Machine learning, Python, Database, LLM & RAG, MCP & ADK, Multi-Agents, Physical AI, ROS2...