chrome://webrtc-internals/
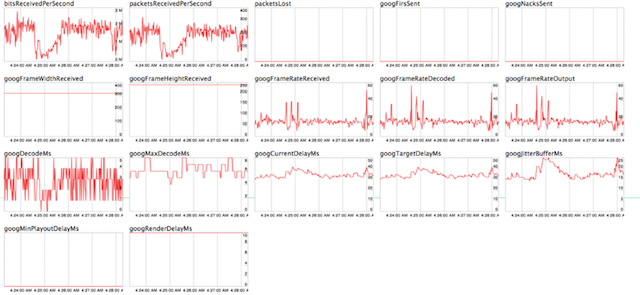
WebRTC를 접해본 개발자라면 이미 알고 있는 것이겠지만, chrome 브라우저에서는 chrome://webrtc-internals/ 으로 WebRTC 연결에 대한 자세한 통계를 볼 수 있다. bitrate, jitter, loss, rtt 등의 통계정보가 실시간으로 업데이트 되며 디버깅 할때 매우 유용하다.
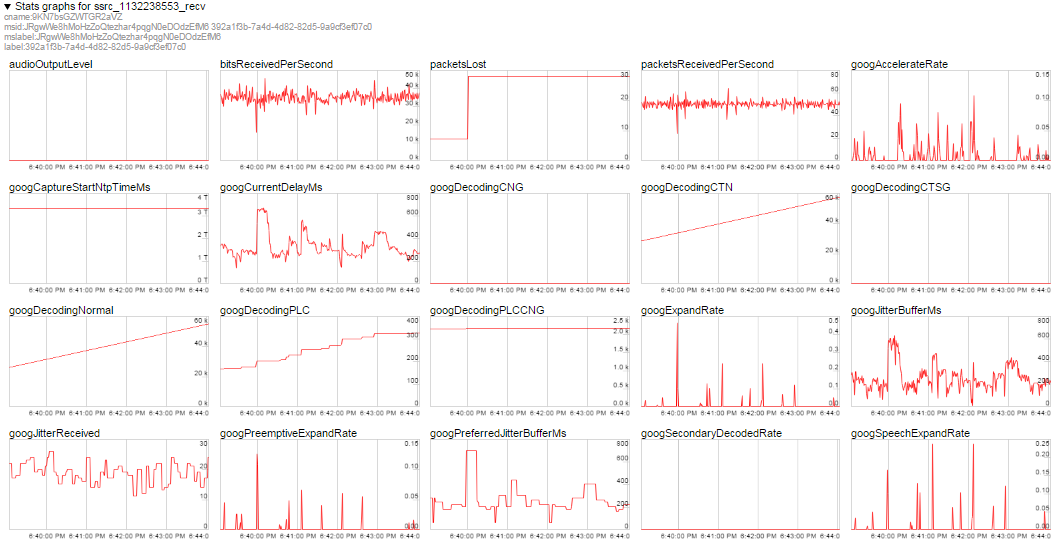
디버깅할 때는 chrome://webrtc-internals/ 페이지를 열어서 연결 상태를 확인하면 됩니다.
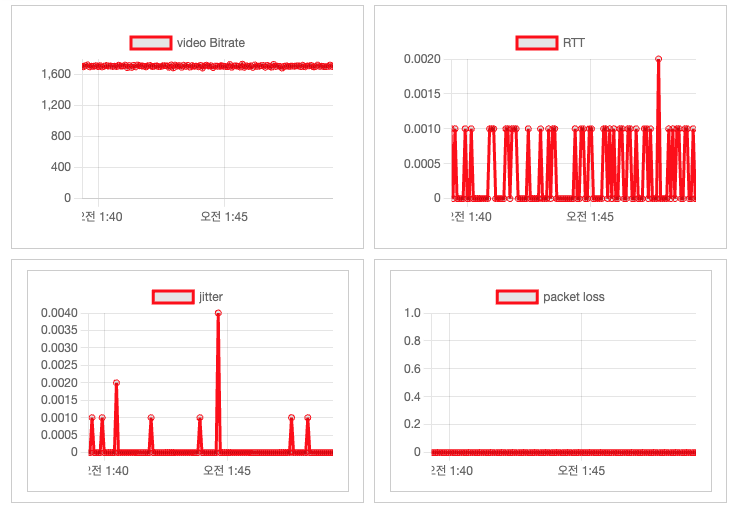
하지만 현재 연결 상태 정보를 사용자에게 실시간으로 이쁘게 보여주어야 한다면?
이 통계 데이터는 RTCPeerConnection의 getStats()를 기반으로 시각화한 것이기 때문에 ChartJS으로 직접 그릴 수 있다.
WebRTCStatsVisualizer
통계를 보여줄 ChartJS wrapper component는 아래 코드 참조. chat-gpt가 만들어준 코드 ^^ (코딩 테스트가 무슨 의미가 있는가)
import React from "react";
import { Chart, ChartConfiguration, registerables } from "chart.js";
import "chartjs-adapter-luxon";
import StreamingPlugin from "chartjs-plugin-streaming";

Chart.register(...registerables, StreamingPlugin);

type WebRTCStatsVisualizerProps = {
  label: string;
  borderColor: string;
  width: number;
  height: number;
};

export type WebRTCStatsVisualizerHandle = {
  pushData: (timestamp: number, value: number) => void;
};

const WebRTCStatsVisualizer = React.forwardRef<
  WebRTCStatsVisualizerHandle,
  WebRTCStatsVisualizerProps
>((props, ref) => {
  const { label, borderColor, width, height } = props;

  const chartRef = React.useRef<Chart | null>(null);
  const canvasRef = React.useRef<HTMLCanvasElement>(null);

  const data = React.useMemo(
    () => ({
      labels: [],
      datasets: [
        {
          label,
          data: [],
          fill: false,
          borderColor,
        },
      ],
    }),
    [label, borderColor]
  );

  React.useEffect(() => {
    const ctx = canvasRef.current!.getContext("2d")!;
    const config: ChartConfiguration<"line"> = {
      type: "line",
      data,
      options: {
        responsive: true,
        scales: {
          x: {
            type: "realtime",
            realtime: {
              duration: 60_000 * 10,
              delay: 5_000,
              refresh: 5_000,
            },
          },
          y: {
            beginAtZero: true,
          },
        },
      },
    };
    chartRef.current = new Chart(ctx, config);

    return () => {
      if (chartRef.current) {
        chartRef.current.destroy();
      }
    };
  }, [data]);

  React.useImperativeHandle(ref, () => ({
    pushData(timestamp: number, value: number) {
      if (chartRef.current) {
        chartRef.current.data.datasets[0].data.push({ x: timestamp, y: value });
        chartRef.current.update("none");
      }
    },
  }));

  return (
    <div>
      <canvas ref={canvasRef} width={width} height={height} />
    </div>
  );
});

export default WebRTCStatsVisualizer;
이제 원하는 곳에 넣자.
getStats()으로 원하는 metric을 가져와서 WebRTCStatsVisualizer에 주기적으로 push 해주면 된다.
  // Collect stats
    pc.getStats().then((stats) => {
      stats.forEach((report) => {
        if (report.type === "candidate-pair") {
          rttRef.current!.pushData(
            new Date().getTime(),
            report.currentRoundTripTime
          );
        }
      });
    });

...

  <WebRTCStatsVisualizer
      ref={rttRef}
      label="RTT"
      borderColor="rgb(255, 0, 0, 1)"
      width={300}
      height={200}
  />
GITHUB: https://github.com/hissinger/webrtc-stats-visualizer

developer
오 유용한 글 감사합니다 ^^*