Metrics Server
개요
- Metric = Kubernetes에서 Monitoring으로 감시하기 위한 대상 자원들
- CPU 및 Memory 사용량과 같은 리소스 사용량을 확인
- kubectl top을 사용하여 사용자가 직접 액세스 혹은 HPA같은 클러스터의 컨트롤러에서 사용
Metrices 4계층
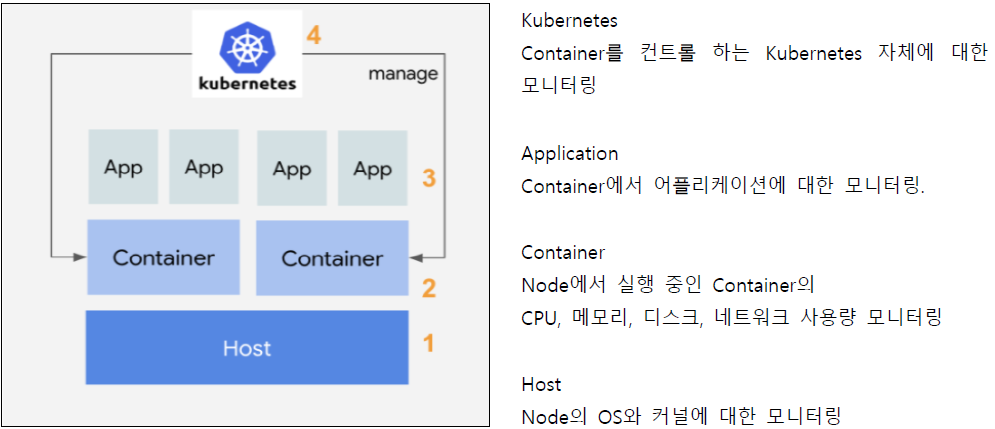
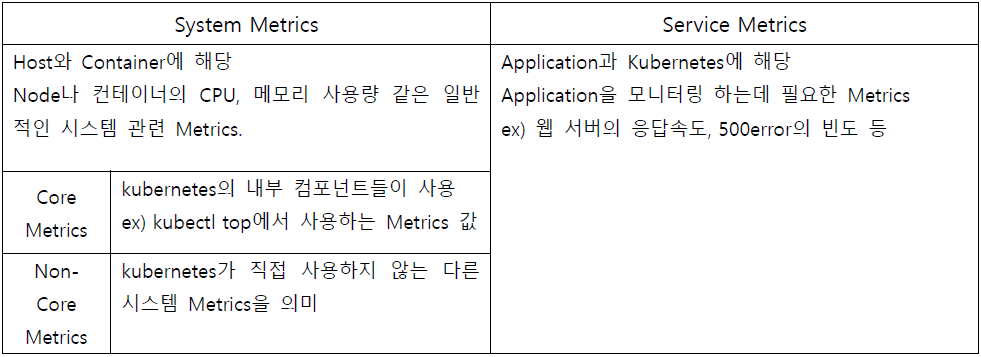
Metrices 종류
Metrices 수집 방법
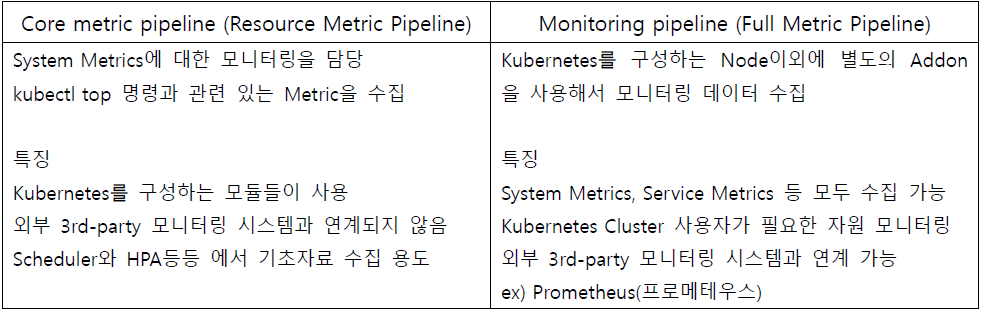
Core metric pipeline (Resource Metric Pipeline) 종류
-
cAdvisor
- Kubernetse 에서 사용하는 기본적인 모니터링 Agent
- 모든 Worker Node의 Kubelet은 CAdvisor를 자체적으로 내장
- CAdvisor를 통해 Node, Pod, Container에 대한 System Metric정보를 수집
- 해당 정보는 이후에 Metric Server, Prommetheus에서 수집 -
Metric Server
- kubernetes Addon 종류 중 하나로 공식적으로 Kubernetes에서 개발
- Cadvisor가 kubelet에 전달한 System Metric 정보 메모리에 저장
- 메모리에 저장하여 비영구적으로 짧은 기간의 데이터만 보관 -
k8s Aggregator
- 기본으로 kubernetes에서 제공하는 API이외 더 많은 기능을 사용하기 위해 API 추가하는 역할
- k8s Aggregator를 통해 custom api를 Kube-apiserver에 등록 -
Metric API
- k8s Aggregator를 통해 Metric Server에서 사용할 Custom API인 Metric API를 등록
- Metric Server Addon을 설치 시 Metric API까지 한 번에 설치
Metrics Server 설치
kubectl apply -f https://github.com/kubernetes-sigs/metrics-server/releases/latest/download/components.yaml
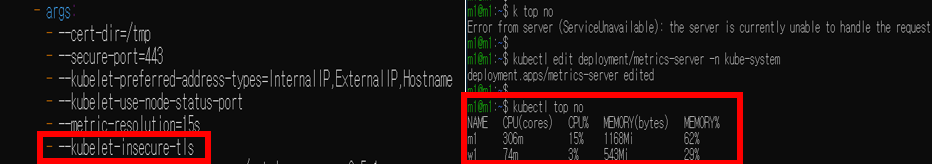
kubectl edit deployment/metrics-server -n kube-system
# args에 --kubelet-insecure-tls 입력
# kubelet-insecure-tls → 테스트에서만 사용 권장
# 인증서가 공인 기관 승인 받지 않아 안전하지 않기 때문에 보안적으로 취약하지만 무시하겠다는 의미아래와 같이 kubectl top 명령어 확인
HAP(Horizontal Pod Autoscaler)
개요
- System Metric에 해당하는 Node, Container의 CPU, 메모리 사용량을 Core metric pipeline방법으로 관찰
- Replicaset, Deployment 등 Controller로 Pod의 개수를 자동으로 조절
- 크기를 조정할 수 없는 Object에는 적용되지 않음.
- Metrics-Server가 정상적으로 배치가 되면 HPA가 동작
※ CPU 1 Core = about 1000m
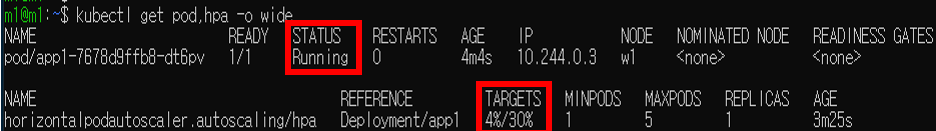
HAP 배포
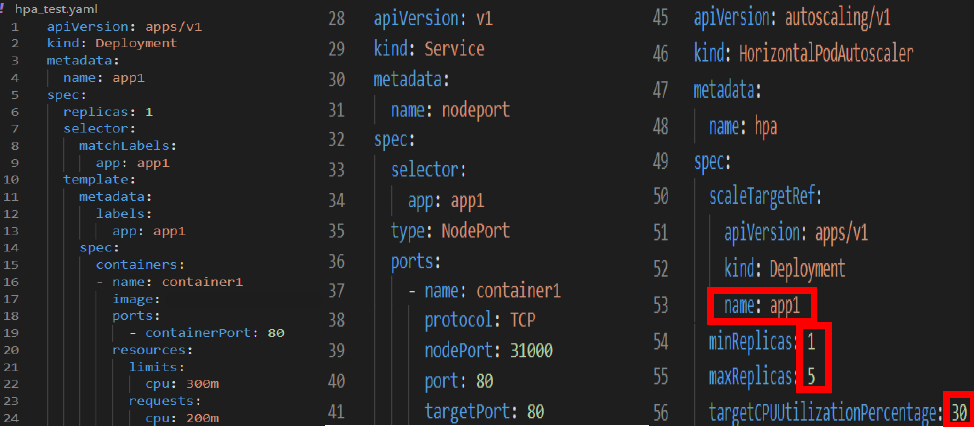
아래와 같이 배포된 것을 확인
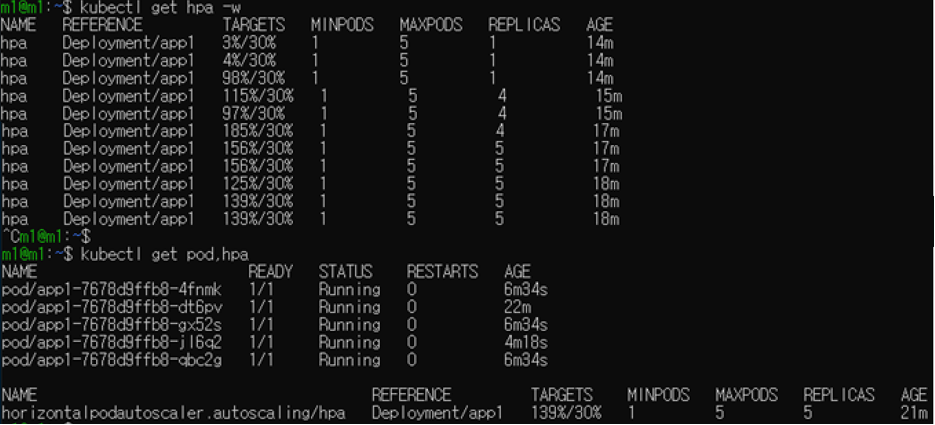
부하테스트
# while true;do curl WAS주소;done
while true;do curl 192.168.223.139:31000/login.php;done
아래와 같이 과부하 시 Pod 개수가 증가하는 것을 확인
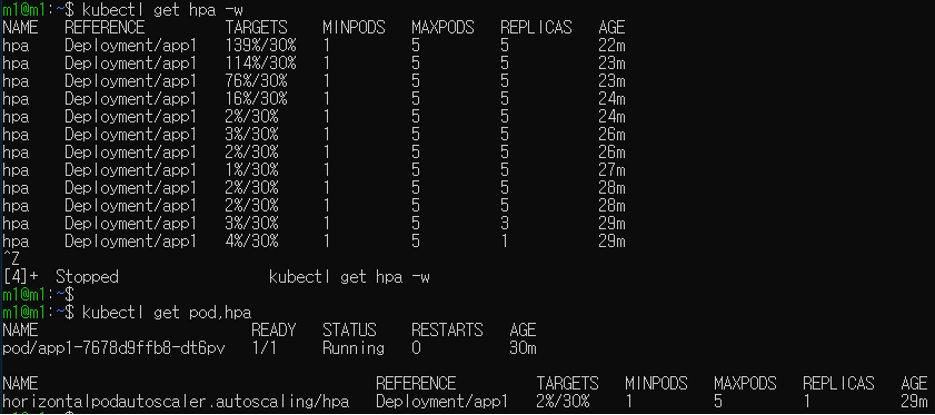
아래와 같이 과부하 종료 시 Pod 개수가 줄어든 것을 확인
Prometheus
개요
- Kubernetes 공식 Metric 수집 및 대시보드 모니터링 구축 시 Kubernetes에서 사용 권장
- Monitoring pipeline (Full Metric Pipeline) 방법으로 Metrics 수집
- Metric Data를 Prometheus Web Console 또는 Grafana와 같은 GUI tool을 사용하여 시각화
- Slack, Email 등으로 알람 내용 전달 및 실시간 모니터링 대상 추가 및 제거
Prometheus 설치
Prometheus 설치 전 Helm과 NFS 동적 프로비저닝 확인 및 설치
prometheus_values.yaml 파일 생성
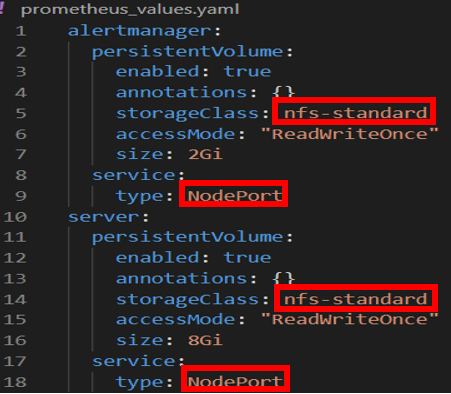
# Helm 저장소 추가
helm repo add prometheus-community https://prometheus-community.github.io/helm-charts
helm repo update
# prometheus 설치
kubectl create ns pro
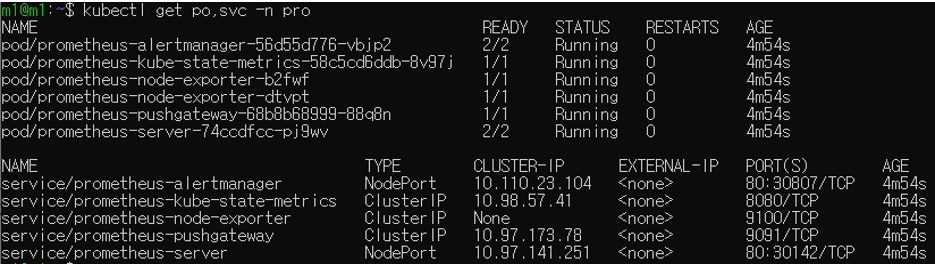
helm install -n pro -f prometheus_values.yaml my-prometheus prometheus-community/prometheus아래와 같이 prometheus가 설치된 것을 확인
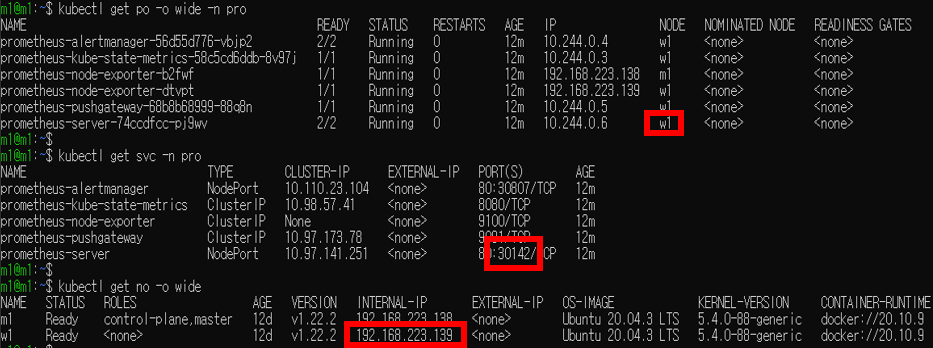
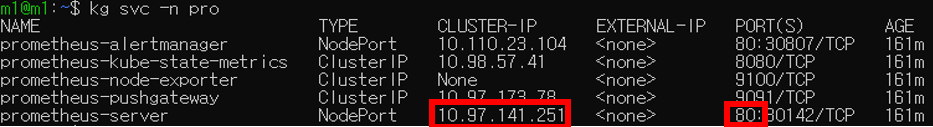
Prometheus 접속
prometheus-server의 IP 및 NodePort 확인
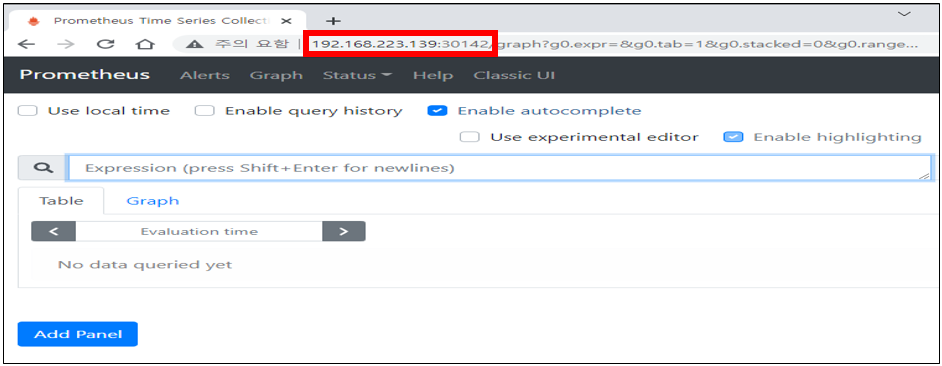
아래와 같이 접속, prometheus-server 주소로 접속된 것을 확인
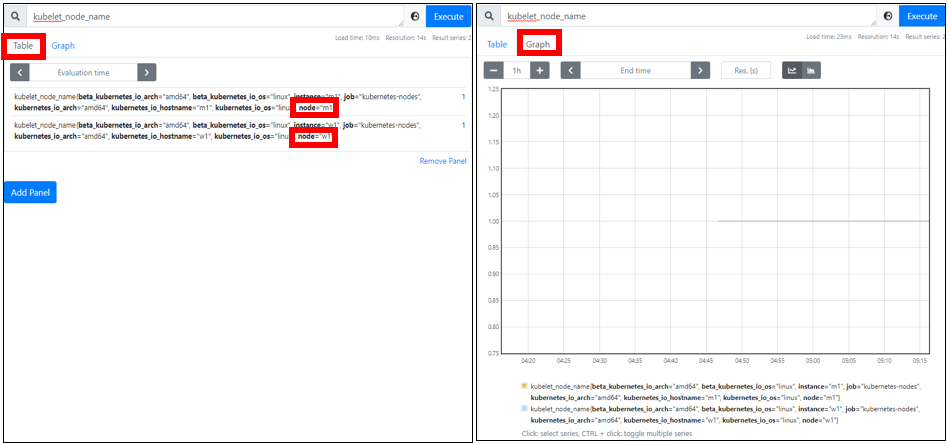
Metric 확인
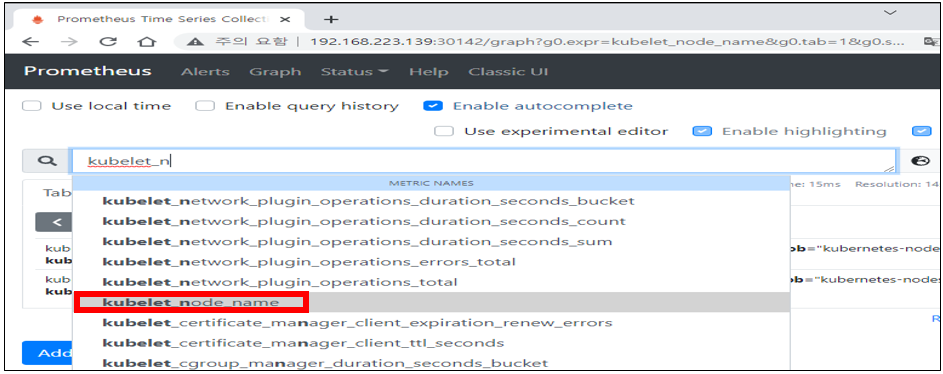
아래와 같이 Prometheus로 Node Name 확인
Grafana
개요
- Prometheus Web UI 보다 더 나은 시계열 데이터에 대한 대시보드를 제공하는 Data Visualization Tool
- 다양한 DB를 연결하여 DB의 데이터를 가져와 시각화
Grafana 설치
Grafana 설치 전 Helm 확인 및 설치
grfana_values.yaml 파일 생성
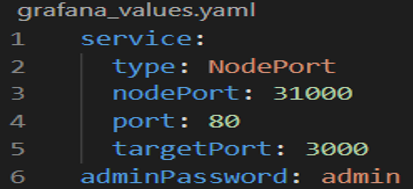
# Helm 저장소 추가
helm repo add grafana https://grafana.github.io/helm-charts
helm repo update

# prometheus 설치
kubectl create ns grafana
helm install -n grafana -f grafana_values.yaml my-grafana grafana/grafana
아래와 같이 grafana가 설치된 것을 확인
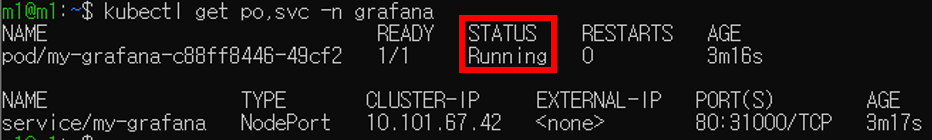
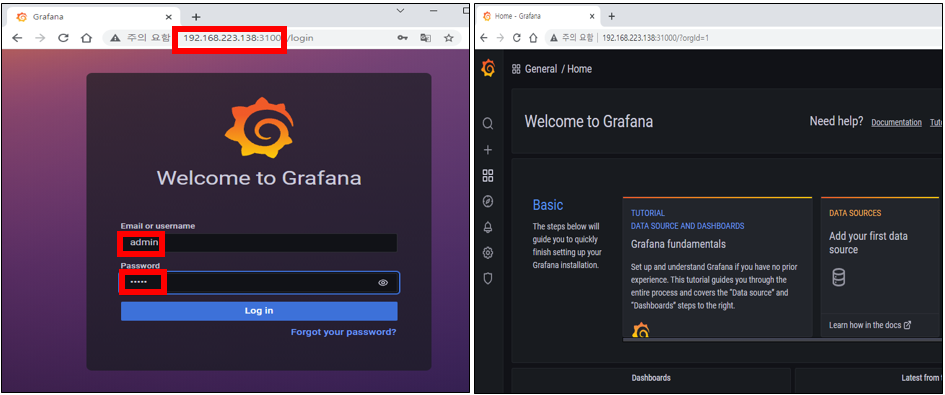
Grafana 접속
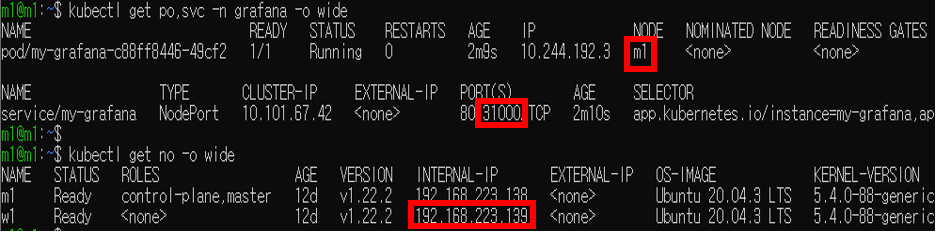
아래와 같이 접속된 것을 확인
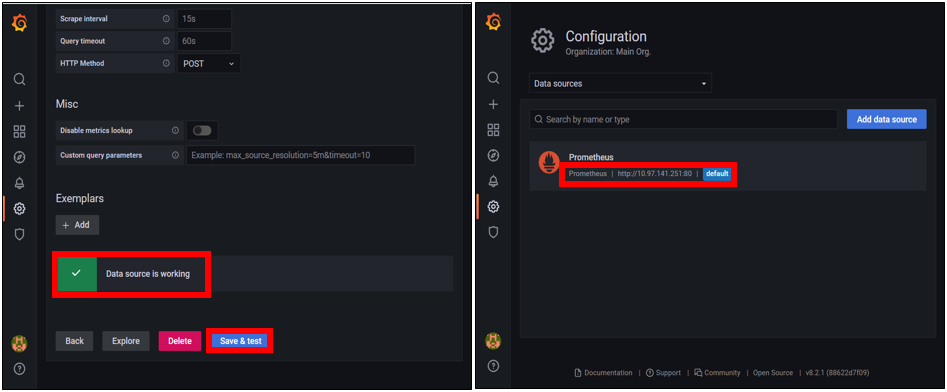
Prometheus, Grafana 연동
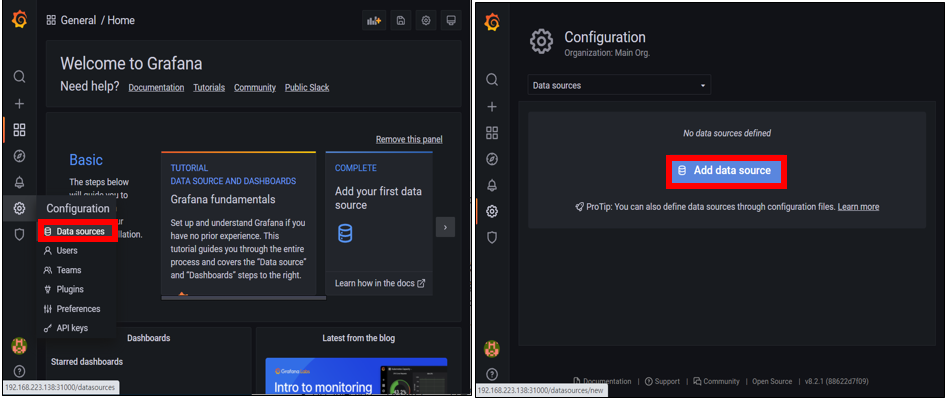
연동을 위해 Prometheus 주소 확인
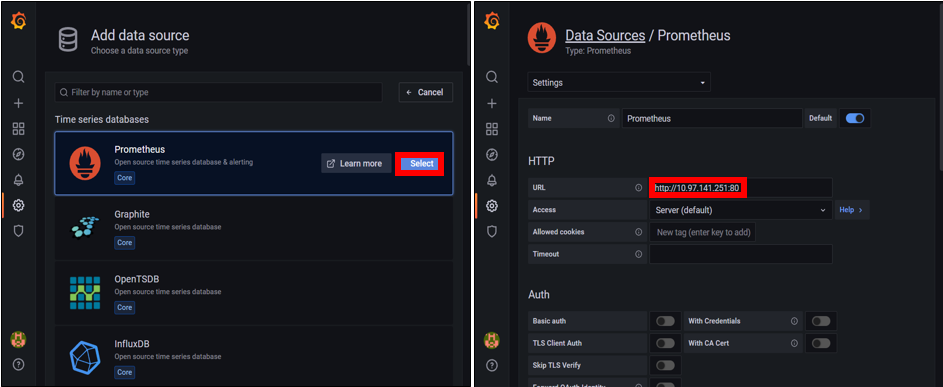
아래와 같이 성공적으로 연동된 것을 확인
Dashbord 설정
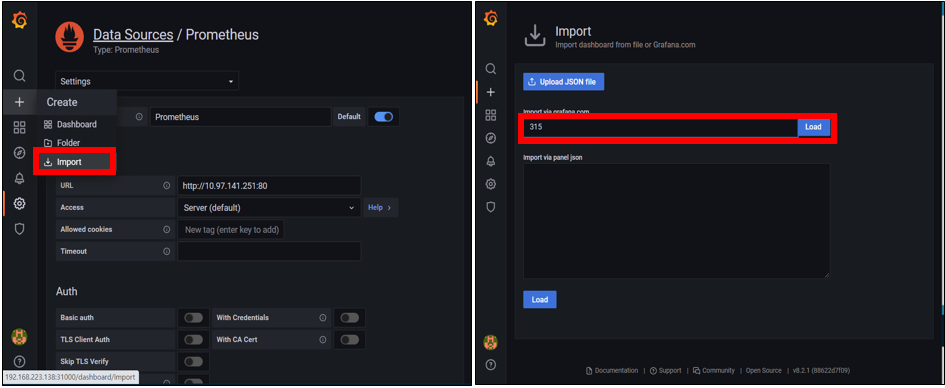
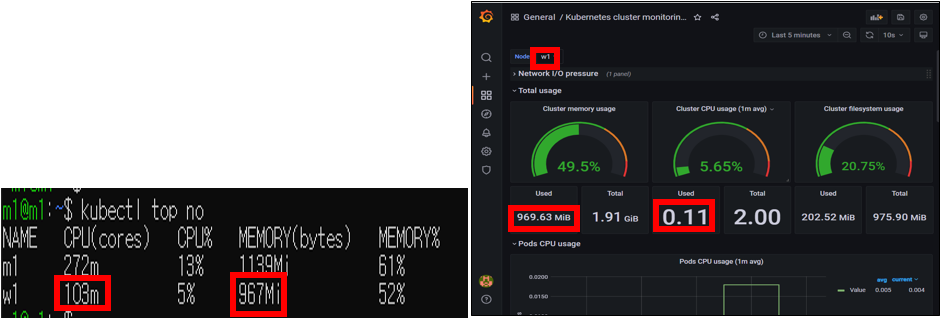
아래와 같이 Dashbord 설정된 것을 확인
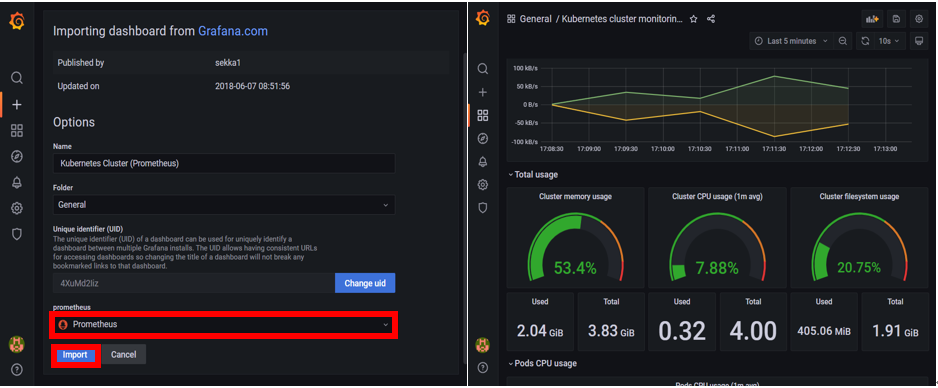
Node w1의 사용량과 동일한 것을 확인
Can Do It
brb
