피어슨 상관계수
- 가장 대표적으로 많이 사용하는 상관계수
피어슨 상관계수
- 두 연속형 변수 간의 선형 관계를 측정하는 지표
- -1에서 1 사이의 값을 가지며
- 1은 완전한 양의 선형 관계
- -1은 완전한 음의 선형 관계
- 0은 선형 관계가 없음을 의미
import numpy as np
import pandas as pd
import matplotlib.pyplot as plt
import seaborn as sns
from scipy.stats import pearsonr
피어슨 상관계수는 언제 사용할까?
- 선형적인 관계가 예상 될 때
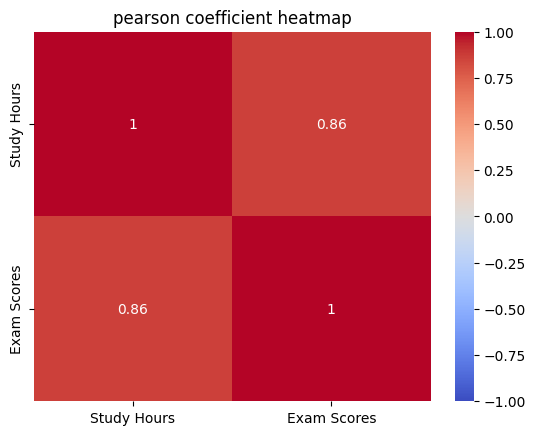
- 공부 시간과 시험 점수 간의 상관관계 분석
- 비선형 관계에선 사용할 수 없음
# 예시 데이터 생성
np.random.seed(0)
study_hours = np.random.rand(100) * 10
exam_scores = 3 * study_hours + np.random.randn(100) * 5

# 데이터프레임 생성
df = pd.DataFrame({'Study Hours': study_hours, 'Exam Scores': exam_scores})

# 피어슨 상관계수 계산
pearson_corr, _ = pearsonr(df['Study Hours'], df['Exam Scores'])
print(f"피어슨 상관계수: {pearson_corr}")

# 상관관계 히트맵 시각화
sns.heatmap(df.corr(), annot=True, cmap='coolwarm', vmin=-1, vmax=1)
plt.title('pearson coefficient heatmap')
plt.show()
비모수 상관계수
- 데이터가 정규분포를 따르지 않을 때 사용하는 상관계수
비모수 상관계수
- 데이터가 정규분포를 따르지 않거나 변수들이 순서형 데이터일 때 사용하는 상관계수
- 데이터의 분포에 대한 가정 없이 두 변수 간의 상관관계를 측정할 때 사용
- 대표적으로 스피어만 상관계수와 켄달의 타우 상관계수가 있음
가. 스피어만 상관계수
- 두 변수의 순위 간의 일관성을 측정
- 켄달의 타우 상관계수 보다 데이터 내 편차와 에러에 민감
나. 켄달의 타우 상관계수
- 순위 간의 일치 쌍 및 불일치 쌍의 비율을 바탕으로 계산
- ex) 예를들어 사람의 키와 몸무게에 대해 상관계수를 알고자 할 때 키가 크고 몸무게도 더 나가면 일치 쌍에 해당, 키가 크지만 몸무게가 더 적으면 불일치 쌍에 해당 이들의 개수 비율로 상관계수를 결정
비모수 상관계수는 언제 사용?
- 데이터의 분포에 대한 가정을 하지 못할 때
- 순서형 데이터에서도 사용하고 싶을 때
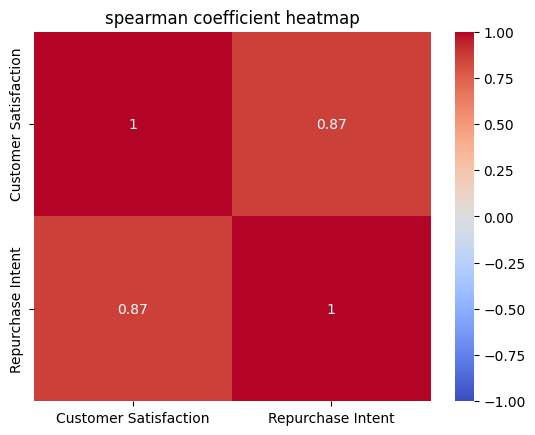
from scipy.stats import spearmanr, kendalltau

# 예시 데이터 생성
np.random.seed(0)
customer_satisfaction = np.random.rand(100)
repurchase_intent = 3 * customer_satisfaction + np.random.randn(100) * 0.5

# 데이터프레임 생성
df = pd.DataFrame({'Customer Satisfaction': customer_satisfaction, 'Repurchase Intent': repurchase_intent})

# 스피어만 상관계수 계산
spearman_corr, _ = spearmanr(df['Customer Satisfaction'], df['Repurchase Intent'])
print(f"스피어만 상관계수: {spearman_corr}")

# 켄달의 타우 상관계수 계산
kendall_corr, _ = kendalltau(df['Customer Satisfaction'], df['Repurchase Intent'])
print(f"켄달의 타우 상관계수: {kendall_corr}")

# 상관관계 히트맵 시각화
sns.heatmap(df.corr(method='spearman'), annot=True, cmap='coolwarm', vmin=-1, vmax=1)
plt.title('spearman coefficient heatmap')
plt.show()
상호정보 상관계수
- 상호정보를 이용한 변수끼리의 상관계수 계산
상호정보 상관계수 (Mutual Information Coefficient)
- 두 변수 간의 상호 정보를 측정
- 변수 간의 정보 의존성을 바탕으로 비선형 관계를 탐지
- 서로의 정보에 대한 불확실성을 줄이는 정도를 바탕으로 계산
- 범주형 데이터에 대해서도 적용 가능
- 상호정보 상관계수를 그림으로 확인해보기
- 보라색 점들은 X와 Y 간의 비선형 관계를 나타냄
- 상호 정보 값은 0.90으로 표시되어 있으며, 이는 두 변수 간의 강한 비선형 의존성을 의미
상호정보 상관계수는 언제 사용할까?
- 두 변수가 범주형 변수이거나, 비선형적이고 복잡한 관계를 탐지하고자 할때
import numpy as np
from sklearn.metrics import mutual_info_score

# 범주형 예제 데이터
X = np.array(['cat', 'dog', 'cat', 'cat', 'dog', 'dog', 'cat', 'dog', 'dog', 'cat'])
Y = np.array(['high', 'low', 'high', 'high', 'low', 'low', 'high', 'low', 'low', 'high'])

# 상호 정보량 계산
mi = mutual_info_score(X, Y)
print(f"Mutual Information (categorical): {mi}")