TIME_WAIT 소켓
TIME_WAIT 상태의 소켓은 TCP 세션 통신 과정에서 연결을 종료할 때 발생한다.
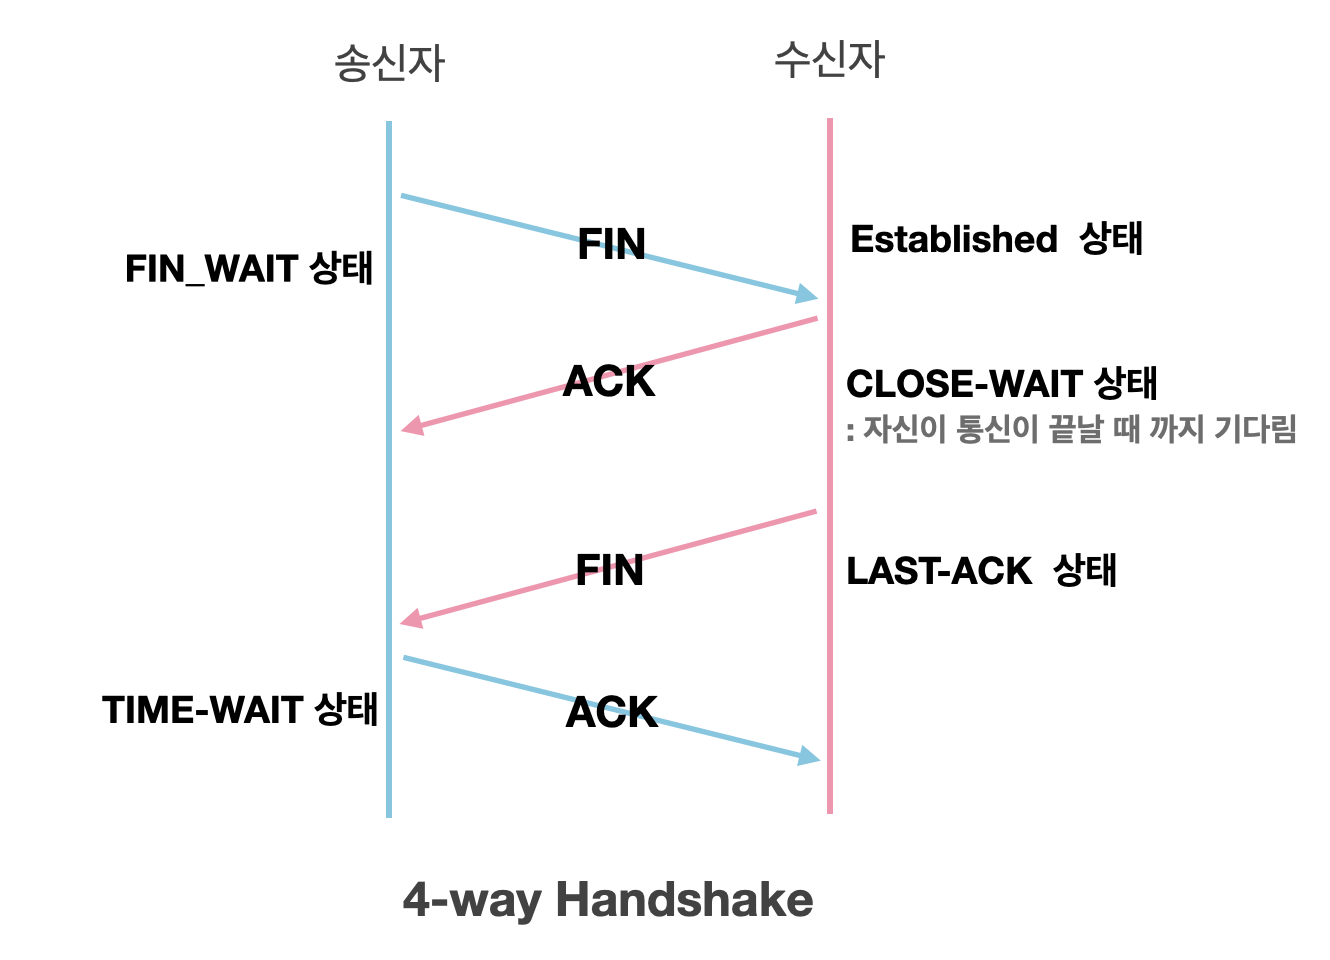
TCP에서 최초 통신 수립 시에 3-way-handshaking을 하게되는데, 이후 연결을 해제할 때에는 4-way-handshaking을 하게된다.

연결 해제 시에는 연결을 해제하는 쪽에서 먼저 FIN을 보내게되고, 수신자에서 ACK, FIN을 전송한 이후 송신자가 다시 ACK 전송 후 정상적으로 받게되면 연결 해제가 정상적으로 완료된다.
다만 위 과정에서 송신자는 수신자가 전송한 FIN 이후에 연결된 소켓을 TIME-WAIT 상태로 전환하고 설정된 시간 만큼 대기 후 사라진다.
필요성
TIME_WAIT 소켓은 TCP 연결이 종료된 이후에도 흔적을 남김으로써 이후에 발생할 수 있는 문제점을 방지한다. 대표적으로는 패킷 유실에 따른 비정상적인 통신 흐름의 발생이다.
위 상황에서 A가 보낸 ACK 패킷이 유실되었고, B에서 다시 FIN을 전송하여 유실된 작업을 이어 수행하였다. 다만 이때 만약 TIME_WAIT 상태가 매우 짧다면 B가 전송한 FIN에 대해 A는 비정상적인 요청으로 받아들이고 RST를 전송한다. 이후 B는 정상적인 ACK를 받지 못하였으므로 LAST_ACK 상태가 유지된다. 때문에 이러한 상황을 방지하고자 TIME_WAIT 소켓을 제공한다.
실습
간단한 nginx 웹서버를 활용한 http 리소스 요청 과정에서 발생하는 3-way-handshaking과 4-way-handshaking을 살펴본다.
ubuntu@ip-172-31-59-210:~$ sudo tcpdump -A -vvv -nn port 80 -w tcpdump.pcap 위 명령어 이후 클라이언트 측에서 telnet host 80를 수행한다.(curl로 수행 시 다르게 처리되므로 반드시 telnet으로 진행할 것)
ubuntu@ip-172-31-59-210:~$ sudo tcpdump -A -vvv -nn port 80 -w tcpdump.pcap
tcpdump: listening on ens5, link-type EN10MB (Ethernet), snapshot length 262144 bytes
^C10 packets captured
10 packets received by filter
0 packets dropped by kernel
ubuntu@ip-172-31-59-210:~$ exit
logout
Connection to 3.38.136.55 closed.
[anjin-u@MacBook-Pro-2 Desktop (⎈|N/A:N/A)]$ scp devops:/home/ubuntu/tcpdump.pcap .
tcpdump.pcap                                                                                         100% 1272     8.3KB/s   00:00
이후 해당 pcap 파일을 wireshark에서 열어보게되면

위와 같이 표시되는데 대략 아래의 과정을 거친다.(C -> Client, S -> Server)
- C -> S SYNC
- S -> C SYNC + ACK
- C -> S ACK
- S -> C HTTP
- S -> C FIN + ACK
- C -> S ACK
- C -> S FIN + ACK
- S -> C ACK
TIME_WAIT 소켓의 문제점
위에서 설명하지 않았지만, TCP 연결 종료는 누구나 가능하며, 먼저 종료하는 측을 active closer, 반대는 passive closer라고 한다. 위 상황에서는 Server가 Active Closer로써 활동하는데, 이때 active Closer에 TIME_WAIT 소켓이 생성된다.
위 상황에서는 S -> C FIN + ACK에서 Server 측에 TIME_WAIT 소켓이 생성된다.
이때 TIME_WAIT 소켓이 증가하게되면 가용할 수 있는 포트의 수를 고갈시켜 소켓의 개수를 제한할 수 있다. 다만, TIME_WAIT 상태의 소켓이 서버 소켓일 경우(80번 포트로 받는 경우) 소켓의 개수가 증가한다 하여도 사실상 성능에는 미미한 영향만 존재할 수 있다. TIME_WAIT socket의 개수는 net.ipv4.tcp_max_tw_buckets 파라미터를 통해 확인할 수 있는데, t3.small에서 실행 시 나오는 값은 다음과 같다.
ubuntu@ip-172-31-59-210:~$ sysctl net.ipv4.tcp_max_tw_buckets
net.ipv4.tcp_max_tw_buckets = 4096
이는 4096개의 TIME_WAIT 상태의 소켓이 생성될 수 있다는 뜻이며, 만약 이를 넘어갈 시 파괴되고 커널 로그로 남게된다.
때문에 서버 측에서 TIME_WAIT 상태의 소켓은 현실적으로 큰 영향을 끼치기 힘들다. 다만 대부분의 경우에서 서비스는 외부 API를 활용하여 서비스를 제공하게 되는데, 이때에는 문제가 발생할 수 있다.
물론 HTTP 기반 서비스는 대부분의 경우 서버측에서 먼저 연결을 종료하지만 만약 클라이언트 측에서 연결을 종료할 경우, 클라이언트 측에서 TIME_WAIT 소켓이 발생하게되고 이러한 소켓은 Source IP, Source Port, Destination IP, Destination Port 별로 발생하고, 만약 이러한 소켓이 다량으로 발생할 경우 TIME_WAIT 상태가 해제되어 포트를 사용할 수 있는 상태가 되지 않는 이상 서버와 통신할 수 없게 된다.
Client 측 TIME_WAIT 소켓 문제 테스트
커널 파라미터에서 net.ipv4.ip_local_port_range를 활용하면 외부와 통신할 때에 사용하는 포트의 범위를 지정할 수 있는데, 기본 값은 다음과 같다.
ubuntu@ip-172-31-59-210:~$ sudo sysctl net.ipv4.ip_local_port_range
net.ipv4.ip_local_port_range = 32768	60999
만약 위 값을 다음과 같이 지정한 뒤, curl을 통해 테스트를 진행하게되면 활용할 수 있는 범위의 모든 포트가 TIME_WAIT 소켓에 의해 할당되어있으므로 통신을 수행할 수 없는 결과를 볼 수 있다.
ubuntu@ip-172-31-59-210:~$ sudo sysctl -w net.ipv4.ip_local_port_range='32768 32768'
net.ipv4.ip_local_port_range = 32768 32768
ubuntu@ip-172-31-59-210:~$ curl https://info-dsm.info
ubuntu@ip-172-31-59-210:~$ sudo netstat -napo | grep -i time_wait
tcp        0      0 172.31.59.210:32768     104.21.37.79:443        TIME_WAIT   -                    timewait (58.53/0/0)
ubuntu@ip-172-31-59-210:~$ curl https://info-dsm.info
ubuntu@ip-172-31-59-210:~$ curl https://info-dsm.info
curl: (7) Couldn't connect to server
ubuntu@ip-172-31-59-210:~$ sudo netstat -napo | grep -i time_wait
tcp        0      0 172.31.59.210:32768     172.67.205.230:443      TIME_WAIT   -                    timewait (17.93/0/0)
tcp        0      0 172.31.59.210:32768     104.21.37.79:443        TIME_WAIT   -                    timewait (19.70/0/0)
위 도메인에서는 Cloudflare PoP로 요청이 들어가게되어 2개의 Destination IP까지는 성공적으로 수행되었으나 이후 각각의 Source, Destination 주소들이 중복되어 Couldn't connect to server라는 메시지를 던지게 된다.
TIME_WAIT reuse
위 상황을 해결할 수 있는 방법에는 net.ipv4.tcp_tw_reuse 파라미터를 1로 설정하여 활성화하는 방법이 있다.
말 그대로 해당 파라미터는 외부로 요청할 때 TIME_WAIT 소켓을 재사용할 수 있게 한다.
위 상황을 이어서 net.ipv4.tcp_tw_reuse를 1로 설정하면 활성화시킬 수 있다.(0 -> disable, 1 -> enable, 2 -> loopback only)
ubuntu@ip-172-31-59-210:~$ sudo curl https://info-dsm.info
ubuntu@ip-172-31-59-210:~$ sudo curl https://info-dsm.info
ubuntu@ip-172-31-59-210:~$ sudo curl https://info-dsm.info
curl: (7) Couldn't connect to server
ubuntu@ip-172-31-59-210:~$ sudo netstat -napo | grep -i time_wait
tcp        0      0 172.31.59.210:32768     172.67.205.230:443      TIME_WAIT   -                    timewait (55.61/0/0)
tcp        0      0 172.31.59.210:32768     104.21.37.79:443        TIME_WAIT   -                    timewait (56.75/0/0)
ubuntu@ip-172-31-59-210:~$ sysctl net.ipv4.tcp_tw_reuse
net.ipv4.tcp_tw_reuse = 2
ubuntu@ip-172-31-59-210:~$ sudo sysctl -w net.ipv4.tcp_tw_reuse=1
net.ipv4.tcp_tw_reuse = 1
ubuntu@ip-172-31-59-210:~$ sysctl net.ipv4.tcp_tw_reuse
net.ipv4.tcp_tw_reuse = 1
ubuntu@ip-172-31-59-210:~$ curl https://info-dsm.info
ubuntu@ip-172-31-59-210:~$ curl https://info-dsm.info
ubuntu@ip-172-31-59-210:~$ curl https://info-dsm.info
ubuntu@ip-172-31-59-210:~$ curl https://info-dsm.info
ubuntu@ip-172-31-59-210:~$ curl https://info-dsm.info
ubuntu@ip-172-31-59-210:~$ curl https://info-dsm.info
ubuntu@ip-172-31-59-210:~$ curl https://info-dsm.info
ubuntu@ip-172-31-59-210:~$ sudo netstat -napo | grep -i time_wait
tcp        0      0 172.31.59.210:32768     172.67.205.230:443      TIME_WAIT   -                    timewait (33.76/0/0)
tcp        0      0 172.31.59.210:32768     104.21.37.79:443        TIME_WAIT   -                    timewait (36.00/0/0)
위와 같이 netstat을 통해 확인한 내용은 동일하지만 time_wait 소켓을 재사용하여 성공적으로 요청이 수행되도록 하였다.
net.ipv4.tcp_tw_reuse workflow
참고로 진행 과정은 다음과 같다.

우선 net.ipv4.ip_local_port_range를 통해 할당 가능한 포트 범위를 조회하고, 해당 포트가 사용중인지 파악 후 사용중이라면 net.ipv4.tcp_tw_reuse를 확인, 만약 1이라면 반환하는 플로우를 가진다.
Connection Pool
위 time_wait 문제를 해결하기 위해선 reuse를 할 수도 있지만 connection pool을 활용하여 문제를 해결할 수도 있다.
근본적으로 해당 문제는 매 요청 마다 연결을 수립하며 발생하는 문제이므로 connection pool을 통해 연결을 지속적으로 유지 및 관리하여 매 요청 마다 발생하는 3-way-handshaking 등의 비효율적인 과정들을 극복할 수 있다.
Keep Alive
서버 측에서 TIME_WAIT 소켓을 줄일 수 있는 수단으로는 keepalive가 있다. 기본적으로 Http 요청 시 "Connection: Close"로 헤더를 반환하는데 keepalive를 설정하고 난 다음에는 "Connection: keep-alive"로 표시되고 서버에서 세션을 유지한다.
Non-keepalive

$ sudo service nginx reload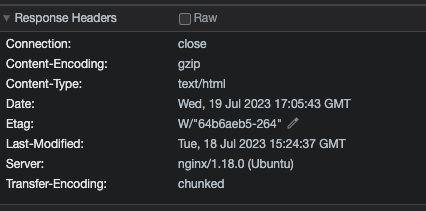

위처럼 Header의 Connection이 close로 표시된 것을 확인할 수 있다.
keepalive

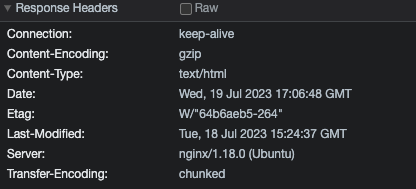
keepalive 설정 시 정상적으로 keep-alive로 반환되는 것을 확인할 수 있다.
nginx upstream TIME_WAIT
대부분의 경우에서 WAS는 Web server 뒤에 놓아져서 upstream으로 통신된다. 이때 nginx에서 WAS로 전달하는 영역에 keepalive를 설정하였을 때와 아닐때를 비교하면 다음과 같다.
nginx keepalive off
nginx
   upstream backend {
                server localhost:8080;
        }

        server {
                listen 80;
                listen [::]:80;

                location / {
                        proxy_pass http://backend;
                }
                keepalive_timeout       0;
        }
result
 This is ApacheBench, Version 2.3 <$Revision: 1879490 $>
Copyright 1996 Adam Twiss, Zeus Technology Ltd, http://www.zeustech.net/
Licensed to The Apache Software Foundation, http://www.apache.org/

Benchmarking 3.38.136.55 (be patient)
Completed 1000 requests
Completed 2000 requests
Completed 3000 requests
Completed 4000 requests
Completed 5000 requests
Completed 6000 requests
Completed 7000 requests
Completed 8000 requests
Completed 9000 requests
Completed 10000 requests
Finished 10000 requests


Server Software:        nginx/1.18.0
Server Hostname:        3.38.136.55
Server Port:            80

Document Path:          /hello
Document Length:        52 bytes

Concurrency Level:      1
Time taken for tests:   22.147 seconds
Complete requests:      10000
Failed requests:        10
   (Connect: 0, Receive: 0, Length: 10, Exceptions: 0)
Total transferred:      2159970 bytes
HTML transferred:       519970 bytes
Requests per second:    451.53 [#/sec] (mean)
Time per request:       2.215 [ms] (mean)
Time per request:       2.215 [ms] (mean, across all concurrent requests)
Transfer rate:          95.24 [Kbytes/sec] received

Connection Times (ms)
              min  mean[+/-sd] median   max
Connect:        1    1   0.4      1      20
Processing:     1    1   2.0      1     190
Waiting:        1    1   2.0      1     190
Total:          2    2   2.0      2     191

Percentage of the requests served within a certain time (ms)
  50%      2
  66%      2
  75%      2
  80%      2
  90%      2
  95%      3
  98%      4
  99%      5
 100%    191 (longest request)
nginx keepalive on
nginx
        upstream backend {
                server localhost:8080;
        }

        server {
                listen 80;
                listen [::]:80;

                location / {
                        proxy_pass http://backend;
                }
                keepalive_timeout       10;
        }
result
ubuntu@ip-10-0-0-232:~$ ab -n 10000 -c 1 http://3.38.136.55/hello
This is ApacheBench, Version 2.3 <$Revision: 1879490 $>
Copyright 1996 Adam Twiss, Zeus Technology Ltd, http://www.zeustech.net/
Licensed to The Apache Software Foundation, http://www.apache.org/

Benchmarking 3.38.136.55 (be patient)
Completed 1000 requests
Completed 2000 requests
Completed 3000 requests
Completed 4000 requests
Completed 5000 requests
Completed 6000 requests
Completed 7000 requests
Completed 8000 requests
Completed 9000 requests
Completed 10000 requests
Finished 10000 requests


Server Software:        nginx/1.18.0
Server Hostname:        3.38.136.55
Server Port:            80

Document Path:          /hello
Document Length:        52 bytes

Concurrency Level:      1
Time taken for tests:   20.665 seconds
Complete requests:      10000
Failed requests:        13
   (Connect: 0, Receive: 0, Length: 13, Exceptions: 0)
Total transferred:      2159961 bytes
HTML transferred:       519961 bytes
Requests per second:    483.92 [#/sec] (mean)
Time per request:       2.066 [ms] (mean)
Time per request:       2.066 [ms] (mean, across all concurrent requests)
Transfer rate:          102.07 [Kbytes/sec] received

Connection Times (ms)
              min  mean[+/-sd] median   max
Connect:        1    1   0.4      1      10
Processing:     1    1   0.5      1      11
Waiting:        1    1   0.5      1      11
Total:          2    2   0.7      2      18

Percentage of the requests served within a certain time (ms)
  50%      2
  66%      2
  75%      2
  80%      2
  90%      2
  95%      3
  98%      4
  99%      6
 100%     18 (longest request)
access directly
result
ubuntu@ip-10-0-0-232:~$ ab -n 10000 -c 1 http://3.38.136.55:8080/hello
This is ApacheBench, Version 2.3 <$Revision: 1879490 $>
Copyright 1996 Adam Twiss, Zeus Technology Ltd, http://www.zeustech.net/
Licensed to The Apache Software Foundation, http://www.apache.org/

Benchmarking 3.38.136.55 (be patient)
Completed 1000 requests
Completed 2000 requests
Completed 3000 requests
Completed 4000 requests
Completed 5000 requests
Completed 6000 requests
Completed 7000 requests
Completed 8000 requests
Completed 9000 requests
Completed 10000 requests
Finished 10000 requests


Server Software:
Server Hostname:        3.38.136.55
Server Port:            8080

Document Path:          /hello
Document Length:        52 bytes

Concurrency Level:      1
Time taken for tests:   18.966 seconds
Complete requests:      10000
Failed requests:        5
   (Connect: 0, Receive: 0, Length: 5, Exceptions: 0)
Total transferred:      1849985 bytes
HTML transferred:       519985 bytes
Requests per second:    527.26 [#/sec] (mean)
Time per request:       1.897 [ms] (mean)
Time per request:       1.897 [ms] (mean, across all concurrent requests)
Transfer rate:          95.26 [Kbytes/sec] received

Connection Times (ms)
              min  mean[+/-sd] median   max
Connect:        1    1   0.4      1       8
Processing:     1    1   0.5      1      11
Waiting:        1    1   0.4      1      11
Total:          2    2   0.6      2      12

Percentage of the requests served within a certain time (ms)
  50%      2
  66%      2
  75%      2
  80%      2
  90%      2
  95%      2
  98%      4
  99%      5
 100%     12 (longest request)
위 결과들을 토대로 성능은 다음과 같았다.
keepalive 0s - 2.215
keepalive 10s - 2.066
직접 접근(nginx 경유 x) - 1.897
위 결과를 통해 직접 접근하는 것이 가장 빠르고, keepalive 설정 버전이 두 번째로 빠름을 알 수 있다.