프론트엔드
1.스크롤시에 글자들 페이드인아웃 설정
2.네비바 상단고정시키기
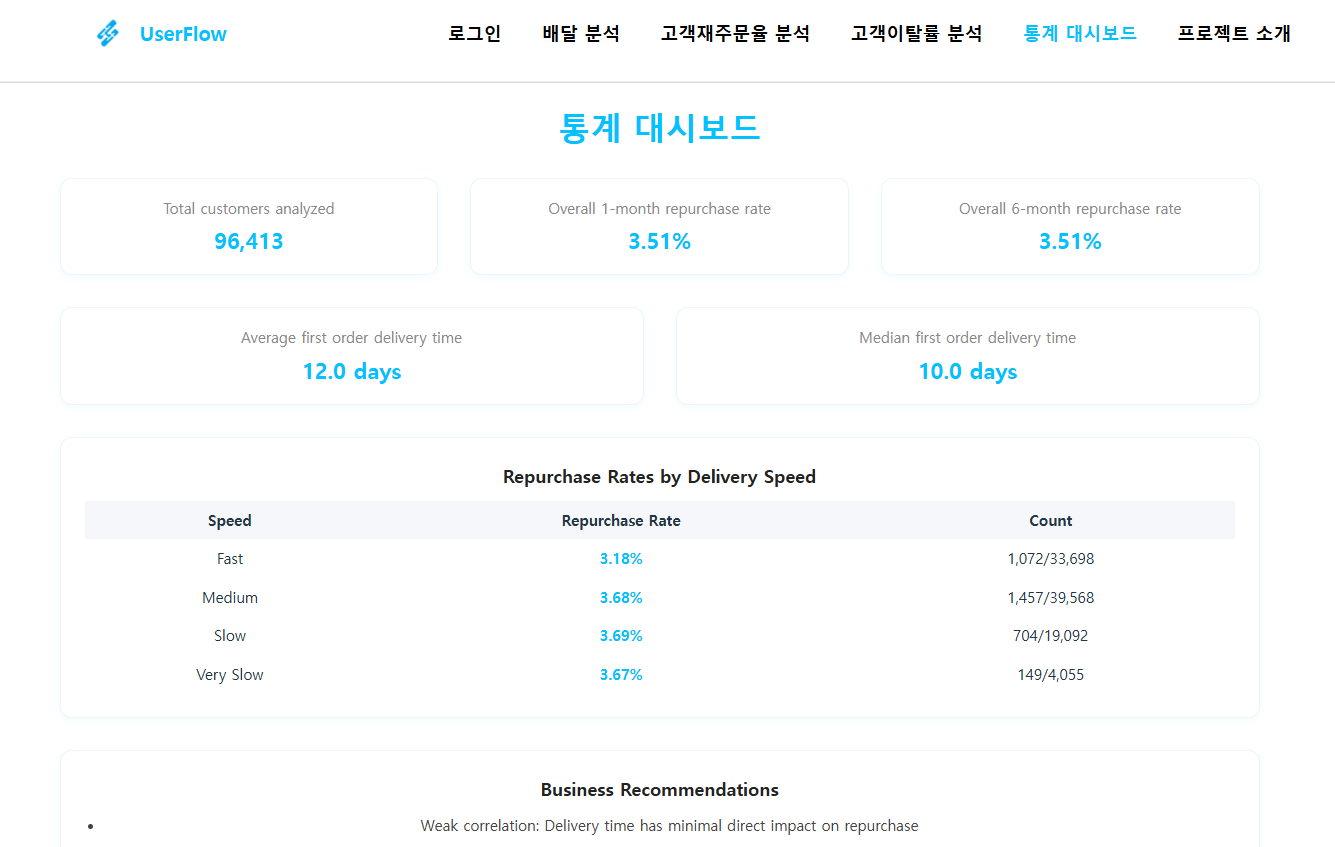
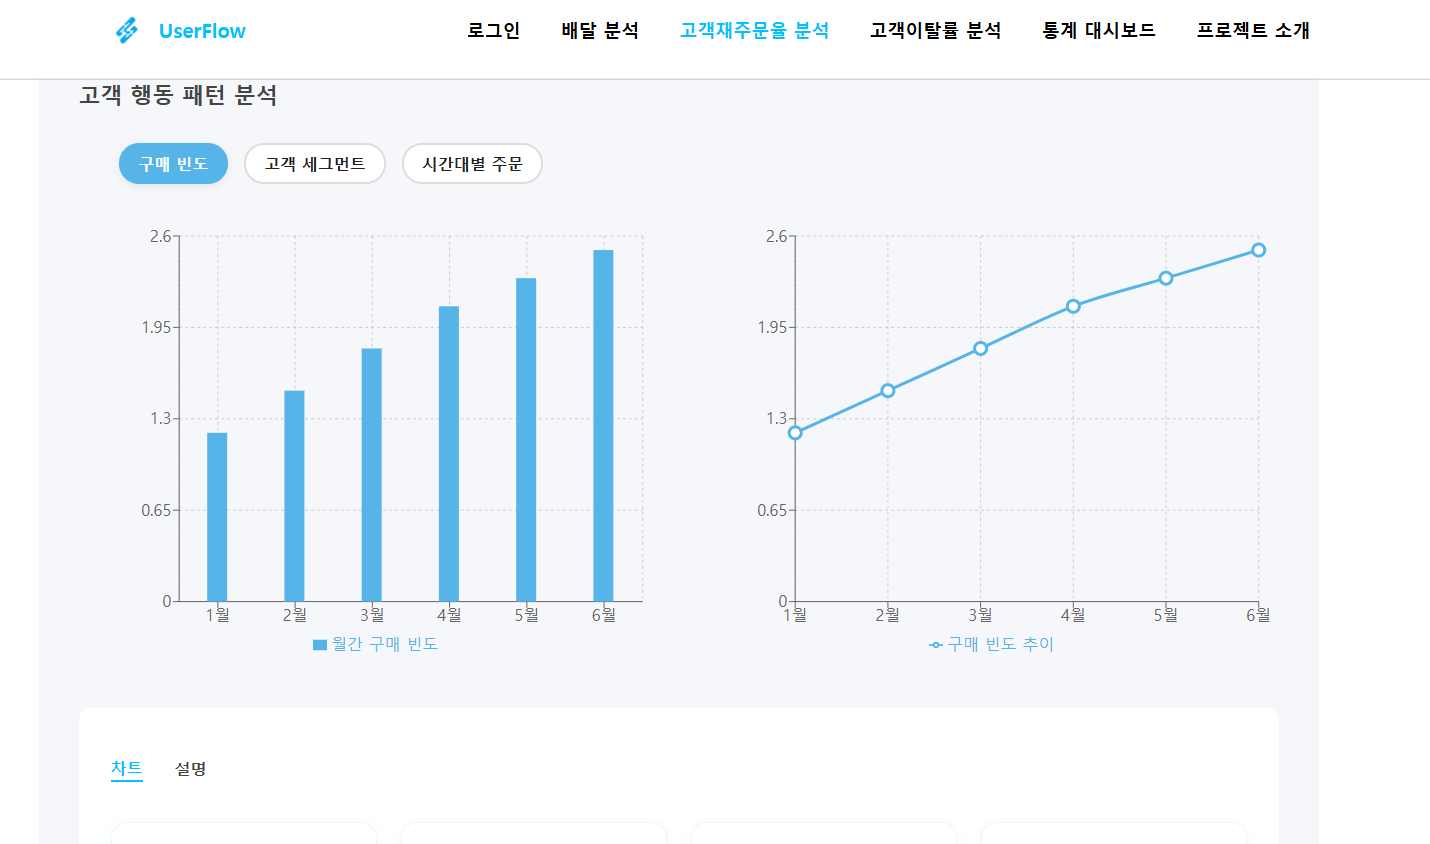
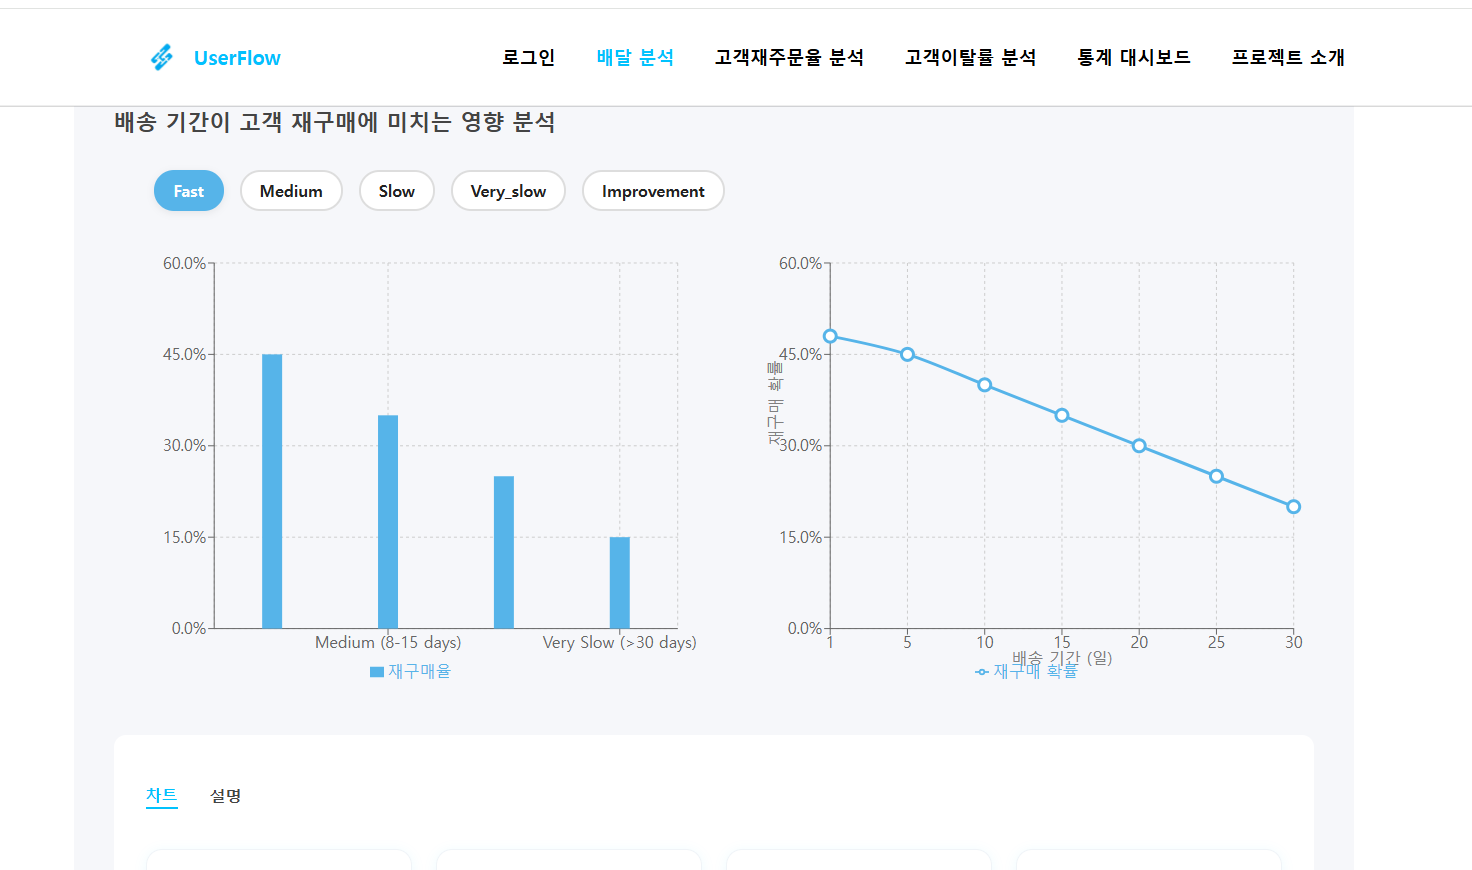
3.머신러닝 분석 결과 더미데이터로 만들어서 api없이 붙여놓기(나중엔 sql연동)
머신러닝은 claude , chatGPT , perplexity , deepsheek 사용
프론트는 cursor ai 사용
처음부터 코드를 짜는 것보단 프롬프트엔지니어링이 맞는 방향성 아닐까?하는 생각이 듦.
단순히 복붙이면 문제겠지만 제안한 코드를 보고 취사선택을 하고, 여러 ai의 답변중에서 제일 효율적인 코드를 고를 수 있는 안목을 키우는게 더 중요한 시기인듯
머신러닝 시 주의할 점
1.data leakage
-
Train-Test Contamination
정규화 스케일러쓸땐
데이터 스케일러 쓰기 전에 나누기부터하기. 정규화를 먼저 시킨다면 내가 가령 100개를 20개 80개로 나눈다면, 20개의 값이 이미 영향을 미친상황임. 20개의 테스트데이터는 모델에게 완전히 새로운 데이터여야하는데 이미 테스트데이터의 정보를 조금은 알게된 상황이니 , 모델 예측도가 높게나오는데 이건 완전히 새로운 데이터한테는 예측률이 떨어질 수 밖에 없음. -
Time-Based Leakage (Using Future to Predict Past)
시간 데이터는 결측치 채울때 , 평균처럼 내일데이터까지 포함한 값 말고 과거데이터만쓰기 . 6월10일 주가예측을 원하면 6월9일주가까지만 사용해야하지 6월11일까지 포함한 평균주가를 결측치 채우는데 쓰면 안됨 -
Target Leakage (Cheating with "Future" Info)
특성의 순서 생각하기
병에 걸렸기에 약을 먹은거지 , 약을 먹었기에 병에 걸린데 아니다.
타겟(정답)이 일어나기 전에 이 특성이 존재하는가? 물어보고 아니면 지우기.
여기서 예측하고 싶은 정답은 병에 걸린거고 특성은 약을 먹은거임. 근데 병에 걸렸기때문에 약을 먹은거니 , 약을 먹는다는 행위는 결과를 예측하는데 도움이 안되는 특성임. -
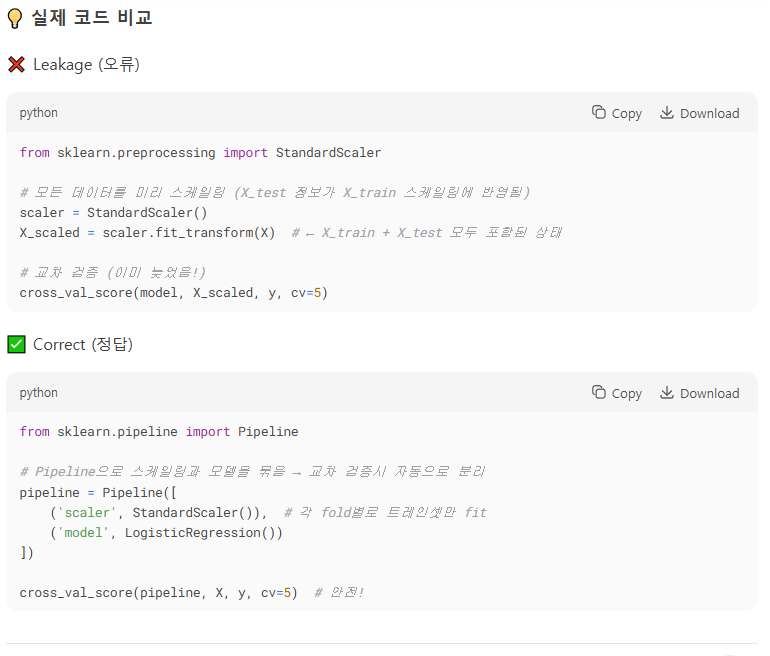
Cross-Validation Leakage (Sneaky Overfitting)
교차검증할때, 1번처럼 미리 그룹을 나누고나서 스케일러를 적용해야함. 퀴즈가 5개고 그룹을 5개로 나눈다할때 이미 5개의 퀴즈를 트레인4개 테스트1개 이렇게 안나누고 5개로 정규화시키면 테스트하려는 1개의 데이터 정보가 이미 영향을 줘버린거임.
그러니 교차검증할때도 항상 데이터를 트레인,테스트로 나누고 그 다음에 스케일링하는걸 주의하기.
from sklearn.pipeline import Pipeline
from sklearn.preprocessing import StandardScaler
from sklearn.linear_model import LogisticRegression

# Safe: Scaling happens SEPARATELY for each fold
pipeline = Pipeline([
    ("scaler", StandardScaler()),  # Step 1: Scale
    ("model", LogisticRegression())  # Step 2: Train
])

# cross_val_score handles the splitting automatically
from sklearn.model_selection import cross_val_score
scores = cross_val_score(pipeline, X, y, cv=5)
5번의 교차 검증 중 1번째 시행:
트레인셋 (4문제): Q2, Q3, Q4, Q5 → 이들만으로 스케일러 학습 (fit).
테스트셋 (1문제): Q1 → 트레인셋의 스케일러로 변환만 (transform).
2번째 시행:
트레인셋: Q1, Q3, Q4, Q5 → 새로 스케일링 학습.
테스트셋: Q2 → 변환만. 테스트셋은 스케일링에 사용안됨.
(반복...)
- Duplicate Data (Double-Dipping!)
트레인에 있는 데이터가 테스트에 있으면 안됨
- 데이터를 무조건. 카피한걸 쓰기. 원본데이터 손상시키지 말기 .
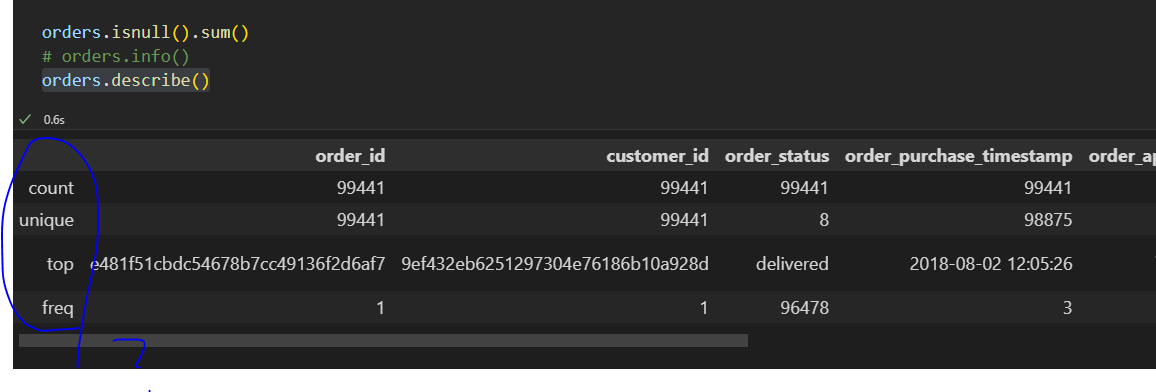
orders.describe()
The code orders.describe() is a method call on a DataFrame object named orders, most likely from the pandas library. This method generates descriptive statistics that summarize the central tendency, dispersion, and shape of a dataset’s distribution, excluding NaN values.
By default, describe() returns statistics such as count, mean, standard deviation, minimum, 25th percentile (Q1), median (50th percentile), 75th percentile (Q3), and maximum for each numeric column in the DataFrame. If the DataFrame contains object (string) columns, it will instead provide statistics like count, unique values, the most frequent value (top), and its frequency.
This summary is useful for quickly understanding the basic properties of your dataset, identifying potential anomalies, and informing further data cleaning or analysis steps. You can customize the output by passing parameters such as percentiles (to specify which percentiles to include), include (to specify which data types to include), or exclude (to omit certain data types). However, with no arguments, orders.describe() provides a standard overview of all numeric columns.
count: Total number of non-null (non-missing) entries for each column. For example, order_id has 99,441 entries.
unique: Number of unique values in each column. For order_id and customer_id, there are 99,441 unique values, meaning every order and customer is unique in this dataset.
top: The most frequently occurring value (mode) in each column. For example, in order_status, the most common status is "delivered".
freq: The number of times the top value appears. For order_status, "delivered" appears 96,478 times.
- Why is "unique" the same as "count" for customer_id and order_id?
order_id:
Each order_id is unique, which makes sense because each order should have its own identifier. So, count (number of non-null rows) and unique (number of unique values) are both 99,441.
customer_id:
Here, the count and unique are also both 99,441. This means every customer_id appears only once in the dataset.
This is unusual for an e-commerce dataset—normally, if customers can make multiple purchases, you'd expect some customer_ids to appear more than once.
In your data, each customer_id is only linked to one order. That means there are no repeat purchases in this table, or the data has been pre-processed to only include one order per customer.
-
What does "top" mean when all values are unique?
order_id and customer_id:
The "top" row shows the most frequent value (the mode). If all values are unique, any value could be shown as "top"—it’s just the first mode found.
The "freq" row shows how many times this top value appears. For order_id and customer_id, it's 1, confirming that all values are unique. -
Why is "order_status" different?
order_status:
There are only 8 unique statuses (like "delivered," "shipped," etc.), and "delivered" is the most common one, appearing 96,478 times. -
What does this mean for your analysis?
If you expect customers to have made multiple purchases, this table does not reflect that. Either:
The dataset only contains one order per customer (possibly the latest or first order).
Or, there is an issue with how the data has been processed or filtered.
For "top" in columns where every value is unique (like order_id), it doesn't provide meaningful insight—it's just an arbitrary value that happens to be the first mode.