
다양한 표를 만들 수 있는 라이브러리
설치
npm install --save react-apexcharts apexcharts
사용하기
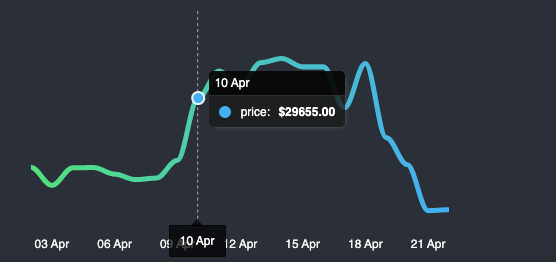
<ApexCharts/>는 필수로 어떤 타입의 표를 선택할지를 넣어야한다 Ex)type="line"
이 외에도 series,options를 통해 입맛대로 표를 만들 수 있다
import ApexCharts from 'react-apexcharts';

function Chart() {
return(
<>
  <ApexCharts
    type="line"
    series={[
         {
              name: 'price',
              data: data?.map((price) => parseFloat(price.close)) as number[],
            },
    ]}
    options={{
    theme: {
              mode: 'dark',
            },
            chart: {
              height: 500,
              width: 500,
              toolbar: {
                show: false,
              },
              background: 'transparent',
            },
            grid: {
              show: false,
            },
            stroke: {
              curve: 'smooth',
              width: 5,
            },
            yaxis: {
              show: false,
            },
            xaxis: {
              axisTicks: { show: false },
              categories: data?.map((price) =>
                new Date(price.time_close * 1000).toISOString()
              ),
              type: 'datetime',
            },
    }}
    />
  </>
)
}

아 그거 뭐였지?