Chatbot 설정에 이어 RDS, ElastiCache, MQ등의 CloudWatch Alarm 설정과 EventBridge를 통한 RDS, ElastiCache, Health Event Alarm 설정 방법에 대해 다뤄보고자 한다.
마찬가지로 랜딩존 구성에 활용할 수 있고, 쉽고 빠른 Alert 환경을 구성하기에 적합하다.
Terraform으로 쉽게 생성하고 관리할 수 있는 구조로 만든다.
Step 1. Terraform code
- 리소스를 주입할 ./test/main.tf를 구성하고 ./main.tf를 구성
# ./test/main.tf
module "cloudwatch" {
  source = "../"

  db_instance_id                  = "test"
  redis_instance_id               = "test"
  redis_clusters                  = "2"
  mq_instance_id                  = "test"
  aws_sns_topic_arn               = "arn:aws:sns:ap-northeast-2:{AWS_YOUR_ACCOUNT}:test"
  database_connections_threshold  = 70
  rabbit_mq_memory_used_threshold = 32000000
}
# ./main.tf
terraform {
required_version = ">= 1.3"
required_providers {
aws = {
source = "hashicorp/aws"
version = ">= 5.34"
}
}
}
provider "aws" {
region = local.region
}
locals {
region = "ap-northeast-2"
thresholds = {
DatabaseConnectionsThreshold = max(var.database_connections_threshold, 0)
CPUUtilizationThreshold = min(max(var.cpu_utilization_threshold, 0), 100)
EngineCPUUtilizationThreshold = min(max(var.engine_cpu_utilization_threshold, 0), 100)
CPUCreditBalanceThreshold = max(var.cpu_credit_balance_threshold, 0)
DiskQueueDepthThreshold = max(var.disk_queue_depth_threshold, 0)
FreeableMemoryThreshold = max(var.freeable_memory_threshold, 0)
FreeStorageSpaceThreshold = max(var.free_storage_space_threshold, 0)
SwapUsageThreshold = max(var.swap_usage_threshold, 0)
InnoDBHistoryListLength = max(var.innodb_history_list_length, 0)
CurrConnectionsThreshold = max(var.curr_connections_threshold, 0)
ConnectionCountThreshold = max(var.connection_count_threshold, 0)
RabbitMQFreeDiskThreshold = max(var.rabbit_mq_disk_free_threshold, 0)
RabbitMQMemUsedThreshold = max(var.rabbit_mq_memory_used_threshold, 0)
}
}
# AWS/RDS
resource "aws_cloudwatch_metric_alarm" "rds_database_connections_too_high" {
alarm_name = join("-", ["RDS", var.db_instance_id, "DatabaseConnectionsThreshold"])
comparison_operator = "GreaterThanThreshold"
evaluation_periods = "1"
metric_name = "DatabaseConnections"
namespace = "AWS/RDS"
period = "300"
statistic = "Average"
threshold = local.thresholds["DatabaseConnectionsThreshold"]
alarm_description = "Database connections over last 5 minutes too high"
alarm_actions = [var.aws_sns_topic_arn]
ok_actions = [var.aws_sns_topic_arn]
dimensions = {
DBInstanceIdentifier = var.db_instance_id
}
}
resource "aws_cloudwatch_metric_alarm" "rds_cpu_utilization_too_high" {
alarm_name = join("-", ["RDS", var.db_instance_id, "CPUUtilizationThreshold"])
comparison_operator = "GreaterThanThreshold"
evaluation_periods = "1"
metric_name = "CPUUtilization"
namespace = "AWS/RDS"
period = "600"
statistic = "Average"
threshold = local.thresholds["CPUUtilizationThreshold"]
alarm_description = "Average database CPU utilization over last 10 minutes too high"
alarm_actions = [var.aws_sns_topic_arn]
ok_actions = [var.aws_sns_topic_arn]
dimensions = {
DBInstanceIdentifier = var.db_instance_id
}
}
resource "aws_cloudwatch_metric_alarm" "rds_cpu_credit_balance_too_low" {
alarm_name = join("-", ["RDS", var.db_instance_id, "CPUCreditBalanceThreshold"])
comparison_operator = "LessThanThreshold"
evaluation_periods = "1"
metric_name = "CPUCreditBalance"
namespace = "AWS/RDS"
period = "600"
statistic = "Average"
threshold = local.thresholds["CPUCreditBalanceThreshold"]
alarm_description = "Average database CPU credit balance over last 10 minutes too low, expect a significant performance drop soon"
alarm_actions = [var.aws_sns_topic_arn]
ok_actions = [var.aws_sns_topic_arn]
dimensions = {
DBInstanceIdentifier = var.db_instance_id
}
}
resource "aws_cloudwatch_metric_alarm" "rds_disk_queue_depth_too_high" {
alarm_name = join("-", ["RDS", var.db_instance_id, "DiskQueueDepthThreshold"])
comparison_operator = "GreaterThanThreshold"
evaluation_periods = "1"
metric_name = "DiskQueueDepth"
namespace = "AWS/RDS"
period = "600"
statistic = "Average"
threshold = local.thresholds["DiskQueueDepthThreshold"]
alarm_description = "Average database disk queue depth over last 10 minutes too high, performance may suffer"
alarm_actions = [var.aws_sns_topic_arn]
ok_actions = [var.aws_sns_topic_arn]
dimensions = {
DBInstanceIdentifier = var.db_instance_id
}
}
resource "aws_cloudwatch_metric_alarm" "rds_freeable_memory_too_low" {
alarm_name = join("-", ["RDS", var.db_instance_id, "FreeableMemoryThreshold"])
comparison_operator = "LessThanThreshold"
evaluation_periods = "1"
metric_name = "FreeableMemory"
namespace = "AWS/RDS"
period = "600"
statistic = "Average"
threshold = local.thresholds["FreeableMemoryThreshold"]
alarm_description = "Average database freeable memory over last 10 minutes too low, performance may suffer"
alarm_actions = [var.aws_sns_topic_arn]
ok_actions = [var.aws_sns_topic_arn]
dimensions = {
DBInstanceIdentifier = var.db_instance_id
}
}
resource "aws_cloudwatch_metric_alarm" "rds_free_storage_space_too_low" {
alarm_name = join("-", ["RDS", var.db_instance_id, "FreeStorageSpaceThreshold"])
comparison_operator = "LessThanThreshold"
evaluation_periods = "1"
metric_name = "FreeLocalStorage"
namespace = "AWS/RDS"
period = "600"
statistic = "Average"
threshold = local.thresholds["FreeStorageSpaceThreshold"]
alarm_description = "Average database free storage space over last 10 minutes too low"
alarm_actions = [var.aws_sns_topic_arn]
ok_actions = [var.aws_sns_topic_arn]
dimensions = {
DBInstanceIdentifier = var.db_instance_id
}
}
resource "aws_cloudwatch_metric_alarm" "rds_swap_usage_too_high" {
alarm_name = join("-", ["RDS", var.db_instance_id, "SwapUsageThreshold"])
comparison_operator = "GreaterThanThreshold"
evaluation_periods = "1"
metric_name = "SwapUsage"
namespace = "AWS/RDS"
period = "600"
statistic = "Average"
threshold = local.thresholds["SwapUsageThreshold"]
alarm_description = "Average database swap usage over last 10 minutes too high, performance may suffer"
alarm_actions = [var.aws_sns_topic_arn]
ok_actions = [var.aws_sns_topic_arn]
dimensions = {
DBInstanceIdentifier = var.db_instance_id
}
}
resource "aws_cloudwatch_metric_alarm" "rds_innodb_history_list_length" {
alarm_name = join("-", ["RDS", var.db_instance_id, "InnoDBHistoryListLength"])
comparison_operator = "GreaterThanThreshold"
evaluation_periods = "1"
metric_name = "RollbackSegmentHistoryListLength"
namespace = "AWS/RDS"
period = "300"
statistic = "Average"
threshold = local.thresholds["InnoDBHistoryListLength"]
alarm_description = "Average database innodb history list length over last 5 minutes too high, performance may suffer"
alarm_actions = [var.aws_sns_topic_arn]
ok_actions = [var.aws_sns_topic_arn]
dimensions = {
DBInstanceIdentifier = var.db_instance_id
}
}
# AWS/ElastiCache
resource "aws_cloudwatch_metric_alarm" "elasticache_cpu_utilization_too_high" {
count = "${var.redis_clusters}"
alarm_name = join("-", ["ElastiCache", var.redis_instance_id, "00${count.index + 1}", "CPUUtilizationThreshold"])
comparison_operator = "GreaterThanThreshold"
evaluation_periods = "1"
metric_name = "CPUUtilization"
namespace = "AWS/ElastiCache"
period = "600"
statistic = "Average"
threshold = local.thresholds["CPUUtilizationThreshold"]
alarm_description = "Average redis CPU utilization over last 10 minutes too high"
alarm_actions = [var.aws_sns_topic_arn]
ok_actions = [var.aws_sns_topic_arn]
dimensions = {
CacheClusterId = "${var.redis_instance_id}-00${count.index + 1}"
}
}
resource "aws_cloudwatch_metric_alarm" "elasticache_engine_cpu_utilization_too_high" {
count = "${var.redis_clusters}"
alarm_name = join("-", ["ElastiCache", var.redis_instance_id, "00${count.index + 1}", "EngineCPUUtilizationThreshold"])
comparison_operator = "GreaterThanThreshold"
evaluation_periods = "1"
metric_name = "EngineCPUUtilization"
namespace = "AWS/ElastiCache"
period = "600"
statistic = "Average"
threshold = local.thresholds["EngineCPUUtilizationThreshold"]
alarm_description = "Average redis Engine CPU utilization over last 10 minutes too high"
alarm_actions = [var.aws_sns_topic_arn]
ok_actions = [var.aws_sns_topic_arn]
dimensions = {
CacheClusterId = "${var.redis_instance_id}-00${count.index + 1}"
}
}
resource "aws_cloudwatch_metric_alarm" "elasticache_freeable_memory_too_low" {
count = "${var.redis_clusters}"
alarm_name = join("-", ["ElastiCache", var.redis_instance_id, "00${count.index + 1}", "FreeableMemoryThreshold"])
comparison_operator = "LessThanThreshold"
evaluation_periods = "1"
metric_name = "FreeableMemory"
namespace = "AWS/ElastiCache"
period = "600"
statistic = "Average"
threshold = local.thresholds["FreeableMemoryThreshold"]
alarm_description = "Average redis Memory utilization over last 10 minutes too low"
alarm_actions = [var.aws_sns_topic_arn]
ok_actions = [var.aws_sns_topic_arn]
dimensions = {
CacheClusterId = "${var.redis_instance_id}-00${count.index + 1}"
}
}
resource "aws_cloudwatch_metric_alarm" "elasticache_curr_connections_too_high" {
count = "${var.redis_clusters}"
alarm_name = join("-", ["ElastiCache", var.redis_instance_id, "00${count.index + 1}", "CurrConnectionsThreshold"])
comparison_operator = "GreaterThanThreshold"
evaluation_periods = "1"
metric_name = "CurrConnections"
namespace = "AWS/ElastiCache"
period = "300"
statistic = "Average"
threshold = local.thresholds["CurrConnectionsThreshold"]
alarm_description = "Redis connections over last 5 minutes too high"
alarm_actions = [var.aws_sns_topic_arn]
ok_actions = [var.aws_sns_topic_arn]
dimensions = {
CacheClusterId = "${var.redis_instance_id}-00${count.index + 1}"
}
}
# AWS/AmazonMQ
resource "aws_cloudwatch_metric_alarm" "mq_cpu_utilization_too_high" {
alarm_name = join("-", ["AmazonMQ", var.mq_instance_id, "CPUUtilizationThreshold"])
comparison_operator = "GreaterThanThreshold"
evaluation_periods = "1"
metric_name = "SystemCpuUtilization"
namespace = "AWS/AmazonMQ"
period = "600"
statistic = "Average"
threshold = local.thresholds["CPUUtilizationThreshold"]
alarm_description = "Average MQ CPU utilization over last 10 minutes too high"
alarm_actions = [var.aws_sns_topic_arn]
ok_actions = [var.aws_sns_topic_arn]
dimensions = {
Broker = var.mq_instance_id
}
}
resource "aws_cloudwatch_metric_alarm" "mq_connections_too_high" {
alarm_name = join("-", ["AmazonMQ", var.mq_instance_id, "ConnectionCountThreshold"])
comparison_operator = "GreaterThanThreshold"
evaluation_periods = "1"
metric_name = "ConnectionCount"
namespace = "AWS/AmazonMQ"
period = "300"
statistic = "Average"
threshold = local.thresholds["ConnectionCountThreshold"]
alarm_description = "MQ connections over last 5 minutes too high"
alarm_actions = [var.aws_sns_topic_arn]
ok_actions = [var.aws_sns_topic_arn]
dimensions = {
Broker = var.mq_instance_id
}
}
resource "aws_cloudwatch_metric_alarm" "mq_disk_free_too_low" {
alarm_name = join("-", ["AmazonMQ", var.mq_instance_id, "RabbitMQFreeDiskThreshold"])
comparison_operator = "LessThanThreshold"
evaluation_periods = "1"
metric_name = "RabbitMQDiskFree"
namespace = "AWS/AmazonMQ"
period = "600"
statistic = "Average"
threshold = local.thresholds["RabbitMQFreeDiskThreshold"]
alarm_description = "Average MQ free disk over last 10 minutes too low"
alarm_actions = [var.aws_sns_topic_arn]
ok_actions = [var.aws_sns_topic_arn]
dimensions = {
Broker = var.mq_instance_id
}
}
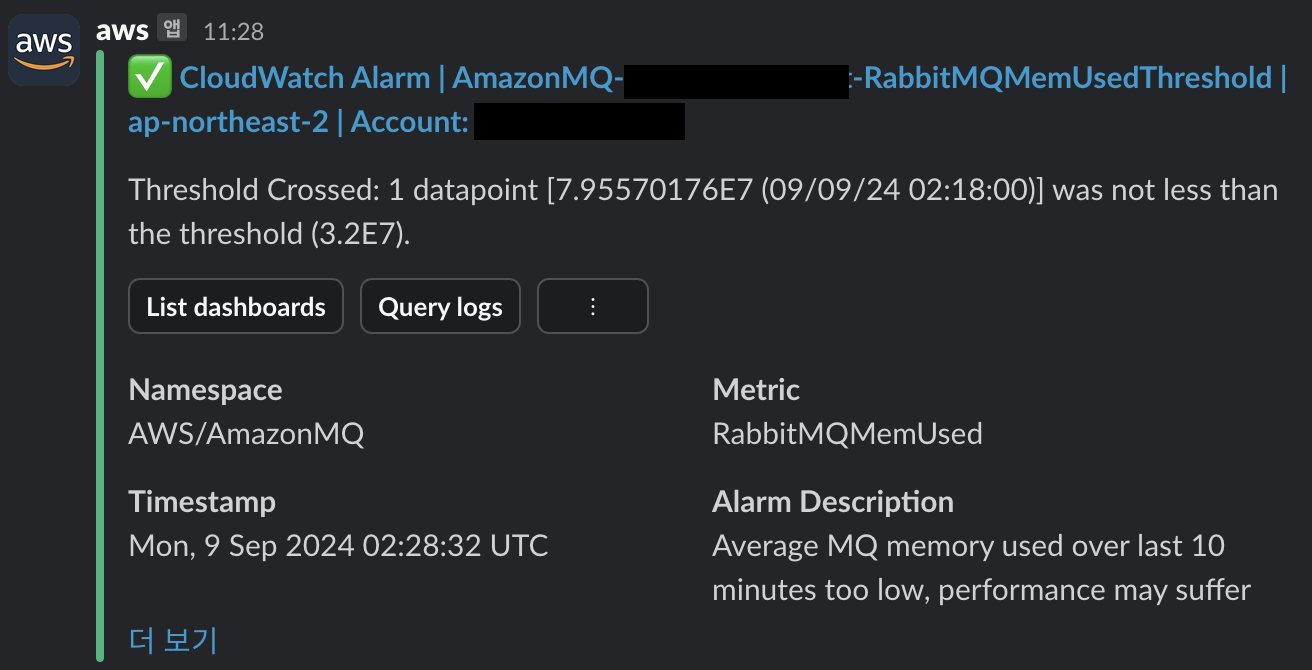
resource "aws_cloudwatch_metric_alarm" "mq_memory_used_too_low" {
alarm_name = join("-", ["AmazonMQ", var.mq_instance_id, "RabbitMQMemUsedThreshold"])
comparison_operator = "LessThanThreshold"
evaluation_periods = "1"
metric_name = "RabbitMQMemUsed"
namespace = "AWS/AmazonMQ"
period = "600"
statistic = "Average"
threshold = local.thresholds["RabbitMQMemUsedThreshold"]
alarm_description = "Average MQ memory used over last 10 minutes too low, performance may suffer"
alarm_actions = [var.aws_sns_topic_arn]
ok_actions = [var.aws_sns_topic_arn]
dimensions = {
Broker = var.mq_instance_id
}
}
---
# variables.tf
variable "db_instance_id" {
description = "The instance ID of the RDS database instance that you want to monitor."
type = string
}
variable "redis_instance_id" {
description = "The instance ID of the ElastiCache instance that you want to monitor."
type = string
}
variable "redis_clusters" {
description = "Number of Redis cache clusters (nodes) to create"
type = string
}
variable "mq_instance_id" {
description = "The instance ID of the AmazonMQ instance that you want to monitor."
type = string
}
variable "aws_sns_topic_arn" {
description = "SNS topic ARN."
type = string
}
variable "database_connections_threshold" {
description = "The maximum amount of database connections used on the DB instance in Count."
type = number
default = 700
}
variable "cpu_utilization_threshold" {
description = "The maximum percentage of CPU utilization."
type = number
default = 80
}
variable "engine_cpu_utilization_threshold" {
description = "The maximum percentage of Engine CPU utilization."
type = number
default = 80
}
variable "cpu_credit_balance_threshold" {
description = "The minimum number of CPU credits (t2 instances only) available."
type = number
default = 20
}
variable "disk_queue_depth_threshold" {
description = "The maximum number of outstanding IOs (read/write requests) waiting to access the disk."
type = number
default = 64
}
variable "freeable_memory_threshold" {
description = "The minimum amount of available random access memory in Byte."
type = number
default = 64000000
# 64 Megabyte in Byte
}
variable "free_storage_space_threshold" {
description = "The minimum amount of available storage space in Byte."
type = number
default = 2000000000
# 2 Gigabyte in Byte
}
variable "swap_usage_threshold" {
description = "The maximum amount of swap space used on the DB instance in Byte."
type = number
default = 256000000
# 256 Megabyte in Byte
}
variable "innodb_history_list_length" {
description = "The maximum amount of innodb history list length used on the DB instance in Length."
type = number
default = 1000000
}
variable "curr_connections_threshold" {
description = "The maximum amount of redis connections used on the Redis instance in Count."
type = number
default = 10000
}
variable "connection_count_threshold" {
description = "The maximum amount of mq connections used on the AmazonMQ instance in Count."
type = number
default = 1500
}
variable "rabbit_mq_memory_used_threshold" {
description = "The minimum amount of available MQ memory used in Byte."
type = number
default = 64000000
# 64 Megabyte in Byte
}
variable "rabbit_mq_disk_free_threshold" {
description = "The minimum amount of available disk free in Byte."
type = number
default = 5000000000
# 5 Gigabyte in Byte
}Step 2. Applied terraform code
terraform init
AWS_PROFILE=${YOUR_PROFILE} terraform plan
AWS_PROFILE=${YOUR_PROFILE} terraform apply -auto-approve
Step 3. Check alert registered in slack
상세 내용은 GitHub Repo에서 확인 가능

DevOps Engineer @Soomgo | Grafana Champion