1계층(물리)에서 신호 통신
1비트가 어떻게 만들어지는가?
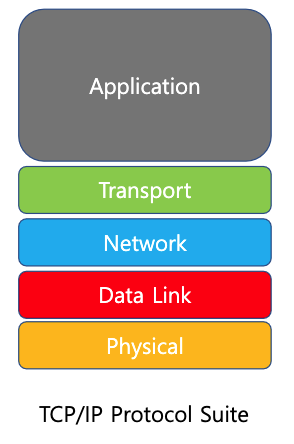
TCP/IP Protoco Suite에서 물리계층은 1계층

물리계층 확인
질문
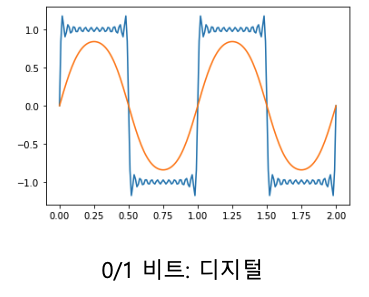
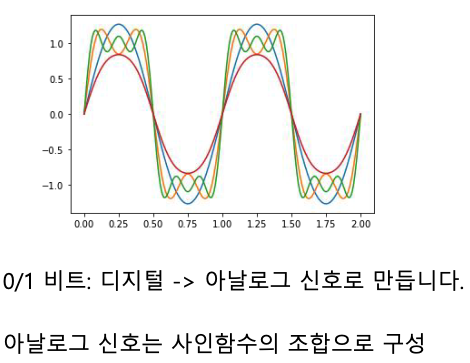
디지털 <--> 아날로그
1 비트는 어떻게 만드나?
→ 사인함수
0과 1 메시지 → 1 비트는 어떻게 만들까 ? : 물리계층
이더넷 프레임? 링크계층
물리계층에서 신호는 어떻게 생겼을까
크기가 다른 사인함수
import numpy as np
import matplotlib.pyplot as plt

fs = 100
t = np.arange(0,2,1/fs)
f1 = 1
f2 = 1

signal1= np.sin(2*np.pi * f1 * t)
signal2= 2*np.sin(2*np.pi * f2 * t)

plt.subplot(2,1,1)
plt.plot(t,signal1)
plt.grid()

plt.subplot(2,1,2)
plt.plot(t,signal2)
plt.grid()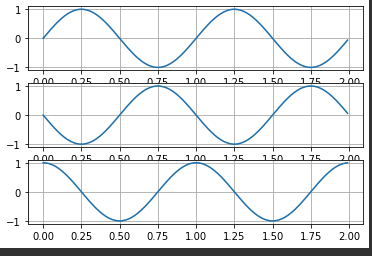
signal1, signal2는 사인함수 앞 곱셈 차이 (크기차이임)
오른쪽 그래프에서 -1 ~ 1 과 -2 ~ 2 가 크기의 차이다.
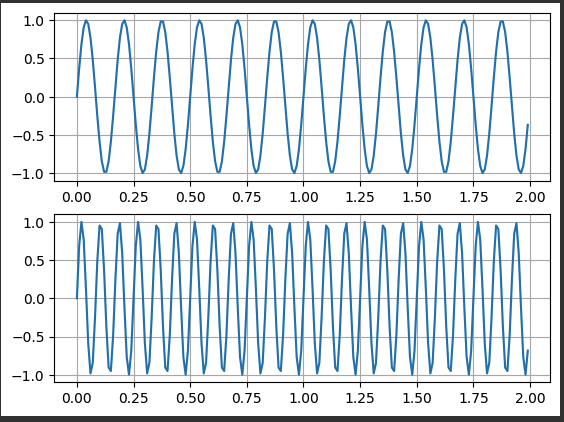
주파수가 다른 그래프
import numpy as np
import matplotlib.pyplot as plt

fs = 100
t = np.arange(0,2,1/fs) # 0에서 2 사이에 0.01 단위 값 생성
f1 = 6
f2 = 12

signal1= np.sin(2*np.pi * f1 * t)
signal2= np.sin(2*np.pi * f2 * t)

plt.subplot(2,1,1)
plt.plot(t,signal1)
plt.grid()

plt.subplot(2,1,2)
plt.plot(t,signal2)
plt.grid()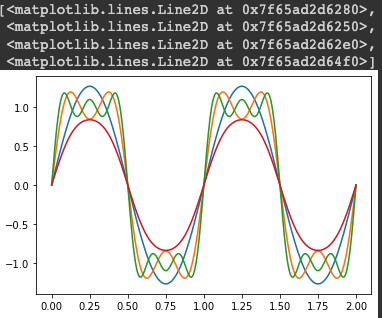
위상이 다른 사인함수
import numpy as np
import matplotlib.pyplot as plt

fs = 100
t = np.arange(0,2,1/fs)
f1 = f2 = f3 = 1

signal1= np.sin(2*np.pi * f1 * t)
signal2= np.sin(2*np.pi * f2 * t + 2*np.pi/2)
signal3= np.sin(2*np.pi * f3 * t + 2 * np.pi/4)

plt.subplot(3,1,1)
plt.plot(t,signal1)
plt.grid()

plt.subplot(3,1,2)
plt.plot(t,signal2)
plt.grid()

plt.subplot(3,1,3)
plt.plot(t,signal3)
plt.grid()
1 비트 디지털 신호 0 또는 1 사인함수
f= 1
t = np.linspace(0, 2, 201) #two cycles, 100 points each
y1 = (4/np.pi)*np.sin(2*np.pi*f*t)
y3 = y1 + (4/(3*np.pi))*np.sin(2*np.pi*3*f*t)
у5 = y3 + (4/(5*np.pi))*np.sin(2*np.pi*5*f*t)
sqwave = np.sin(np.sin(2*np.pi*f*t)) #an actual square wave
plt.plot(t,y1, t,y3, t,у5, t, sqwave)
sq = np.zeros(len(t)) #preallocate the output array
t = np.linspace(0, 2, 201) #two cycles, 100 points each
f = 1
for h in np.arange(1,25,2):
  sq += (4/(np.pi*h))*np.sin(2*np.pi*f*h*t)
sqwave = np.sin(np.sin(2*np.pi*f*t))
plt.plot(t,sq, t,sqwave)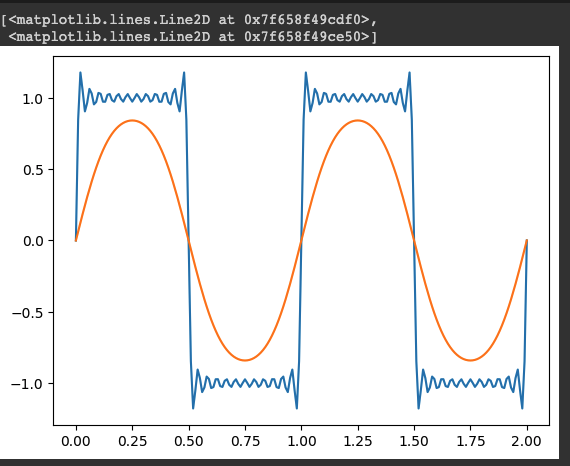
소리로 데이터 통신 : 모스 부호
- 소리
- 아날로그 신호
- 데이터(비트)
- 디지털
모스 인코더
- 아날로그신호 → 알파벳 모스코드 매핑
- 모스코드 해당 wav 파일 저장
모스 디코더
- wav 파일
- frame으로 나누기
- chunk로 나누기
- chunk로 디코딩
Data over Sound 응용 (소리로 데이터를 전송하는 기술)
- 스타벅스 사이렌오더
- 주문 전송할 매장 (안)에 체류중이신 경우 → 매장 음악소리에 포함된 고주파를 마이크로 인식하여 매장명 자동 확인 → 마이크 권한 허용 필요
- 주문 전송할 매장 (밖)에서 사이렌오더 이용시 → GPS활성화를 통한 반경 2Km 내외의 매장 리시트가 뜨면 원하는 매장을 지정 → GPS 위치 설정 허용
용어 정리
- 주기 (Period) : 신호가 반복되는 시간, 시간단위
- 주파수 (Frequency) : 시간당 반복되는 신호 개수, (Hz, kHz, mHz)
- 대역폭 (Bandwidth) :
- 아날로그 : 주파수 범위 (FM : 80MHz ~ 105.7MHz)
- 디지털 : 비트 전송률 (bit rate, bps/Kbps/Mbps/Gbps)
