이번 글에서는 Istio 공식 문서의 Telemetry API 가이드를 따라가며, 커스텀 메트릭을 수집하고 Prometheus에서 그 결과를 직접 확인하는 실습 과정을 정리한다. 실습 환경은 다음과 같다:
- Kubernetes: Minikube v1.35.0, K8s v1.23.17
- Istio: 1.17.8 (Demo 프로파일 설치)
- Metric Backend: Prometheus (Istio demo 프로파일 기본 포함)
1. 실습 환경 준비
(1) Minikube 클러스터 상태 점검 및 재시작
기존에 실행되던 Minikube 클러스터의 버전이 맞지 않아 다음 명령어로 클러스터를 삭제하고 재생성했다.
minikube delete
minikube start --kubernetes-version=v1.23.17
(2) Istio 1.17 Demo 프로파일 설치
istioctl install --set profile=demo -y설치 후 istio-system 네임스페이스에 다음 컴포넌트가 정상적으로 뜨는 것을 확인했다:
istiodistio-ingressgatewayistio-egressgateway
2. 샘플 애플리케이션 배포
(1) 테스트 네임스페이스 생성 및 사이드카 주입
kubectl create namespace telemetry-test
kubectl label namespace telemetry-test istio-injection=enabled
(2) httpbin / sleep 애플리케이션 배포
kubectl apply -f samples/httpbin/httpbin.yaml -n telemetry-test
kubectl apply -f samples/sleep/sleep.yaml -n telemetry-test
사이드카가 주입되어 READY 상태가 2/2로 표시되는 것을 확인했다.
3. 기본 통신 확인
(1) Pod 간 통신 테스트
kubectl exec -n telemetry-test deploy/sleep -c sleep -- \
  curl -sS http://httpbin.telemetry-test.svc.cluster.local:8000/headers
정상 응답:
{
  "headers": {
    "X-B3-TraceId": "...",
    "X-Envoy-Attempt-Count": "1",
    "X-Forwarded-Client-Cert": "...",
    ...
  }
}
→ 사이드카 프록시가 요청을 캡처하고 트래픽에 추적 정보와 인증 정보를 첨부한 것이 확인됨.
4. Telemetry 커스텀 리소스 적용
(1) Telemetry 리소스 정의
apiVersion: telemetry.istio.io/v1alpha1
kind: Telemetry
metadata:
  name: httpbin-metrics
  namespace: telemetry-test
spec:
  metrics:
    overrides:
      - match:
          metric: REQUEST_COUNT
        tagOverrides:
          version:
            value: "v1"
            operation: UPSERT
(2) 적용 및 트래픽 생성
kubectl apply -f httpbin-telemetry.yaml
for i in {1..30}; do
  kubectl exec -n telemetry-test deploy/sleep -c sleep -- \
    curl -s http://httpbin.telemetry-test.svc.cluster.local:8000/headers > /dev/null
  sleep 0.3
done
5. Prometheus에서 메트릭 확인
(1) Port-forward로 Prometheus 접속
kubectl port-forward -n istio-system svc/prometheus 9090:9090브라우저에서 http://localhost:9090 접속
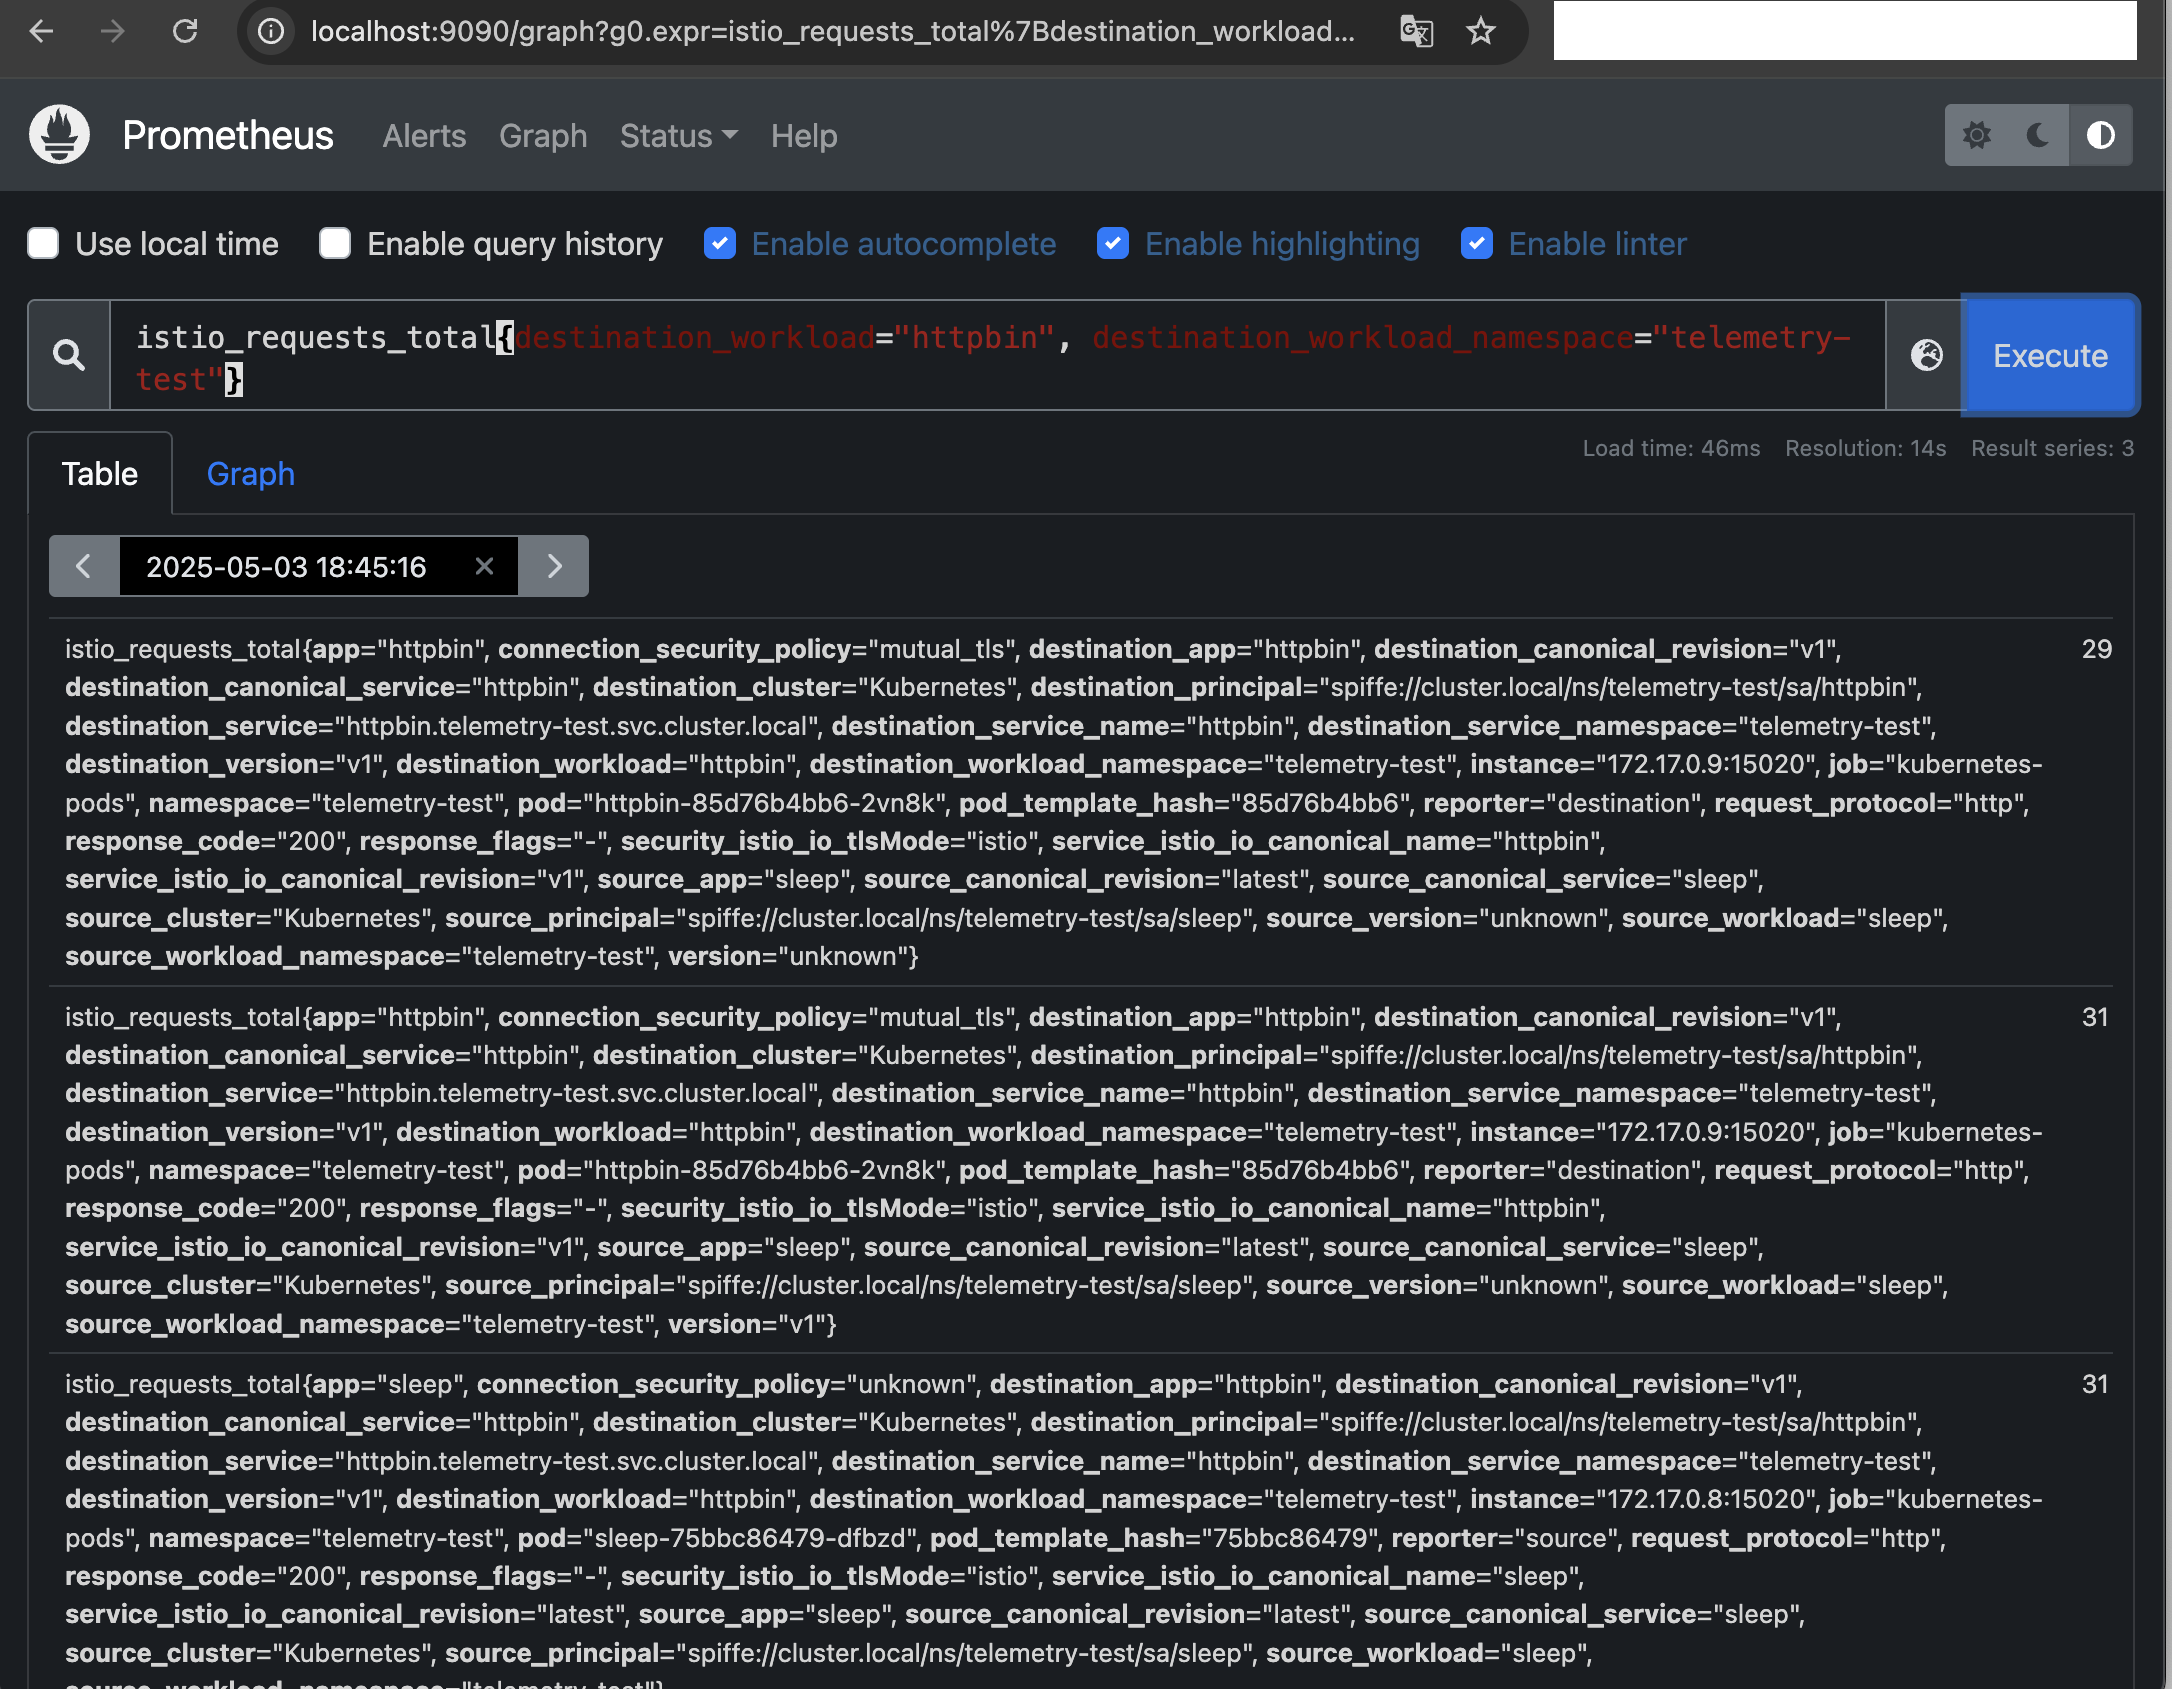
(2) 쿼리 실행
istio_requests_total{destination_workload="httpbin", destination_workload_namespace="telemetry-test"}쿼리 결과:
httpbin으로 향한 요청 수가 3개로 구분되어 표시됨- 각 메트릭 라벨에
version="v1"커스텀 태그가 추가됨 reporter,source_workload,destination_service,security_policy등 다양한 라벨이 붙어 추적 가능
마무리
이번 실습을 통해 Istio의 Telemetry API를 이용해 메트릭 라벨을 동적으로 추가하거나 수정할 수 있음을 확인했다. 커스텀 메트릭 설정은 트래픽을 라벨 기반으로 필터링하거나, 대시보드에 추가적인 맥락 정보를 표시하는 데 유용하다.