시계열 기반으로 메트릭을 수집, 저장하는 모니터링 도구
메트릭: 시스템이나 애플리케이션의 상태를 수치로 표현한 데이터
프로메테우스
프로메테우스는 인프라(리눅스 서버, 윈도우 서버, 네트워크 장비 등), 애플리케이션(웹 서버, 데이터베이스, 메시지 브로커 등), 클라우드 서비스(AWS, GCP, Azure 리소스나 OpenStack, Ceph 같은 스토리지/클라우드 플랫폼 등) 혹은 커스텀 애플리케이션을 모니터링 할 수 있는 범용 모니터링 시스템이다.
프로메테우스는 대상의 메트릭 엔드포인트에 직접 접속해서 메트릭을 가져온는 pull 방식으로 동작하기 때문에 메트릭 엔드포인트만 있다면 어떤 대상이든 모니터링할 수 있다.
핵심 개념
-
Pull 방식으로 메트릭 수집
Prometheus 서버가 대상(Target, Exporter라고도 함)에 주기적으로 접속해서 메트릭을 가져온다. -
시계열(Time Series) 데이터 기반 저장
모든 데이터를 시계열 형태로 저장한다. 즉, 메트릭(metric)의 값이 "시간의 흐름에 따라 어떻게 변했는지" 기록하는 구조이다. -
PromQL(Prometheus Query Language)
시계열 데이터를 질의하고 가공할 수 있는 쿼리 언어를 제공(?)한다. -
경량 TSDB(Time Series Database) 내장
외부 DB 필요 없이 자체적으로 시계열 데이터를 디스크에 저장한다. -
Alertmanager(알림 시스템) 연동
특정 조건이 발생하면 Alertmanager와 연동해 이메일, Slack, PagerDuty 등으로 알림을 전송할 수 있다.
아키텍쳐 구성요소
-
Exporter: 메트릭을 수집해서 Prometheus가 이해할 수 있는 형식으로 엔드포인트에 노출시키는 에이전트- DB, HW, 메시지 시스템, 저장소 등 각 대상에 특화된(?) 익스포터와 기존의 서버 모니터링에 사용되는 에이전트와 통합이 가능하다.
- 기본 제공되는 익스포터 이외에 도메인에 적합하게 개발된 MSA의 메트릭을 측정하고자 할 때에는 커스텀 익스포터 개발이 필요한데, 이때 사용할 수 있는 API와 SDK가 제공된다.
- ex) Node Exporter(서버 자원 모니터링), cAdvisor(컨테이너 모니터링), kube-state-metrics(K8s 리소스 상태)
-
Prometheus Server: 메트릭 수집 + 저장 + 쿼리 담당 -
Prometheus Adaptor: Prometheus 메트릭을 Kubernetes Custom Metrics API가 이해할 수 있도록 변환- HPA는 Prometheus에 직접 접근하지 못하고, 쿠버네티스의 Custom Metrics API를 통해서만 확장 지표를 읽을 수 있다.
- Adapter가 Prometheus의 쿼리 결과를 HPA가 이해할 수 있는 형식으로 변환해준다.
- 기존 메트릭 서버는 기본 메트릭만 측정할 수 있으며 복잡한 커스틱 메트릭을 지원하지 못했는데 프로메태우스 어댑터로는 복잡한 커스텀매트릭을 측정하고 HPA와 연계해서 신속하게 오토스케일링을 지원한다.
-
HPA (Horizontal Pod Autoscaler): Kubernetes의 리소스 오토스케일링 기능 중 하나로 CPU, 메모리, 혹은 커스텀 메트릭(예: QPS, 요청 지연시간 등)을 기반으로 애플리케이션(파드)의 부하를 자동으로 감지해서 파드 개수를 늘리거나 줄이는 역할- Prometheus Adapter를 통해 custom metric을 받아서, Deployment의 replica 수를 늘리거나 줄인다.
✨정리 : 매트릭이 익스포터를 통해서 제공되면 프로메테우스 서버가 이를 스크래핑한 후 프로메테우스 어댑터에게 전달하여 HPA가 이해할 수 있는 형식으로 변환한다. HPA는 변환된 값을 감지하여 증가하는 시스템 부하에 대응하기 위해 파드를 오토스케일링한다.
파드는 쿠브 프록시를 이용해서 관리 프로메테우스 오퍼레이터가 쿠브 프록시를 감시한다.
[Pod] --메트릭--> [Prometheus Server] --PromQL결과--> [Prometheus Adapter] --Custom Metrics API--> [HPA] --replica 변경--> [Deployment] --Pod scale in/out
프로메테우스 오퍼레이터: 쿠버네티스에 프로메테우스를 구성할 때 자원 관리와 프로비저닝을 수행하는 역할- 쿠버네티스에 Prometheus, Alertmanager, Grafana 등 모니터링 스택의 설치와 관리를 자동화 한다.
일반적으로 쿠버네티스에서는 헬름이나 오퍼레이터로 프로메테우스를 설치할 수 있다.
쿠버네티스에서 동적으로 증가하는 파드와 서비스를 발경한다.
프로메테우스 오퍼레이터 내부의 Service Monitor와 Pod Monitor가 서비스 디스커버리 역할을 수행한다.
오퍼레이터가 서비스와 파드의 증감을 발생 시 프로메테우스 구성 파일을 업데이트한다.
- 쿠버네티스에 Prometheus, Alertmanager, Grafana 등 모니터링 스택의 설치와 관리를 자동화 한다.
-
Alertmanager: 알람 처리
-
PromQL: 쿼리 언어
-
Grafana: 시각화 도구 (Prometheus와 자주 같이 사용됨)
사용
프로메테우스 오퍼레이터
기능
구성
사용
프로메테우스와 노드 익스포터 설치 및 메트릭 조회
- 노드 익스포터 : 유닉스 계역의 커널을 가진 하드웨어와 OS의 시스템 메트릭을 수집해주는 소프트웨어
프로메테우스 설치
-
프로메테우스 바이너리 다운로드 :
wget https://github.com/prometheus/prometheus/releases/download/v3.5.0/prometheus-3.5.0.linux-amd64.tar.gz -
압축 해제 :
tar xvzf proetheus-3.5.0.linux-amd64.tar.gz -
프로메테우스 사용을 위한 유저 추가 :
sudo useradd --no-create-home --shell /bin/false prometheus -
디렉토리 생성 및 소유자 변경
sudo mkdir /etc/prometheus
sudo mkdir /var/lib/prometheus
sudo chown -R prometheus /etc/prometheus
sudo chown -R prometheus /var/lib/prometheus- 프로메테우스 실행 파일 복사 및 소유자 변경
sudo cp prometheus-3.5.0.linux-amd64/prometheus /usr/loca/bin/
sudo chown prometheus /usr/local/bin/prometheus- 설정 파일 생성
cd /etc/prometheus
nano prometheus.yaml
prometheus.yaml
global:
  srcrape_interval: 15s
  evaluation_interval: 15s

scrape+configs:
  - job_name: "prometheus"
    static_configs:
      - targets: ["locaslhost:9090"]
  - job_name: "node
	static_configs:
- targets: ['localhost:9100']- prometheus 서비스의 유저를 prometheus로 등록하기 위한 설정 파일 생성
[Unit]
Description=Prometheus
Wants=network-online.target
After=network-online.target

[Service]
User=prometheus
Group=prometheus
Type=simple
ExecStart=/usr/local/bin/prometheus \
--config.file /etc/prometheus/prometheus.yaml \
--storage.tsdb.path /var/lib/prometheus/ \
--storage.tsdb.max-block-duration=1m \
--storage.tsdb.min-block-duration=1m \
--web.enable-lifecycle \
--web.enable-admin-api \
--log.level=info

[Install]
WantedBy=multi-user.target
- 서비스 시작 :
sudo systemctl start prometheus - 서비스 확인 :
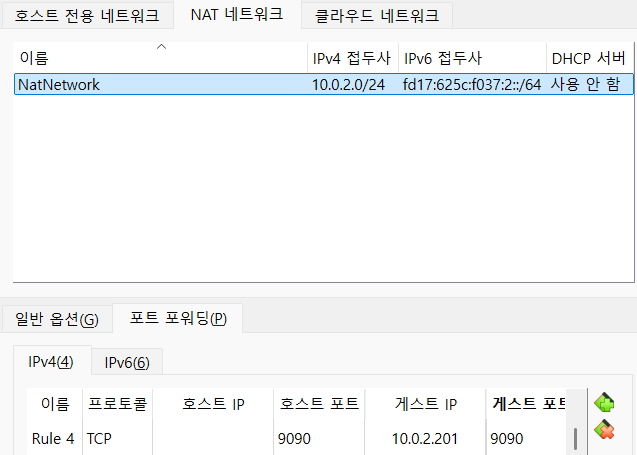
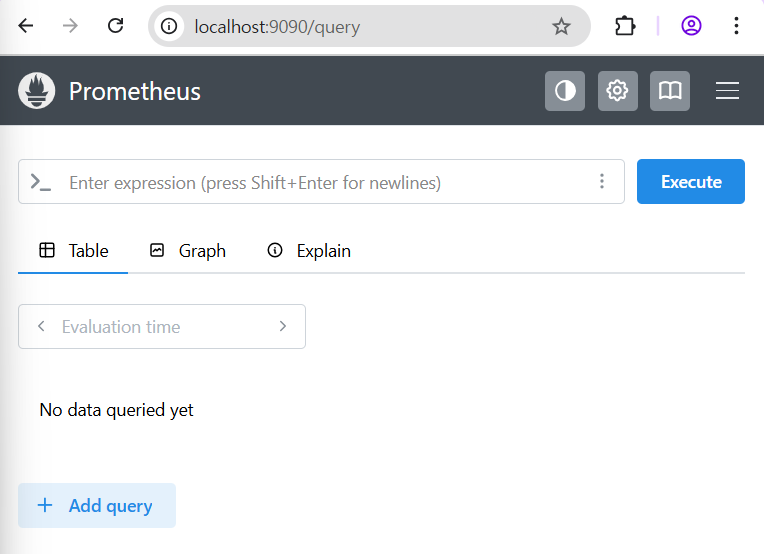
sudo systemctl status prometheus - 포트포워딩 후 브라우저에서 확인
노드 익스포터 설치
- node_exporter 바이너리 파일 다운로드 :
wget https://github.com/prometheus/node_exporter/releases/download/v1.9.1/node_exporter-1.9.1.linux-amd64.tar.gz - 압축 해제 :
tar xvf node_exporter-1.9.1.linux-amd64.tar.gz - 유저 추가 :
sudo useradd --no-create-home --shell /bin/false node_exporter - 실행 파일 복사 :
sudo cp node_exporter-1.9.1.linux-amd64/node_exporter /usr/local/bin/
(node_exporter는 따로 설정 파일이 필요없음) - 소유자 변경 :
sudo chown node_exporter /usr/local/bin/node_exporter - 서비스 등록 :
sudo nano /etc/systemd/system/node_exporter.service
서비스는 여기에 만들지 않으면 실행이 안됨!
node_exporter.service
[Unit]
Description=Node Exporter
Wants=network-online.start
After=network-online.target

[Service]
Type=simple
User=node_exporter
Group=node_exporter
ExecStart=/usr/local/bin/node_exporter
Restart=on-failure

[Install]
WantedBy=multi-user.target-
서비스 실행 :
sudo systemctl start node_exporter
node_exporter 서비스 실행을 위해서는 prometheus 서비스가 실행중이어야 한다. -
서비스 실행 상태 확인 :
sudo systemctl status node_exporter -
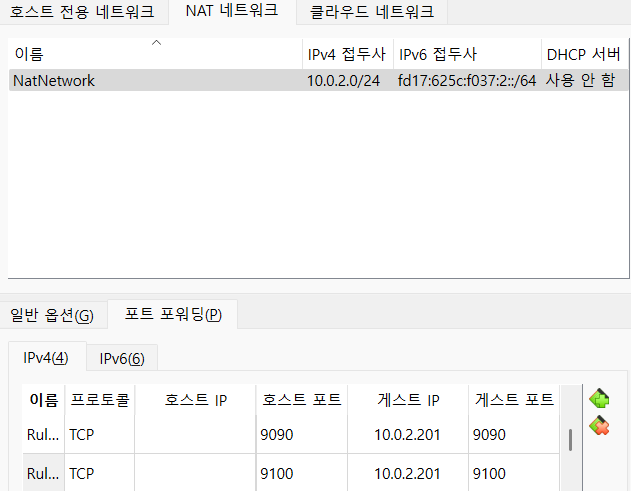
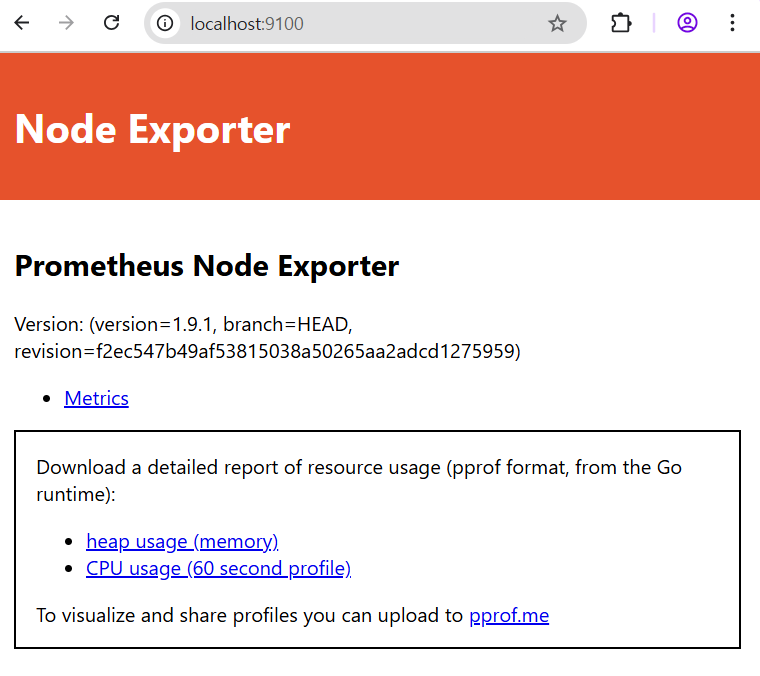
포트 포워딩 후 브라우저에서 확인
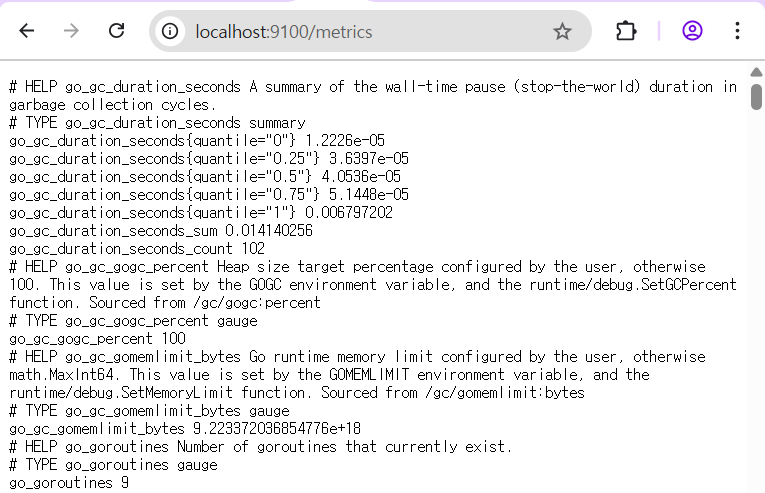
프로메테우스 시계열 데이터베이스
데이터 형식
9100/metrics 경로를 통해서 데이터를 제공하면 프로메테우스 서버는 pull 방식으로 익스포터에서 그 데이터를 수집해서 시계열 데이터베이스에 저장한다.
http_requests_total {status="200", method="GET"} @숫자1 숫자2
- http_requests_total : metric 이름
- {status="200", method="GET"} : 레이블
- 숫자1 : 타임스탬프
- 숫자2 : 값
http_requests_total은 2개의 레이블(status와 method)을 포함하는데 status 레이블은 3종류(200-정상응답, 400-클라이언트 오류, 500-서버오류) method 레이블은 GET과 POST 2종류
실제로는 3 * 2 = 6개의 시계열 데이터를 생성한다.
메트릭에 데이터의 개수를 통해 프로메테우스의 성능과 저장 용량이 결정되기 때문에 중요하다.
- 카디널리티
프로메테우스 인스턴스에 할당되는 컴퓨팅 리소스에 따라 여러 개의 시계열 데이터를 점진적으로 처리한다.
카디널리티는 전체 행에 대한 특정 컬럼의 중복 수치를 나타내는 지표이므로 프로메테우스 서버가 스크래핑을 결정하는 기준이 된다.
주로 메트릭 이름과 연관된 레이블의 이름/값의 조합으로 생성되는 고유 시계열 수를 의미한다.
메트릭에 수없이 조합된 여러 차원은 프로메테우스에서 카디널리티 폭발을 야기하는데 이는 너무 많은 시계열이 생성되기 때문이다. 따라서 중요한 데이터가 아니라면 프로메테우스보다는 로그 기반 시스템에서 처리하는 것이 효율적이다.
데이터 관리
위 형식의 데이터는 프로메테우스 데이터베이스인 TSDB에 저장된다.
특징
- LRU 알고리즘(Least Recently Used Algorithm) : 프로메테우스 TSDB는 가장 오랫동안 참조되지 않은 데이터를 제거하는 LRU 교체 알고리즘을 사용한다.
- Memory Paging : TSDB는 Memory Paging을 통해 프로세스를 일정 크기인 페이지로 분할해서 메모리에 적재한다.
- 샘플을 수집하고 블록 형태로 만들어서 디스크에 저장한다.
- 데이터라는 용어 대신 Chunk라는 용어를 사용한다.
- 하나의 블록은 다수의 Chunk와 인덱스 그리고 여타 데이터로 구성
- 데이터셋은 다수 데이터 그룹을 의미하며 데이터 포인트(포인터?)는 대시보드에서 시계열로 출력되는 개별 데이터
데이터 레이아웃
- 데이터가 프로메테우스에 저장되는 방식은 청크를 포함하는 일련의 디렉토리, 해당 데이터에 대한 LevelDB 인덱스, 사람이 읽을 수 있는 정보가 있는 meta.json 파일과 더이상 필요하지 않은 데이터에 대한 삭제 표시로 구성되고, 이러한 각각의 블럭이 데이터베이스를 나타낸다.
블록 생성
시계열은 시간순으로 인덱싱되는 숫자 데이터 포인트의 시퀀스로 정의된다.
프로메테우스 데이터 포인트는 일정한 시간 간격으로 수집되는데, 이 데이터를 그래프 형식으로 나타낼 때 x축은 시간이 되고, y축은 데이터 값이 된다.
메모리에 수집된 샘플은 기본 두 시간 단위로 디스크로 플러시되고 블록이 생성된다.
블록 병합
크기가 작은 파일과 데이터가 다수 존재하면 모든 파일에 대한 인덱스를 만들고 검색해야 하기 때문에 조회 속도가 느려진다. 반면에 파일 크기가 너무 크면 효율성이 떨어진다. 따라서 블록을 잘 쪼개거나 병합해야 한다.
예를 들어, 파일 크기가 1GB인데 검색 조건에 필요한 데이터의 크기는 1KB라면 1KB를 조회하기 위해서 메모리에 1GB의 데이터를 로딩해야 한다. 이로 인해 불필요한 IO가 발생하게 된다.
-
--storage.tsdb.min-block-duration옵션 : 하나의 블록에 저장되는 데이터의 시간을 의미
기본값 : 2h, 하나의 블록 디렉토리에 2시간 동안의 데이터가 저장됨 -
--storage.tsdb.max-block-duration옵션 : 하나의 블록에 최대로 저장할 수 있는 데이터의 시간
기본값 :--storage.tsdb.retention.time(유지율을 설정하는 옵션)의 10%
기본적으로 하나의 블록에는 3개의 블록이 병합된다.
--storage.tsdb.min-block-duration이 2h라면 두 시간 단위의 레벨 1블록이 만들어지고, 3개의 블록이 만들어지는 순간 레벨 2블록으로 병합된다. 즉, 실제로는 하나의 블록이 6h의 데이터를 저장한다.
- 프로메테우스 로컬 스토리지
프로메테우스에서 데이터를 저장하는 표준 방법
데이터 흐름
- 메모리에 저장
최신 데이터 배치는 최대 두 시간동안 메모리에 보관된다. 여기에는 두 시간동안 수집되는 하나 이상의 데이터 청크를 포함한다. 이 방법은 디스크 IO를 절반 이상 크게 줄이는 효과가 있다.
LRU 알고리즘을 사용하기 때문에 가장 최근의 데이터는 메모리에 상주를 해서 쿼리 속도가 빨라지고, 데이터 청크가 메모리에 생성되므로 반복적인 디스크 쓰기를 방지한다. - 로그 선생 기입
메모리에 있는 데이터는 프로세스가 비정상적으로 종료되면 손실될 수 있다. 이를 방지하기 위해 디스크의 로그 선행 기입(write-ahead logging - WAL)은 메모리 내 데이터의 상태를 유지함으로써 프로메테우스가 어떤 이유로든 충돌하거나 ?? - ??
프로메테우스 쿠버네티스 구성
설치 방식
오퍼레이터를 이용하는 방식
-
kube-prometheus 다운로드 :
sudo git clone https://github.com/prometheus-operator/kube-prometheus.git -
설치 :
kubectl create -f kube-prometheus/manifests/setup
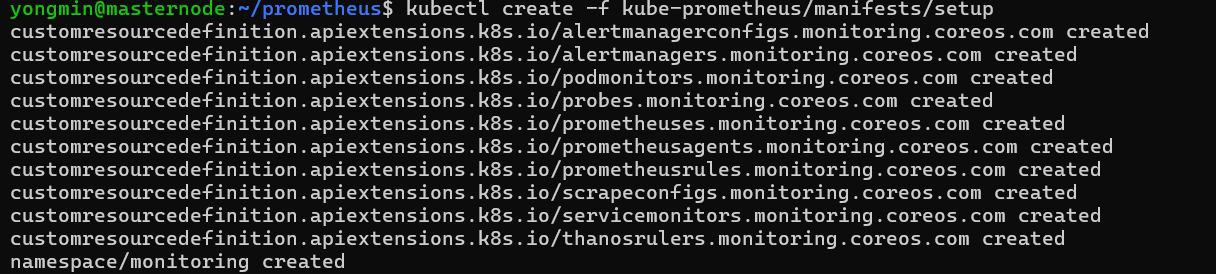
-
확인 :
kubectl get crd -n monitoring -
관리화면에 접속하기 위해서 포트포워딩을 구성 :
kubectl --namespace monitoring port-forward svc/prometheus-k8s 9090 -
alertmanager를 사용하기 위해서 포트포워딩을 구성 :
kubectl --namespace monitoring port-forward svc/prometheus-k8s 9093 -
파드 확인 :
kubekubectl get pods -n monitoring
헬름 차트를 이용하는 방식
프로메테우스 오퍼레이터
헬름 또는 오퍼레이터를 이용해서 구성할 수 있다.
쿠버네티스 오퍼레이터의 장점
- 서비스 모니터 다수를 생성해서 멀티 클러스터 등의 복잡한 런타임 환경에 대응하도록 구성할 수 있다.
- 쿠버네티스에서 구성 정보를 관리하기 위해 컨피그 맵을 사용하는 것처럼 오퍼레이터 타깃 정보도 프로메테우스 컨피그 파일에서 관리한다.
하지만 컨피그맵이나 별도의 파일을 이용하는 것은 수동으로 구성 파일을 변경하는 구조라서 실수할 가능성이 있기 때문에 가급적 자동화하는 것을 권장한다. - 프로메테우스 오퍼레이터의 서비스 모니터와 파드 모니터는 서비스와 파드의 지속적인 모니터링을 통해 자동화한다.
- 쿠버네티스에 변경이 발생하면 자동으로 프로메테우스 타깃 정보를 변경한다.
- 서비스 모니터는 서비스를 모니터링하고 파드 모니터는 파드를 모니터링한다.
- 프로메테우스 오퍼레이터를 사용하면 프로메테우스 서버를 자동으로 변경하고 타깃으로부터 메트릭 수집을 자동화할 수 있다.
프로메테우스 어댑터 ➡️ HPA ➡️ Deployment ➡️ Pod ⬅️ Ingress ⬅️ 유저 트래픽
파드는 kubeproxy가 관리하고 이를 서비스 모니터가 모니터링하고 서비스 모니터는 프로메테우스 오퍼레이터의 일부분이고 프로메테우스 컨피그 파일에 의해서 관리된다.
- 서비스 모니터 확인 :
kubectl get servicemonitor -n monitoring - 서비스 모니터의 구성 내용 확인 :
kubectl edit servicemonitor grafana -n monitoring - 프로메테우스 서버의 파드 명세 :
kubectl edit pod prometheus-k8s-0 -n monitoring
서비스 모니터 생성 순서
헬름으로 프로메테우스 설치
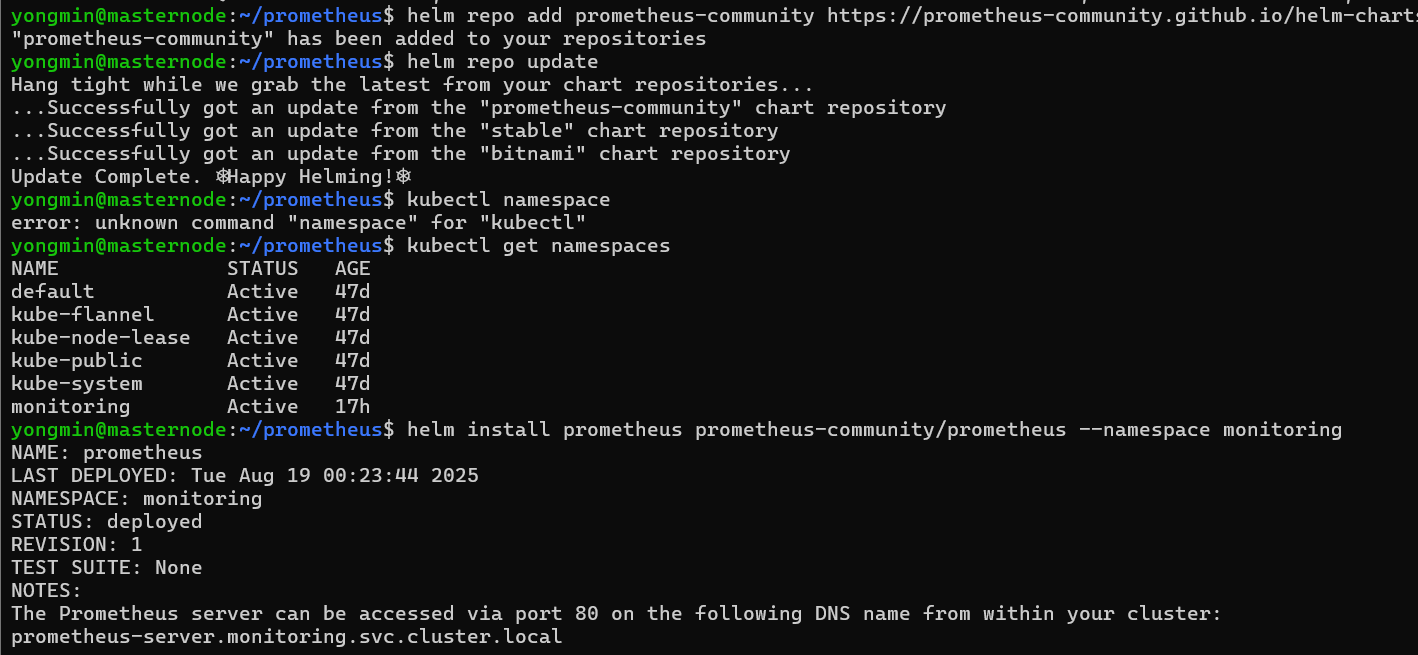
- 저장소 추가
프로메테우스는 stable 저장소나 bitnami 저장소에 존재하지 않는다.
helm repo add prometheus-community https://prometheus-community.github.io/helm-charts
helm repo update - 네임스페이스 추가 :
kubectl create namespace monitoring - 설치 :
helm install prometheus prometheus-community/prometheus --namespace monitoring - helm 목록 확인 :
helm list --namespace monitoring - 파드 확인 :
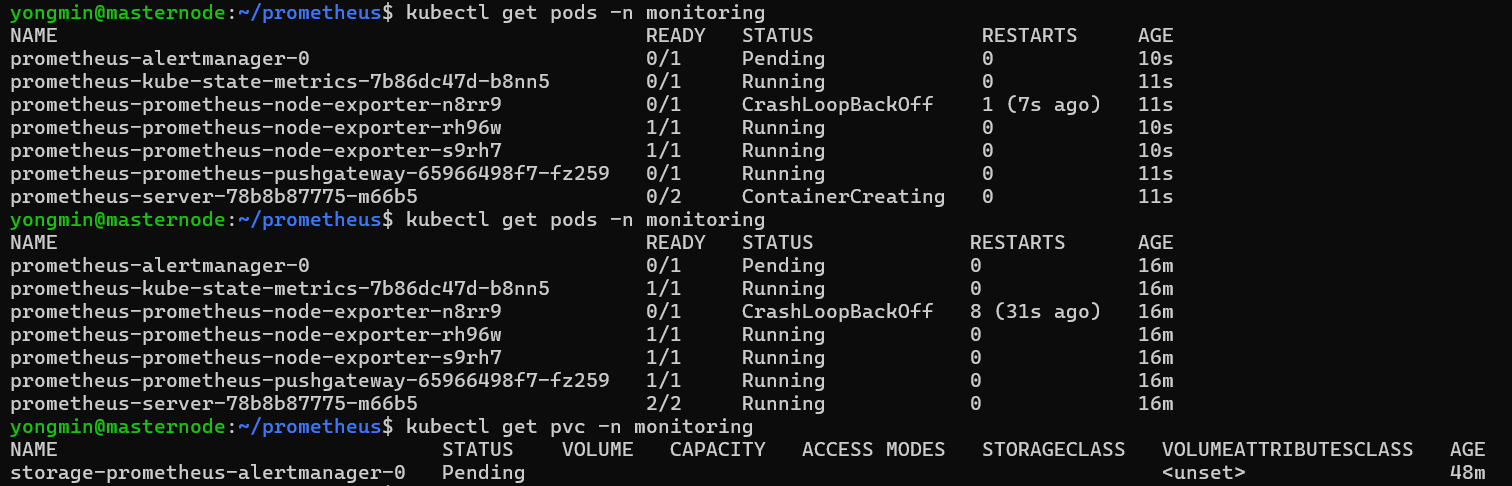
kubectl get pods -n monitoring
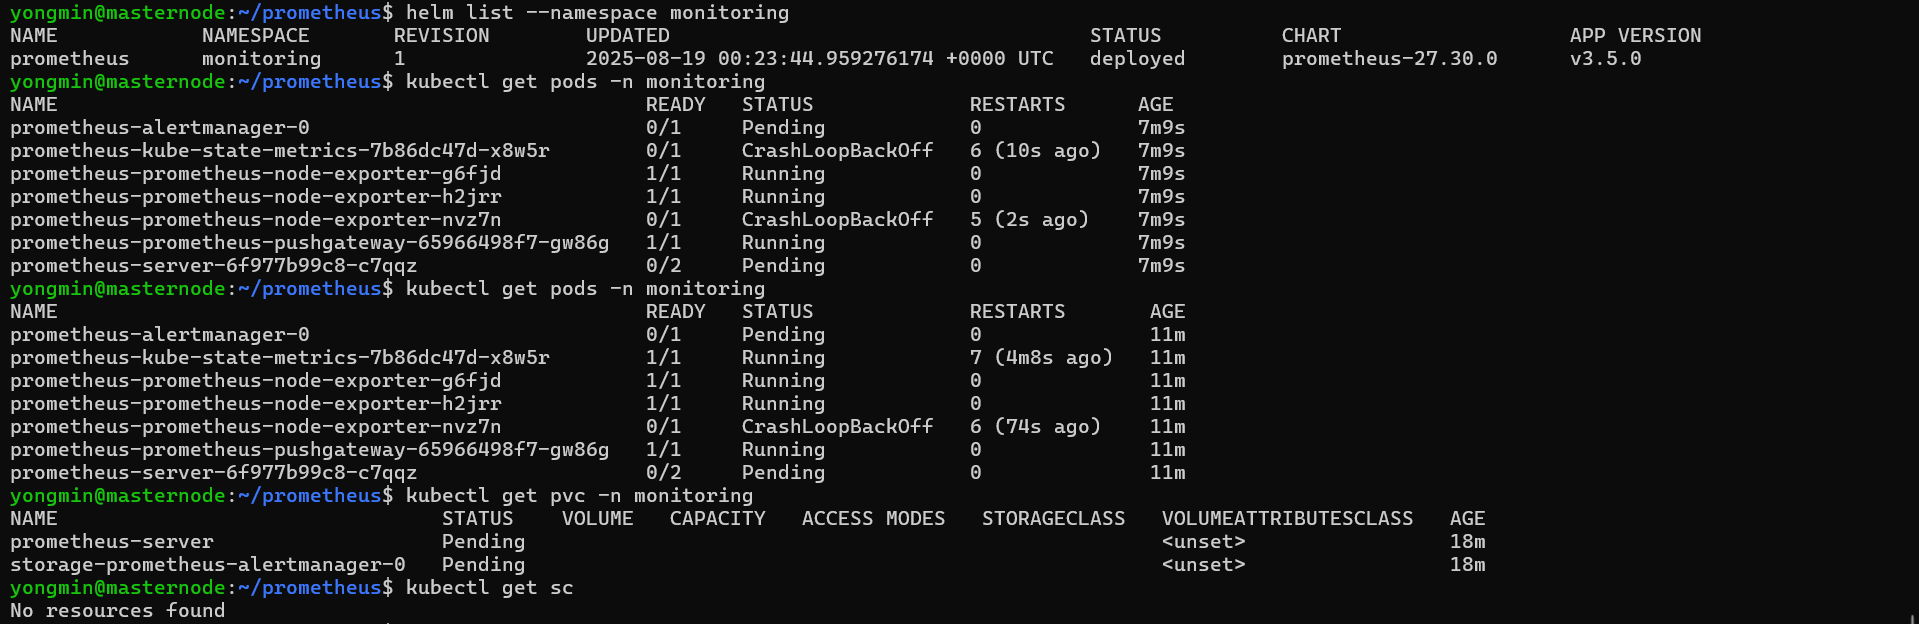
⚠️ 파드가 제대로 설치되지 않은 경우
1. 리소스 부족 가능성
- 리소스 확인 :
kubectl describe pod 파드이름 -n monitoring
0/3 nodes are available이라는 메시지가 보이면 리소스가 부족한 것이므로 클러스터 노드 스펙을 확장하거나 워커 노드를 추가, 혹은 values.yaml 파일에서 resources 값을 줄이면 된다.
values.yaml을 수정하고자 하는 경우 :helm show values prometheus-community/prometheus > values.yaml혹은helm install prometheus prometheus-community/prometheus -f values.yaml -n monitoring
- PVC 문제
PVC가 생성되지 않으면 pod가 제대로 생성되지 않을 수 있다.
- 확인 :
kubectl get pvc -n monitoring
PVC가 pending 상태에 있으면 스토리지 클래스가 없거나 바인딩 불가 상태인 것 - 클래스 확인 :
kubectl get sc
클래스가 없다면 hostPath, nfs, local-path-provisioner와 같은 storage를 만들어주거나 helm을 설치할 때 PVC를 사용하지 못하도록 설정해야 한다.
이전에 만들어진 것이 있으면 삭제 후 재설치
helm uninstall prometheus -n monitoring
helm install prometheus prometheus-community/prometheus --namespace monitoring --set server.persistentVolume.enabled=false --set alertmanager.persistenctVolume.enabled=false --set pushgateway.persistenctVolume.enabled=false
삭제 후 재설치해도 일부 pod가 제대로 생성되지 않고 있다.
- local-path-provisioner 생성 :
kubectl apply -f https://raw.githubcontent.com/rancher/local-path-provisioner/master/deploy/local-path-storage.yaml - local-path-provisioner 확인 :
kubectl get pods -n local-path-storage혹은kubectl get storageclass - 재설치 :
helm install prometheus prometheus-community/prometheus --namespace monitoring --set server.persistentVolume=true --set alertmanager.persistentVolume=true --set alertmanager.persistentVolume.storageClass="local-path" --set server.persistentVolume.storageClass="local-path"
네임스페이스 리소스 제한 문제
kubectl describe quota -n monitoring
- 포트 포워딩
현재 prometheus server가 ClusterIP로 설정되어 있어서 클러스터 외부에서 접속이 안된다.
kubectl prot-forward -n monitoring deploy/prometheus-server 9090:9090
Prometheus + Grafana + AlertManager를 한 번에 설치하기
helm uninstall prometheus -n monitoring
kubectl delete pvc --all -n monitoring
- PVC 스토리지 클래스를 기본값으로 설정 : kubectl get storageclass로 클래스 이름 확인(local-path)
kubectl patch storageclass 클래스이름 -p '{"metadata": {"annotation":{"storageclass.kubernetes.io/is-default-class":"true"}}}'
All in One 패키지도 helm stable 저장소에 없어서 저장소를 추가해야 한다.
helm repo add prometheus-community https://prometheus-community.github.io/helm-charts
helm repo update
-
PVC를 위한 클래스 추가(local-path를 기본값으로 설정)
-
namespace 추가(monitoring)
-
설치 :
helm install 이름 헬름차트 -n namespace
helm install monitoring prometheus-community/kube-prometheus-stack -n monitoring -
확인 :
helm list -n monitoring
kubectl get pods -n monitoring
kubectl get svc -n monitoring
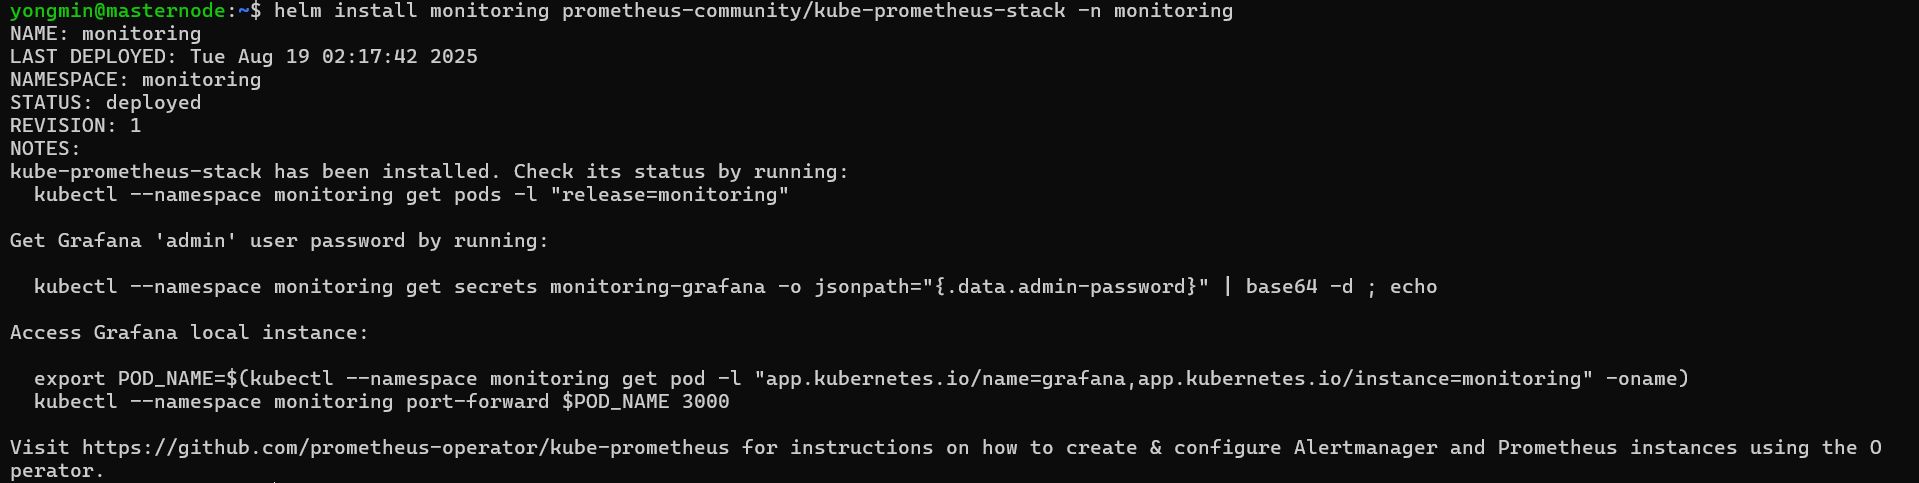
- grafana 포트 포워딩 (3000번으로 포트포워딩) :
kubectl port-forward -n monitoring svc/monitoring-grafana 3000:80
ID는 admin, 비밀번호는 prom-operator
- prometheus ui 포트포워딩(9090번으로 포트포워딩)
kubectl port-forward -n monitoring svc/monitoring-kube-prometheus-prometheus 9090:9090
Grafana의 Service Type 변경
-
values.yaml 파일을 추출
helm show values prometheus-community/kube-prometheus-stack > values.yaml -
Prometheous의 Service Type을 변경해서 외부에서 UI에 접근하도록 설정
values.yaml 파일을 열어서 grafana의 service type을 NodePort로 수정 -
수정한 내용 적용 :
helm upgrade monitoring prometheus-community/kube-prometheus-stack -n monitoring -f values.yaml
테스트
- namespace 생성 :
kubectl create namespace custom-metrics - deployment 생성
sample-deployment.yaml
apiVersion: apps/v1
kind: Deployment
metadata:
  name: autoscaling-deploy
  namespace: custom-metrics
spec:
  replicas:
  template:
    metadata:
      labels:
        app: autoscaling
        release: prom
    spec:
      containers:
      - name: autoscaling
        image: query.io/branch/prometheus-example-app:v1.0.0
        ports:
- containerPort: 8080- Service 생성
apiVersion: v1
kind: Service
metadata:
  labels:
    app: sample-app
  name: sample-app
spec:
  ports:
    - name: http
      port: 80
      protocol: TCP
      targetPort: 8080
      nodePort: 32001
  selector:
    app: sample-app
type: NodePort- Service Monitor 생성
apiVersion: monitoring.coreos.com/v1
kind: ServiceMonitor
metadata:
  name: sample-app
  labels:
    app: sample-app
spec:
  selector:
    matchLabels:
      app: sample-app
  endpoints:
- port: http - HPA 생성
sample-hpa.yaml
apiVersion: autoscaling/v2
kind: HorizontalPodAutoScaler
kubectl get deploy -n monitoring