Q: ROC 커브에 대해 설명해주실 수 있으신가요?
ROC 커브는 모든 가능한 threshold에 대해 분류모델의 성능을 평가하는 데 사용됩니다.
ROC 커브 아래의 영역을 AUC (Area Under thet Curve)라 합니다.
ROC 커브는 아래 plot 처럼 왼쪽 상단에 가까울수록 좋습니다. 즉 AUC가 클수록 좋습니다.
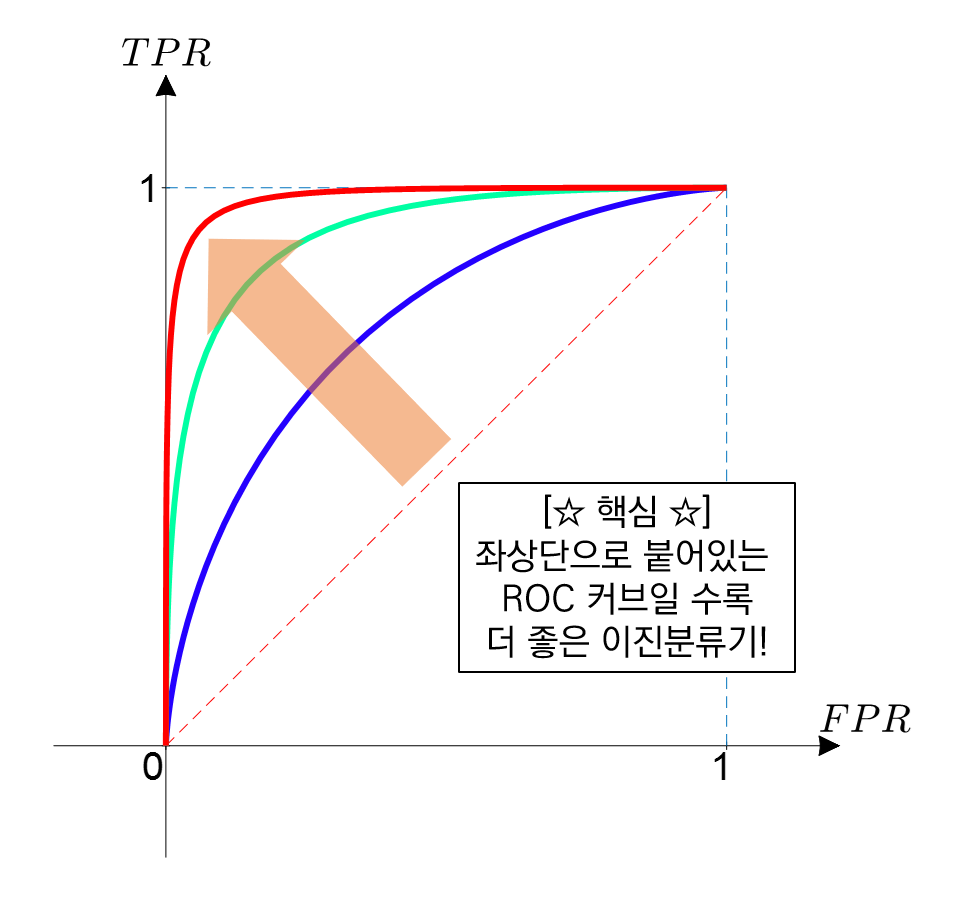
ROC 커브의 x축은 FPR(Flase Positive Rate)이고 y축은 TPR(True Positive Rate)입니다.
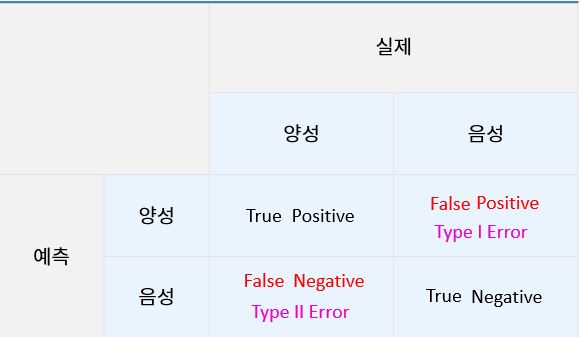
양성(1, Positive), 음성(0, Negative)
- 민감도(Sensitivity, True positive rate(TPR), Recall): 실제 Positive(양성)를 Positive(양성)이라고 예측하는 비율
- 특이도(Specificity, True Negative rate(TNR) ): 실제 Negative(음성)을 Negative(음성)이라고 예측하는 비율
- False positive rate(FPR) = 1-specificity : 실제 Negative(음성)을 Positive(양성)이라고 예측하는 비율
따라서 TPR은 높을수록, FPR은 낮을수록 좋기 때문에 ROC 커브가 좌측 상단에 가까울수록 좋은 것입니다.
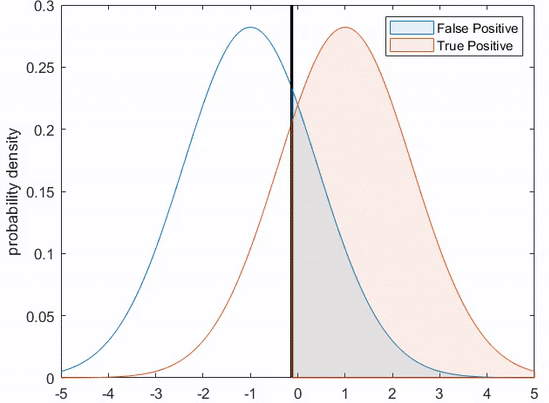
검정 수직선: threshold
빨간선 분포: 실제 Positive에 대한 예측 분포
파란선 분포: 실제 Negative에 대한 예측 분포
그림에서 threshold 기준 오른쪽이면 Positive로 예측하고 왼쪽이면 Negative로 예측합니다.
threshold가 높아지면 FP와 TP는 모두 작아지고 threshold가 낮아지면 마찬가지로 FP와 TP가 함께 커집니다.
<threshold 변화에 따른 ROC 커브 위의 점 위치 변화>
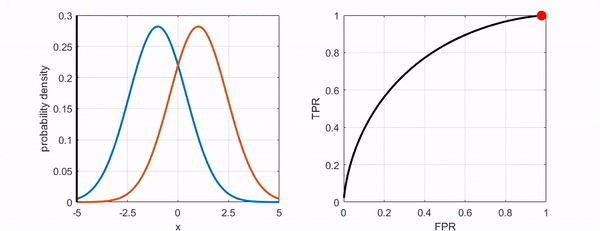
threshold가 작아짐 → FPR, TPR 커짐 → ROC 커브에서 위의 점(특정 threshold에서의 값)은 오른쪽으로 이동
반대로 threshold가 커지면 ROC 커브 위 점은 왼쪽으로 이동
Reference
https://angeloyeo.github.io/2020/08/05/ROC.html
https://losskatsu.github.io/machine-learning/stat-roc-curve/#2-%EB%AF%BC%EA%B0%90%EB%8F%84%EC%99%80-%ED%8A%B9%EC%9D%B4%EB%8F%84
면접 질문 출처
https://github.com/zzsza/Datascience-Interview-Questions