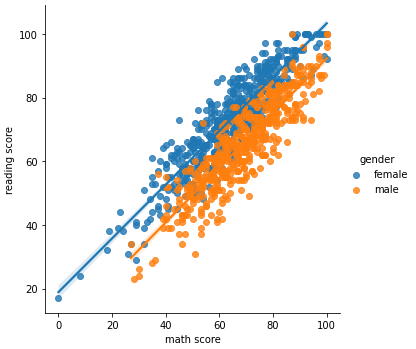
공부 내용
- jointplot
- pairplot
- FacetGrid
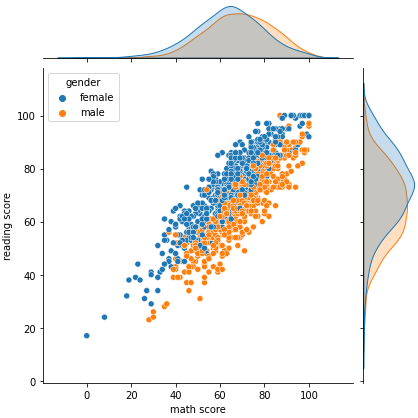
Joint Plot
- 2개 feature의 결합확률 분포와 함께 각각의 분포도 살필 수 있는 시각화
hue를 사용하여 구분 가능kind를 활용하여 다양한 종류의 분포 확인 가능- `scatter, kde, hist, hex, reg, resid
Pair Plot
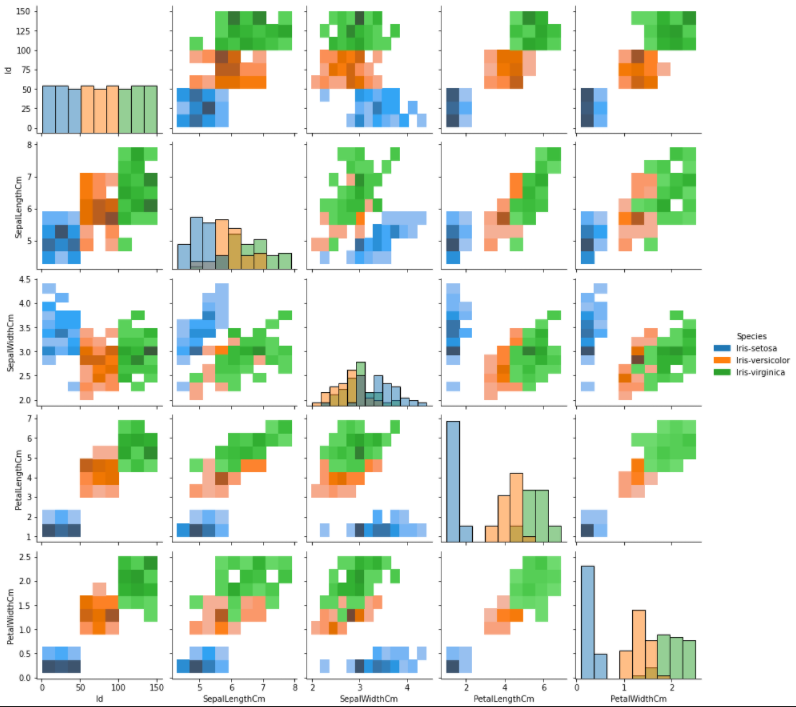
- 데이터셋의 pair-wise 관계를 시각화하는 함수
- 시각화 방법 조정 파라미터
- kind : 전체 서브플롯 조정
scatter, kde, hist, reg
- diag_kind : 대각 서브플롯 조정
auto, hist, kde, None
- kind : 전체 서브플롯 조정
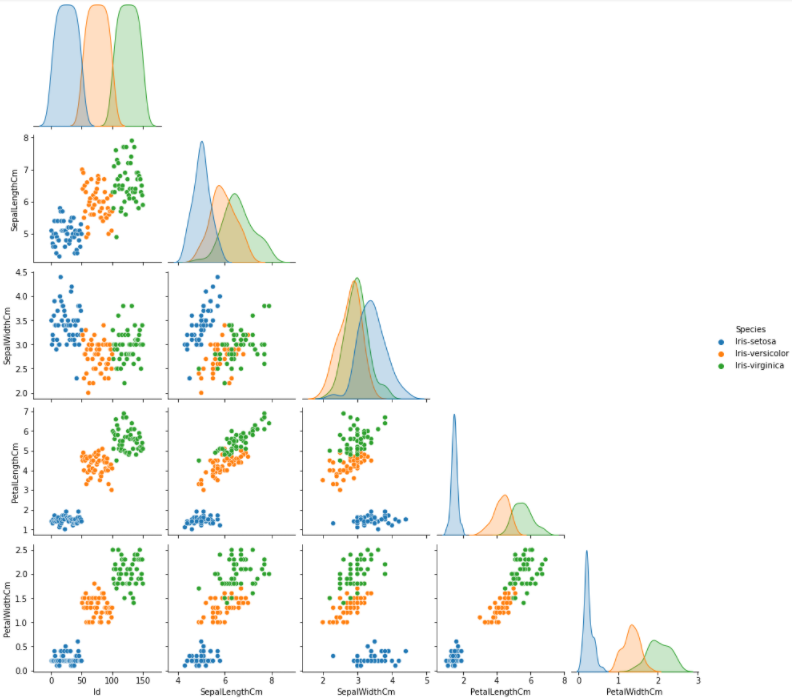
corner = True활용해서 대칭 정보를 지울 수 있음
FacetGrid
- pairplot과 같이 다중패널을 사용하는 시각화
- pairplot은 feature-feature 사이만 살피지만 Facet Grid는 feature category 간 관계도 살펴볼 수 있다.
- FacetGrid 기반 함수
catplot: Categoricaldisplot: Distributionrelplot: Relationallmplot: Regression
Catplot
-
catplot 관련 방법론
-
Categorical scatterplots:
stripplot()(kind="strip"; the default)swarmplot()(kind="swarm")
-
Categorical distribution plots:
boxplot()(kind="box")violinplot()(kind="violin")boxenplot()(kind="boxen")
-
Categorical estimate plots:
pointplot()(kind="point")barplot()(kind="bar")countplot()(kind="count")
-
-
행과 열을 조정하는 것이 중요
-> 각 행과 열의 category를 기반으로 그래프의 개수가 조정됨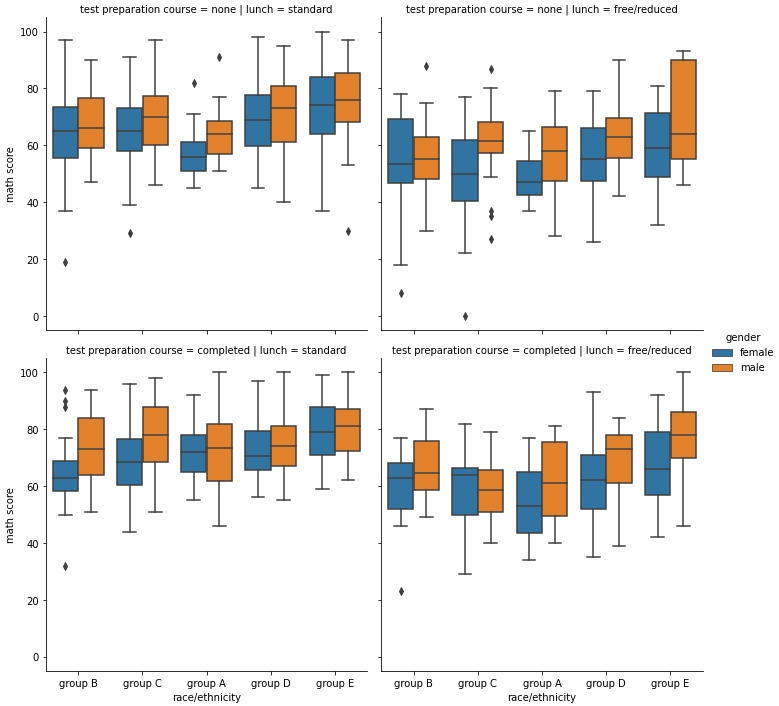
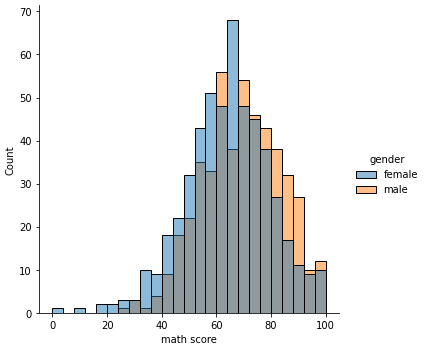
Displot
- displot 관련 방법론
histplot()(kind="hist"; the default)kdeplot()(kind="kde")ecdfplot()(kind="ecdf"; 단일변수에서만 사용 가능)
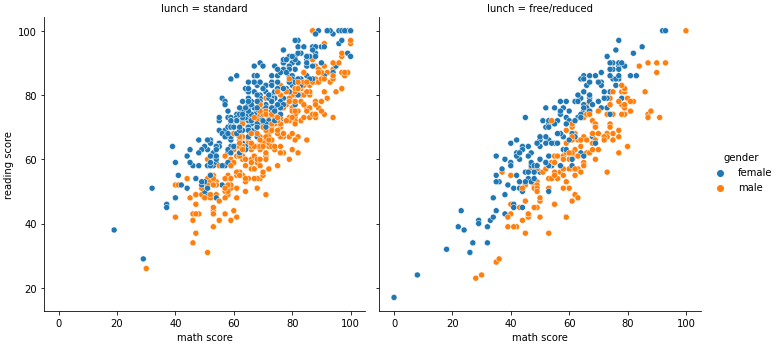
Relplot
- relplot 관련 방법론
scatterplot()(kind="scatter"; the default)lineplot()(kind="line")
Lmplot
regplot()방법론 사용 가능
