
This content is from: https://www.youtube.com/@mrdbourke, specifically, https://www.youtube.com/watch?v=Z_ikDlimN6A&ab_channel=DanielBourke
Step 1: Import libraries
import torch
from torch import nn # nn contains all PyTorch's building blocks for neural networks
import matplotlib.pyplot as plt

# Check PyTorch version
torch.__version__
Result
1.12.1+cu113Step 2: Create features & labels
# Create some data using the linear regression formula of y = weight * X + bias
weight = 0.7
bias = 0.3

# Create range values
start = 0
end = 1
step = 0.02

# Create X and y (features and labels)
X = torch.arange(start, end, step).unsqueeze(dim=1) # without unsqueeze, errors will pop up
y = weight * X + bias
X[:10], y[:10]
Result
(tensor([[0.0000],
         [0.0200],
         [0.0400],
         [0.0600],
         [0.0800],
         [0.1000],
         [0.1200],
         [0.1400],
         [0.1600],
         [0.1800]]), tensor([[0.3000],
         [0.3140],
         [0.3280],
         [0.3420],
         [0.3560],
         [0.3700],
         [0.3840],
         [0.3980],
         [0.4120],
         [0.4260]]))
Step 3: Split the data
train_split = int(0.8 * len(X))
X_train, y_train = X[:train_split], y[:train_split]
X_test, y_test = X[train_split:], y[train_split:]
len(X_train), len(y_train), len(X_test), len(y_test)
Result
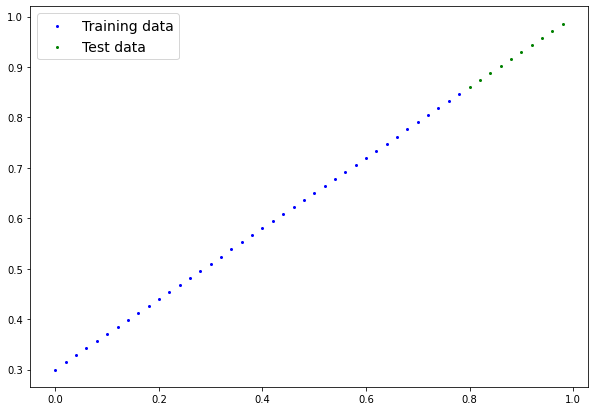
(40, 40, 10, 10)Step 4: Create plot_predictions function
def plot_predictions(train_data=X_train,
                     train_labels=y_train,
                     test_data=X_test,
                     test_labels=y_test,
                     predictions=None):
  """
  Plots training data, test data, and compares predictions.
  """
  plt.figure(figsize=(10,7))

  # Plot training data in blue
  plt.scatter(train_data, train_labels, c="b", s=4, label="Training data")

  # Plot test data in green
  plt.scatter(test_data, test_labels, c="g", s=4, label="Test data")

  # Are there predictions?
  if predictions is not None:
    # Plot the predictions if they exist
    plt.scatter(test_data, predictions, c="r", s=4, label="Predictions")

  # Show the legend
  plt.legend(prop={"size": 14});
Step 5: Plot the data
plot_predictions(X_train, y_train, X_test, y_test)Result

A coder who wants to be a programmer