Spring Batch 모니터링 With Pushgateway & Prometheus & Grafana


Pushgateway
- Prometheus 는 기본적으로 매트릭 지표를 제공하는 서버에게 주기적으로 요청(pull)하여 매트릭을 수집하도록 되어있다.
- 하지만, Batch 와 같은 단발성 작업으로 설계된 Task를 수행하는 애플리케이션들은 작업이 시작되고 종료되면 프로세스가 끝난다. 그렇기 때문에 주기적으로 Prometheus 에서 매트릭을 수집할 수 없다. 이런 단발성 작업을 수행하는 애플리케이션에서 매트릭을 Prometheus 에게 역으로 푸시할 수 있도록 지원하는게 바로 Pushgateway(푸시 게이트웨이)이다.
💡 WHEN TO USE THE PUSHGATEWAY From Prometheus Docs
- Pushgateway는 Prometheus의 Pull 모델로 데이터를 수집할 수 없는 작업에서 메트릭을 푸시할 수 있도록 돕는 중간 서비스입니다.
- 예를 들어, 서비스 레벨의 배치 작업(특정 머신이나 인스턴스와 관련되지 않은 작업)에서 작업 결과를 수집하고자 할 때 유용합니다.
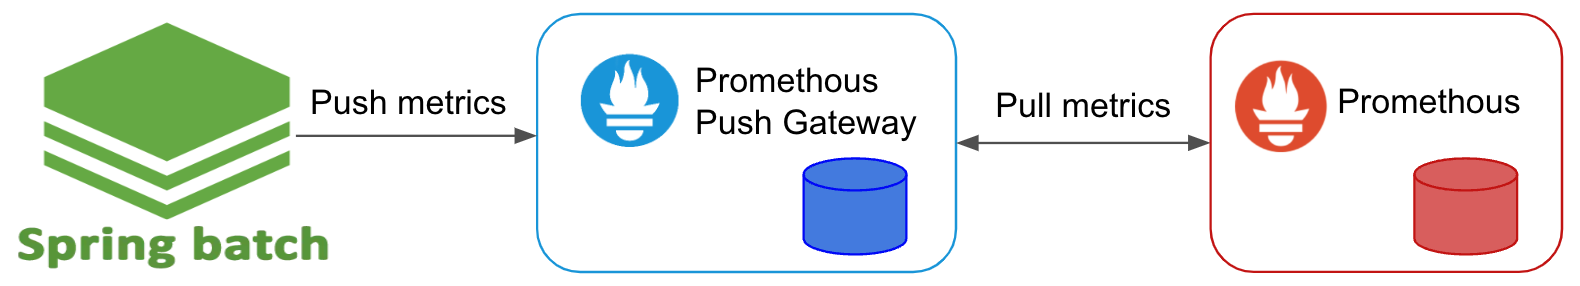
- Prometheus 에서 제공하는 Pushgateway는 매트릭을 Push 할 수 있도록 지원하며, Pushgateway에 Push 된 매트릭을 Prometheus 에서 Pulling 하여 가져갈 수 있도록 중개자 역할을 한다. 이런 구조로 Pushgateway에 Push 된 매트릭을 프로메테우스에서 가져갈 수 있다.
- 즉, Pushgateway 가 Spring batch 에서 생성된 매트릭의 중간 저장소 역할을 수행하는 것 이다.
최종 Spring Batch - Grafana 모니터링 화면
- 확인할 수 있는 지표
- Job Launch Total Count (전체 Job 실행 횟수)
- Job COMPLETED Count (Job 성공 횟수)
- Job FAILED Count (Job 실패 횟수)
- Job Duration (Job 실행 시간)
- Item Read Throughput (초당 Item Read 실행 횟수)
- Item Write Throughput (초당 Item Batch Write 실행 횟수)
Spring batch 프로젝트 ↔ Pushgateway 연동
Prometheus 관련 라이브러리 추가
/build.gradle
// ... 생략 ...

dependencies {
	// spring batch
	implementation 'org.springframework.boot:spring-boot-starter-batch'

	// prometheus 관련 라이브러리 추가
	implementation 'io.micrometer:micrometer-registry-prometheus-simpleclient'
	implementation 'io.prometheus:simpleclient_pushgateway'
}

// ... 생략 ...- 파일 내용 중에 의존성 라이브러리를 확인해 보면 Spring batch 관련 라이브러리와 Prometheus 및 Pushgateway 라이브러리가 추가되어 있는것을 볼 수 있다.
- Prometheus 클라이언트의 Pushgateway 지원 문제로 인하여,
io.micrometer:micrometer-registry-prometheus대신에io.micrometer:micrometer-registry-prometheus-simpleclient를 추가해야한다.
- Prometheus 클라이언트의 Pushgateway 지원 문제로 인하여,
💡 Supported Monitoring Systems - Spring Boot 3.4.1
- Prometheus Pushgateway는 현재 Prometheus simpleclient만 지원하며, 이는 Prometheus 1.x 클라이언트가 Pushgateway 지원을 추가할 때까지 지속된다.
- simpleclient로 전환하려면, 프로젝트에서
io.micrometer:micrometer-registry-prometheus를 제거하고 대신io.micrometer:micrometer-registry-prometheus-simpleclient를 추가해야한다.
Prometheus - Pushgateway 설정
/src/main/resources/application.yml
prometheus:
  push:
    rate: 5000 # prometheus에 push 주기 (5초)
  job:
    name: batch_server_scrape # prometheus에서 인식할 pushgateway job 이름
  grouping:
    key: appname
  pushgateway:
url: localhost:9091 # pushgateway 주소- 설정한 Prometheus 설정값을 설정 파일에 반영한다.
../config/PrometheusConfig.java
@Slf4j
@Configuration
public class PrometheusConfig {

    @Value("${prometheus.job.name}")
    private String prometheusJobName;

    @Value("${prometheus.grouping.key}")
    private String prometheusGroupingKey;

    @Value("${prometheus.pushgateway.url}")
    private String prometheusPushGatewayUrl;

    private Map<String, String> groupingKey = new HashMap<>();

    private PushGateway pushGateway;

    private CollectorRegistry collectorRegistry;

    @PostConstruct
    public void init() {
        pushGateway = new PushGateway(prometheusPushGatewayUrl);
        groupingKey.put(prometheusGroupingKey, prometheusJobName);
        PrometheusMeterRegistry prometheusMeterRegistry = new PrometheusMeterRegistry(DEFAULT);
        collectorRegistry = prometheusMeterRegistry.getPrometheusRegistry();
        Metrics.globalRegistry.add(prometheusMeterRegistry);
    }

    @Scheduled(fixedRateString = "${prometheus.push.rate}")
    public void pushMetrics() {
        try {
            pushGateway.pushAdd(collectorRegistry, prometheusJobName, groupingKey);
        }
        catch (Throwable ex) {
        }
    }

}
Pushgateway + Prometheus + Grafana 서버를 Docker 로 실행
- Docker 로 Pushgateway + Prometheus + Grafana 서버를 띄우기 위해
docker-compose.yml를 만들고, Prometheus 설정을 해보도록 하겠다.
docker-compose.yml
services:

  pushgateway:
    image: prom/pushgateway
    container_name: 'pushgateway'
    ports:
      - '9091:9091'

  prometheus:
    image: prom/prometheus
    container_name: 'prometheus'
    ports:
      - '9090:9090'
    volumes:
      - ./docker-prometheus.yml:/etc/prometheus/prometheus.yml

  grafana:
    image: grafana/grafana
    container_name: 'grafana'
    user: "$UID:$GID"
    ports:
      - '3000:3000'
    volumes:
      - ./grafana-data:/var/lib/grafana
    depends_on:
      - prometheus
prometheus.yml 설정 파일
global:
  scrape_interval:     5s
  evaluation_interval: 5s

scrape_configs:
  - job_name: 'batch_server_scrape'
    honor_labels: true
    static_configs:
- targets: ['host.docker.internal:9091'] # pushgateway- 테스트 환경이 macOS여서 pushgateway의 URL을
host.docker.internal:9010으로 기입했는데, linux 등을 다를 수 있다. 테스트 환경에 맞게 URL를 기입하도록 한다.
Docker 실행
% docker-compose up -d- 설정한 docker compose 를 실행한다.
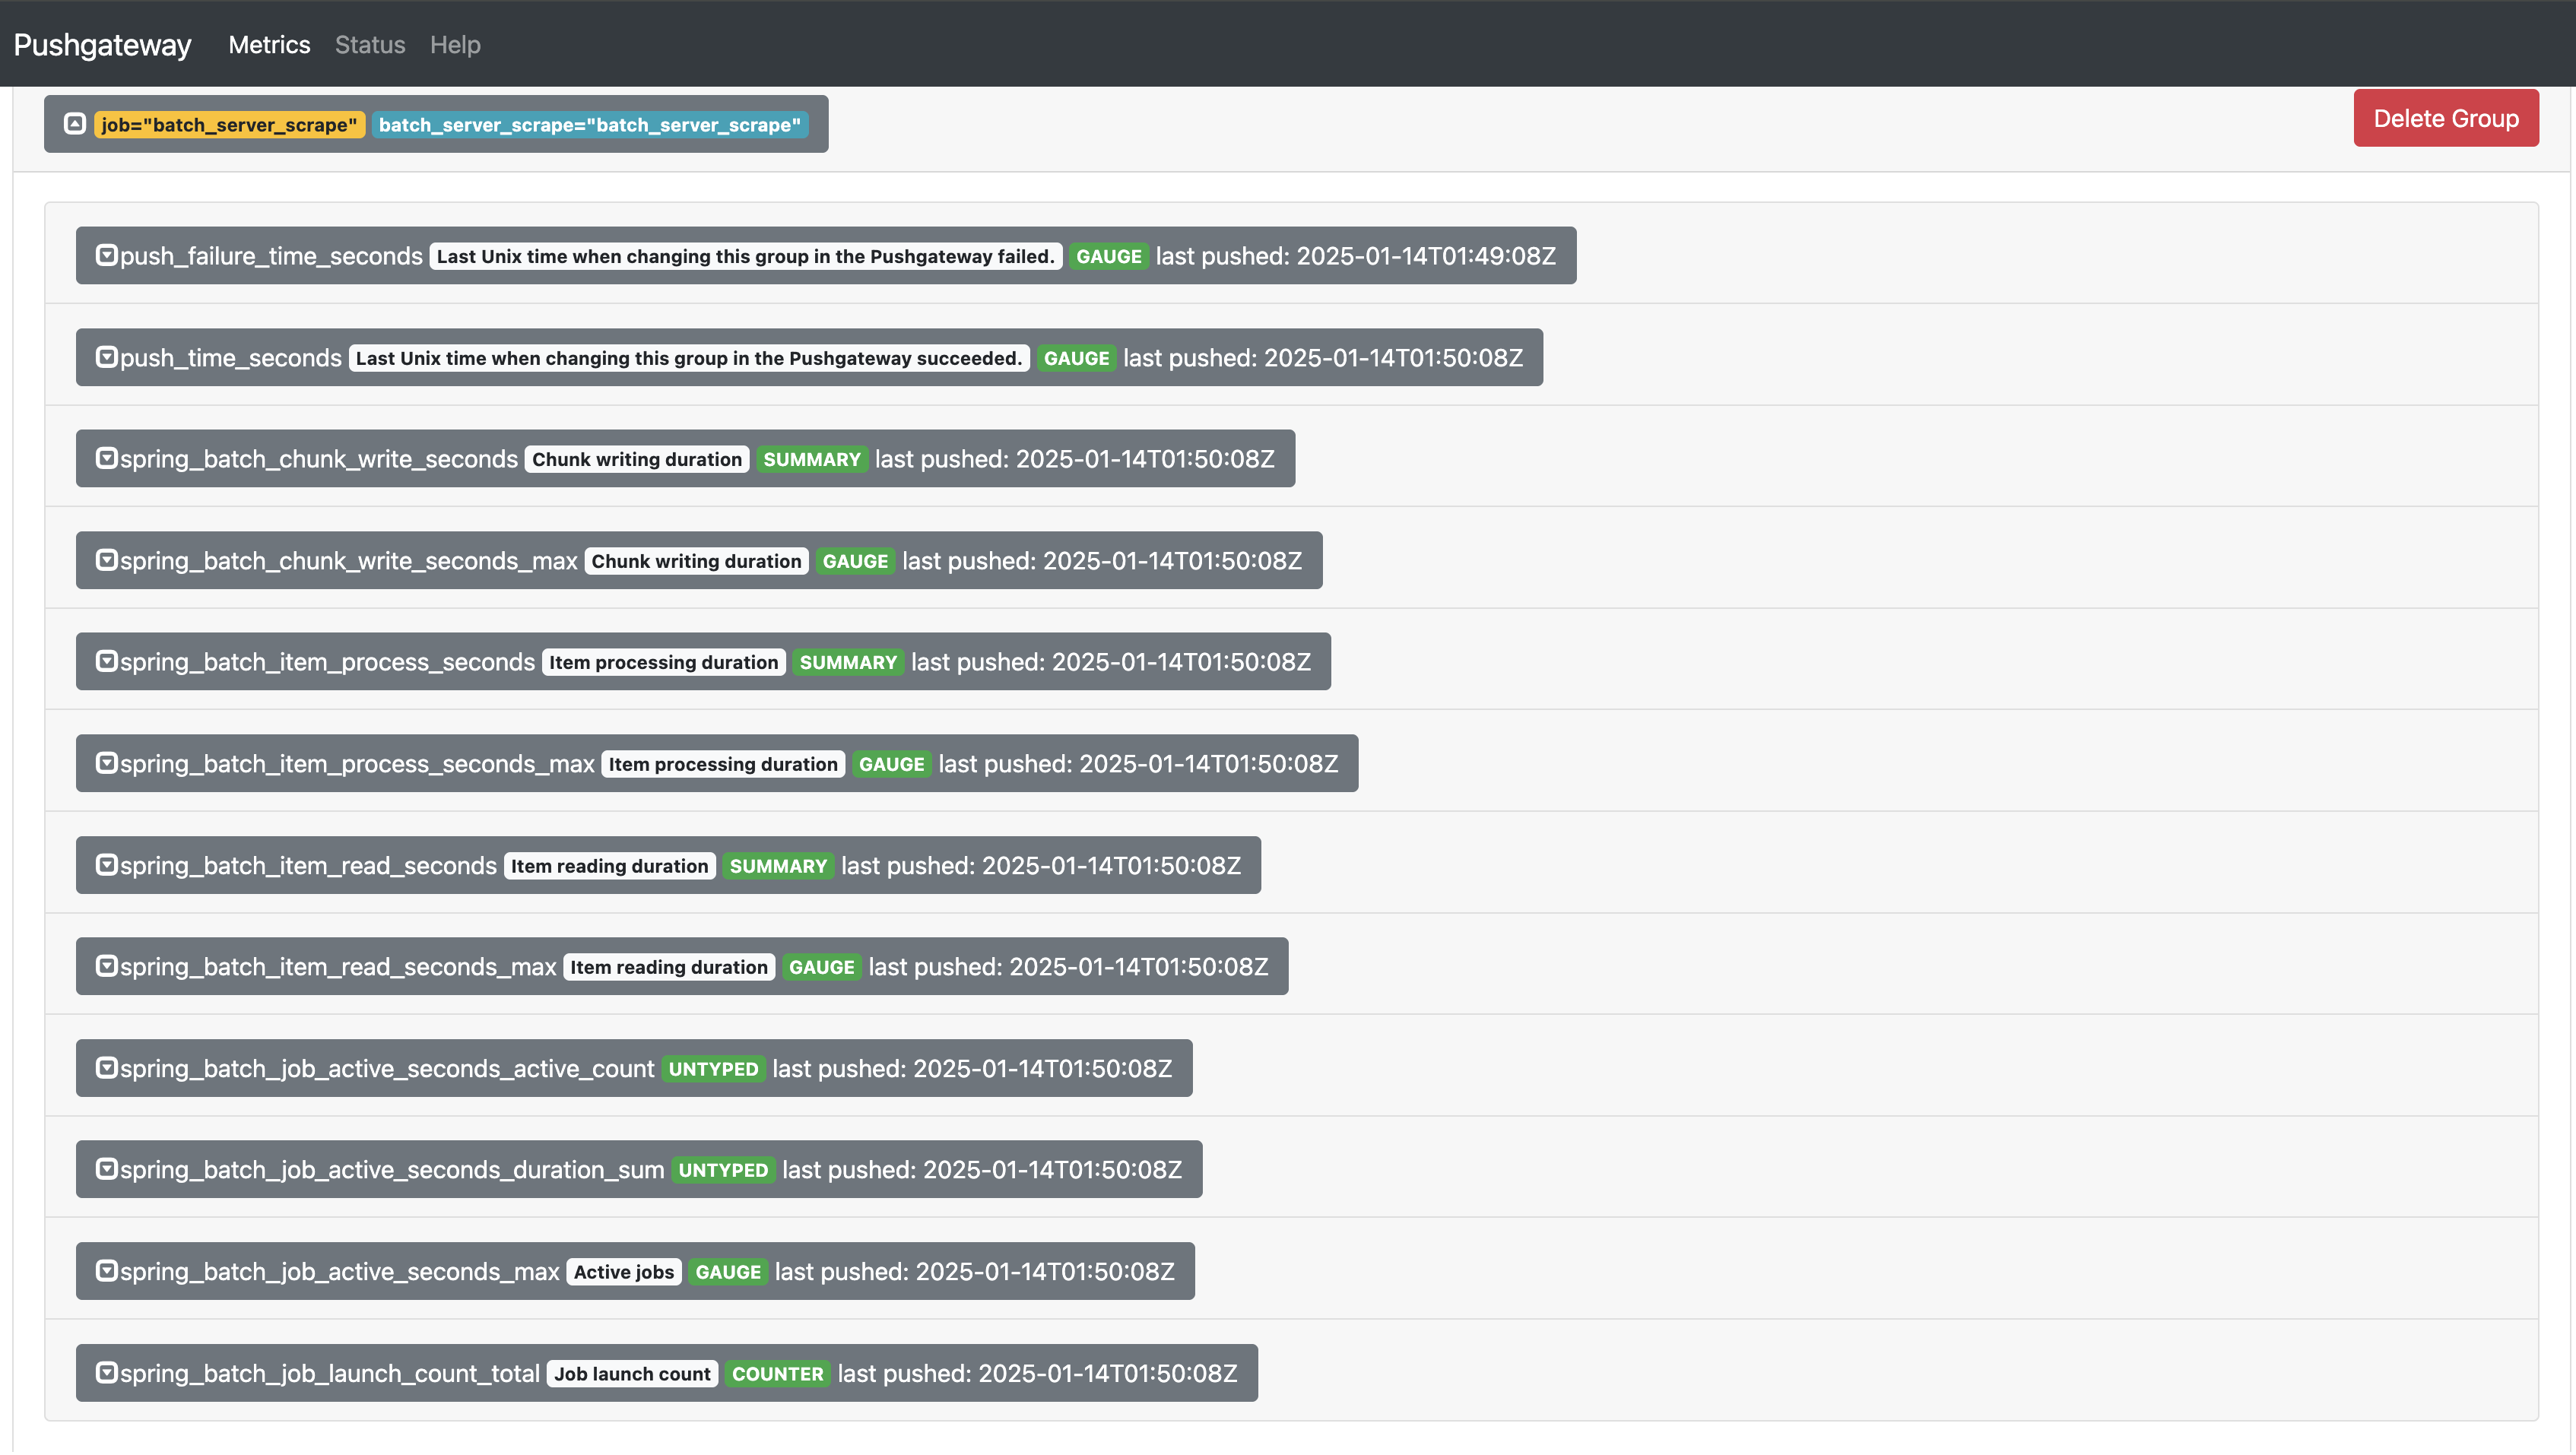
Pushgateway 수집 정보 확인
- Pushgateway(http://localhost:9091)에 접속해 보면 spring-batch에서 수집된 정보를 확인할 수 있다.
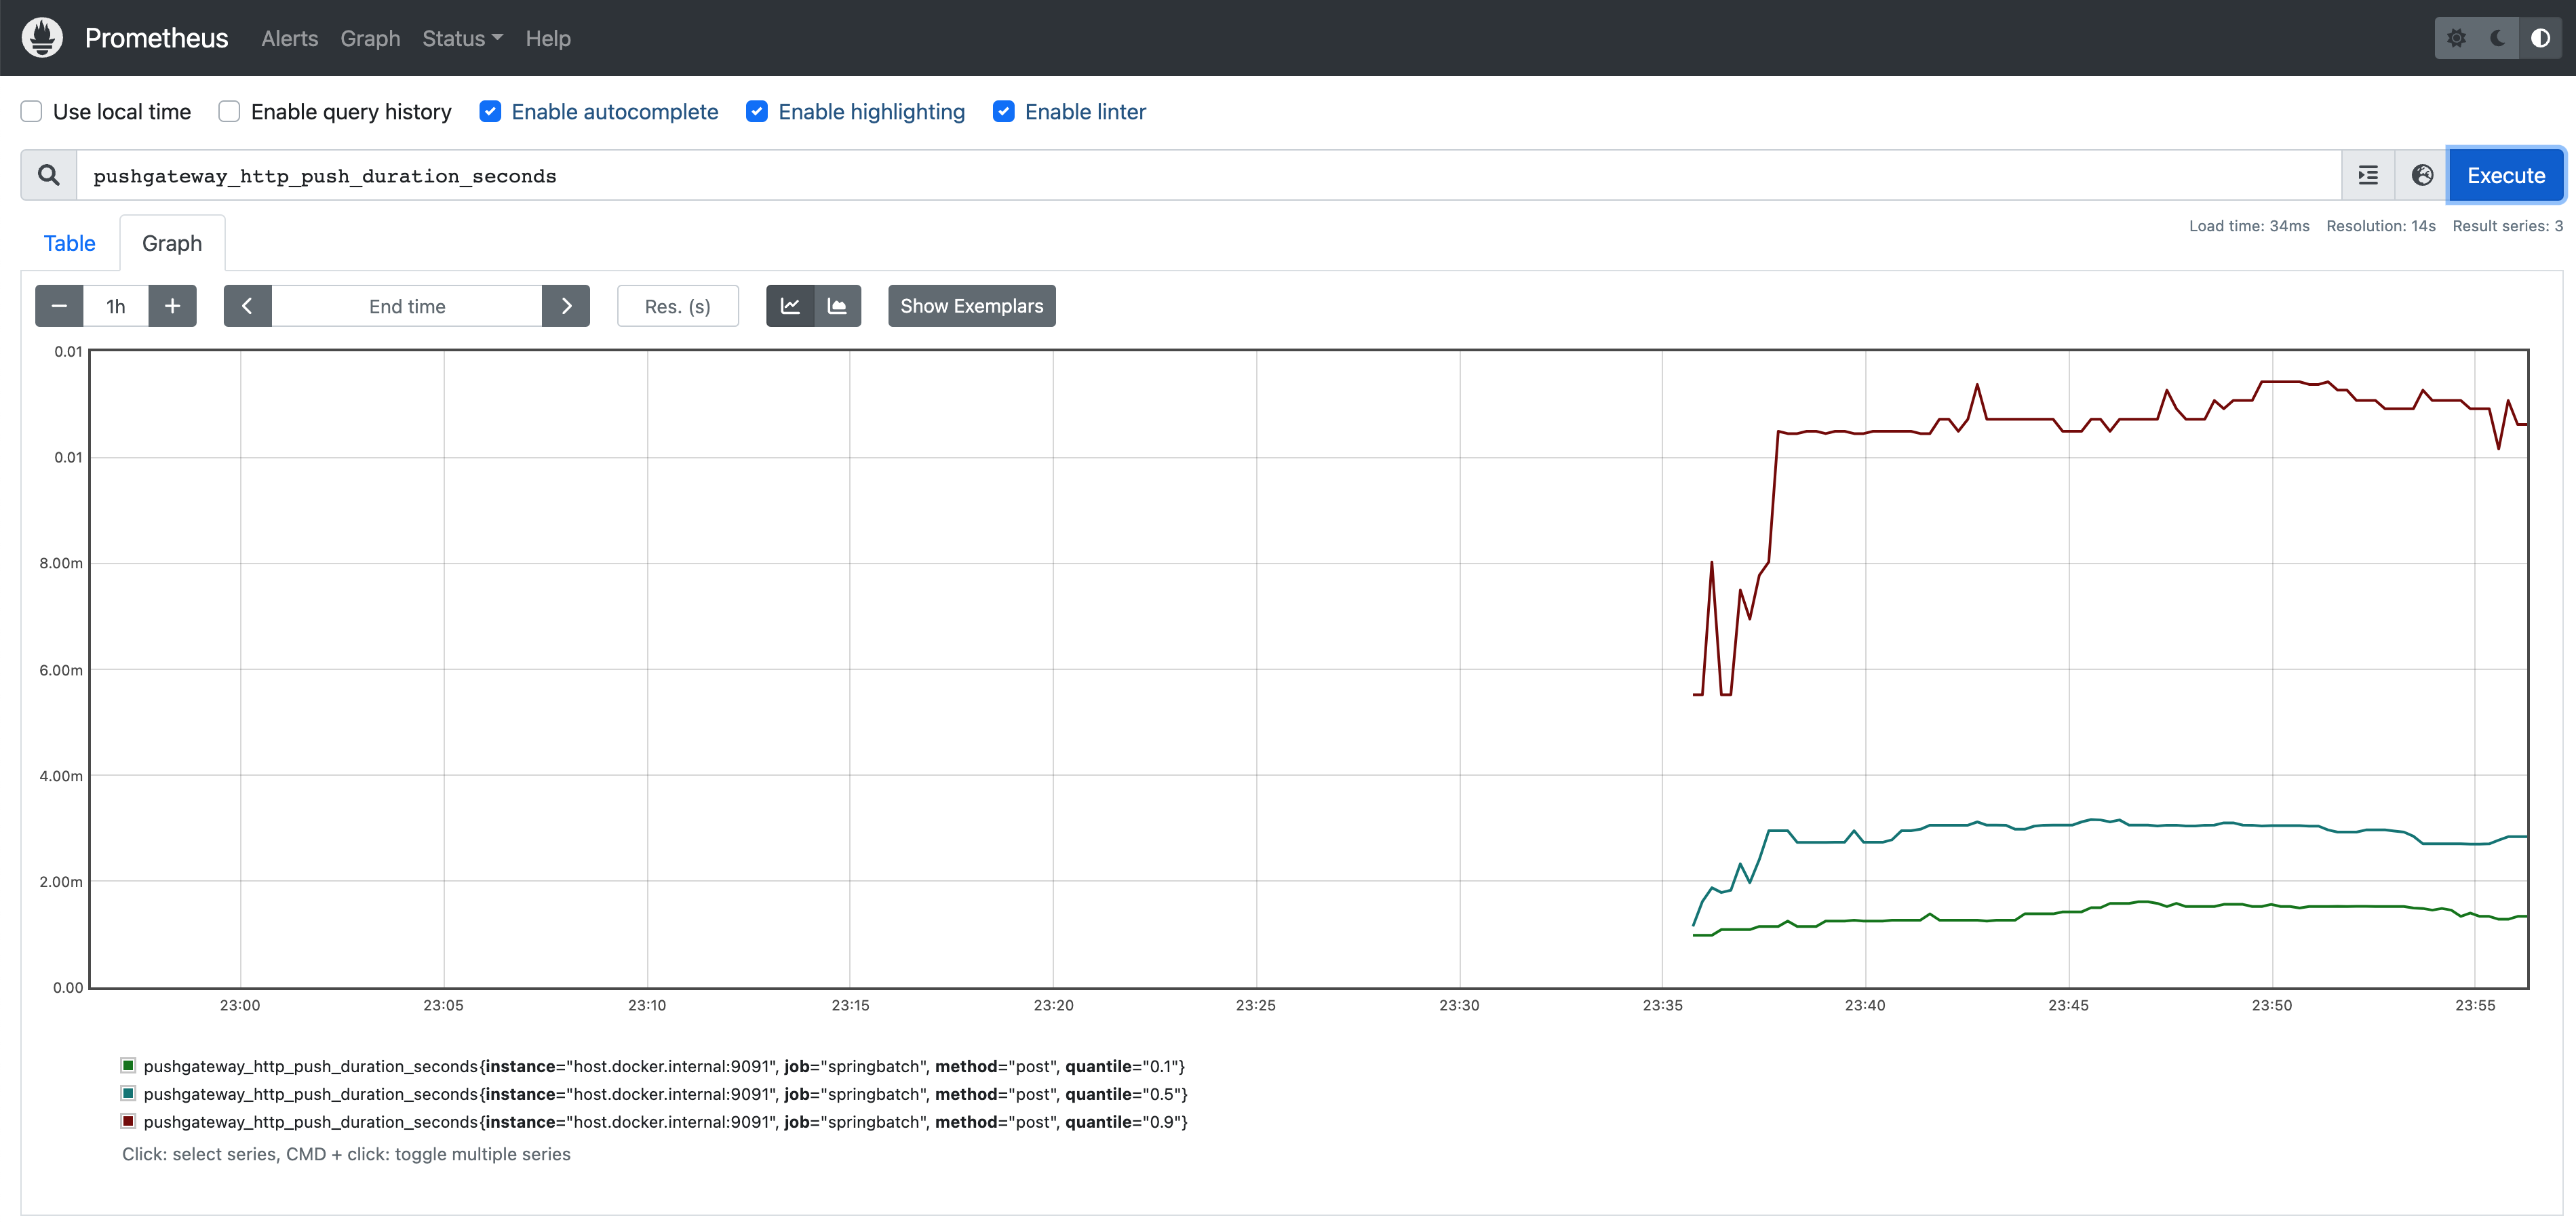
Prometheus 수집 정보 확인
- Prometheus(http://localhost:9090)에 접속해 보면 Pushgateway을 통해서 전달 받은 spring-batch에서 수집된 정보를 확인할 수 있다.
Grafana Dashboard 설정
- spring-batch에서 수집된 정보를 Grafana을 통해서 좀 더 시각적으로 표시해 보겠다.
Grafana 데이터 소스 설정
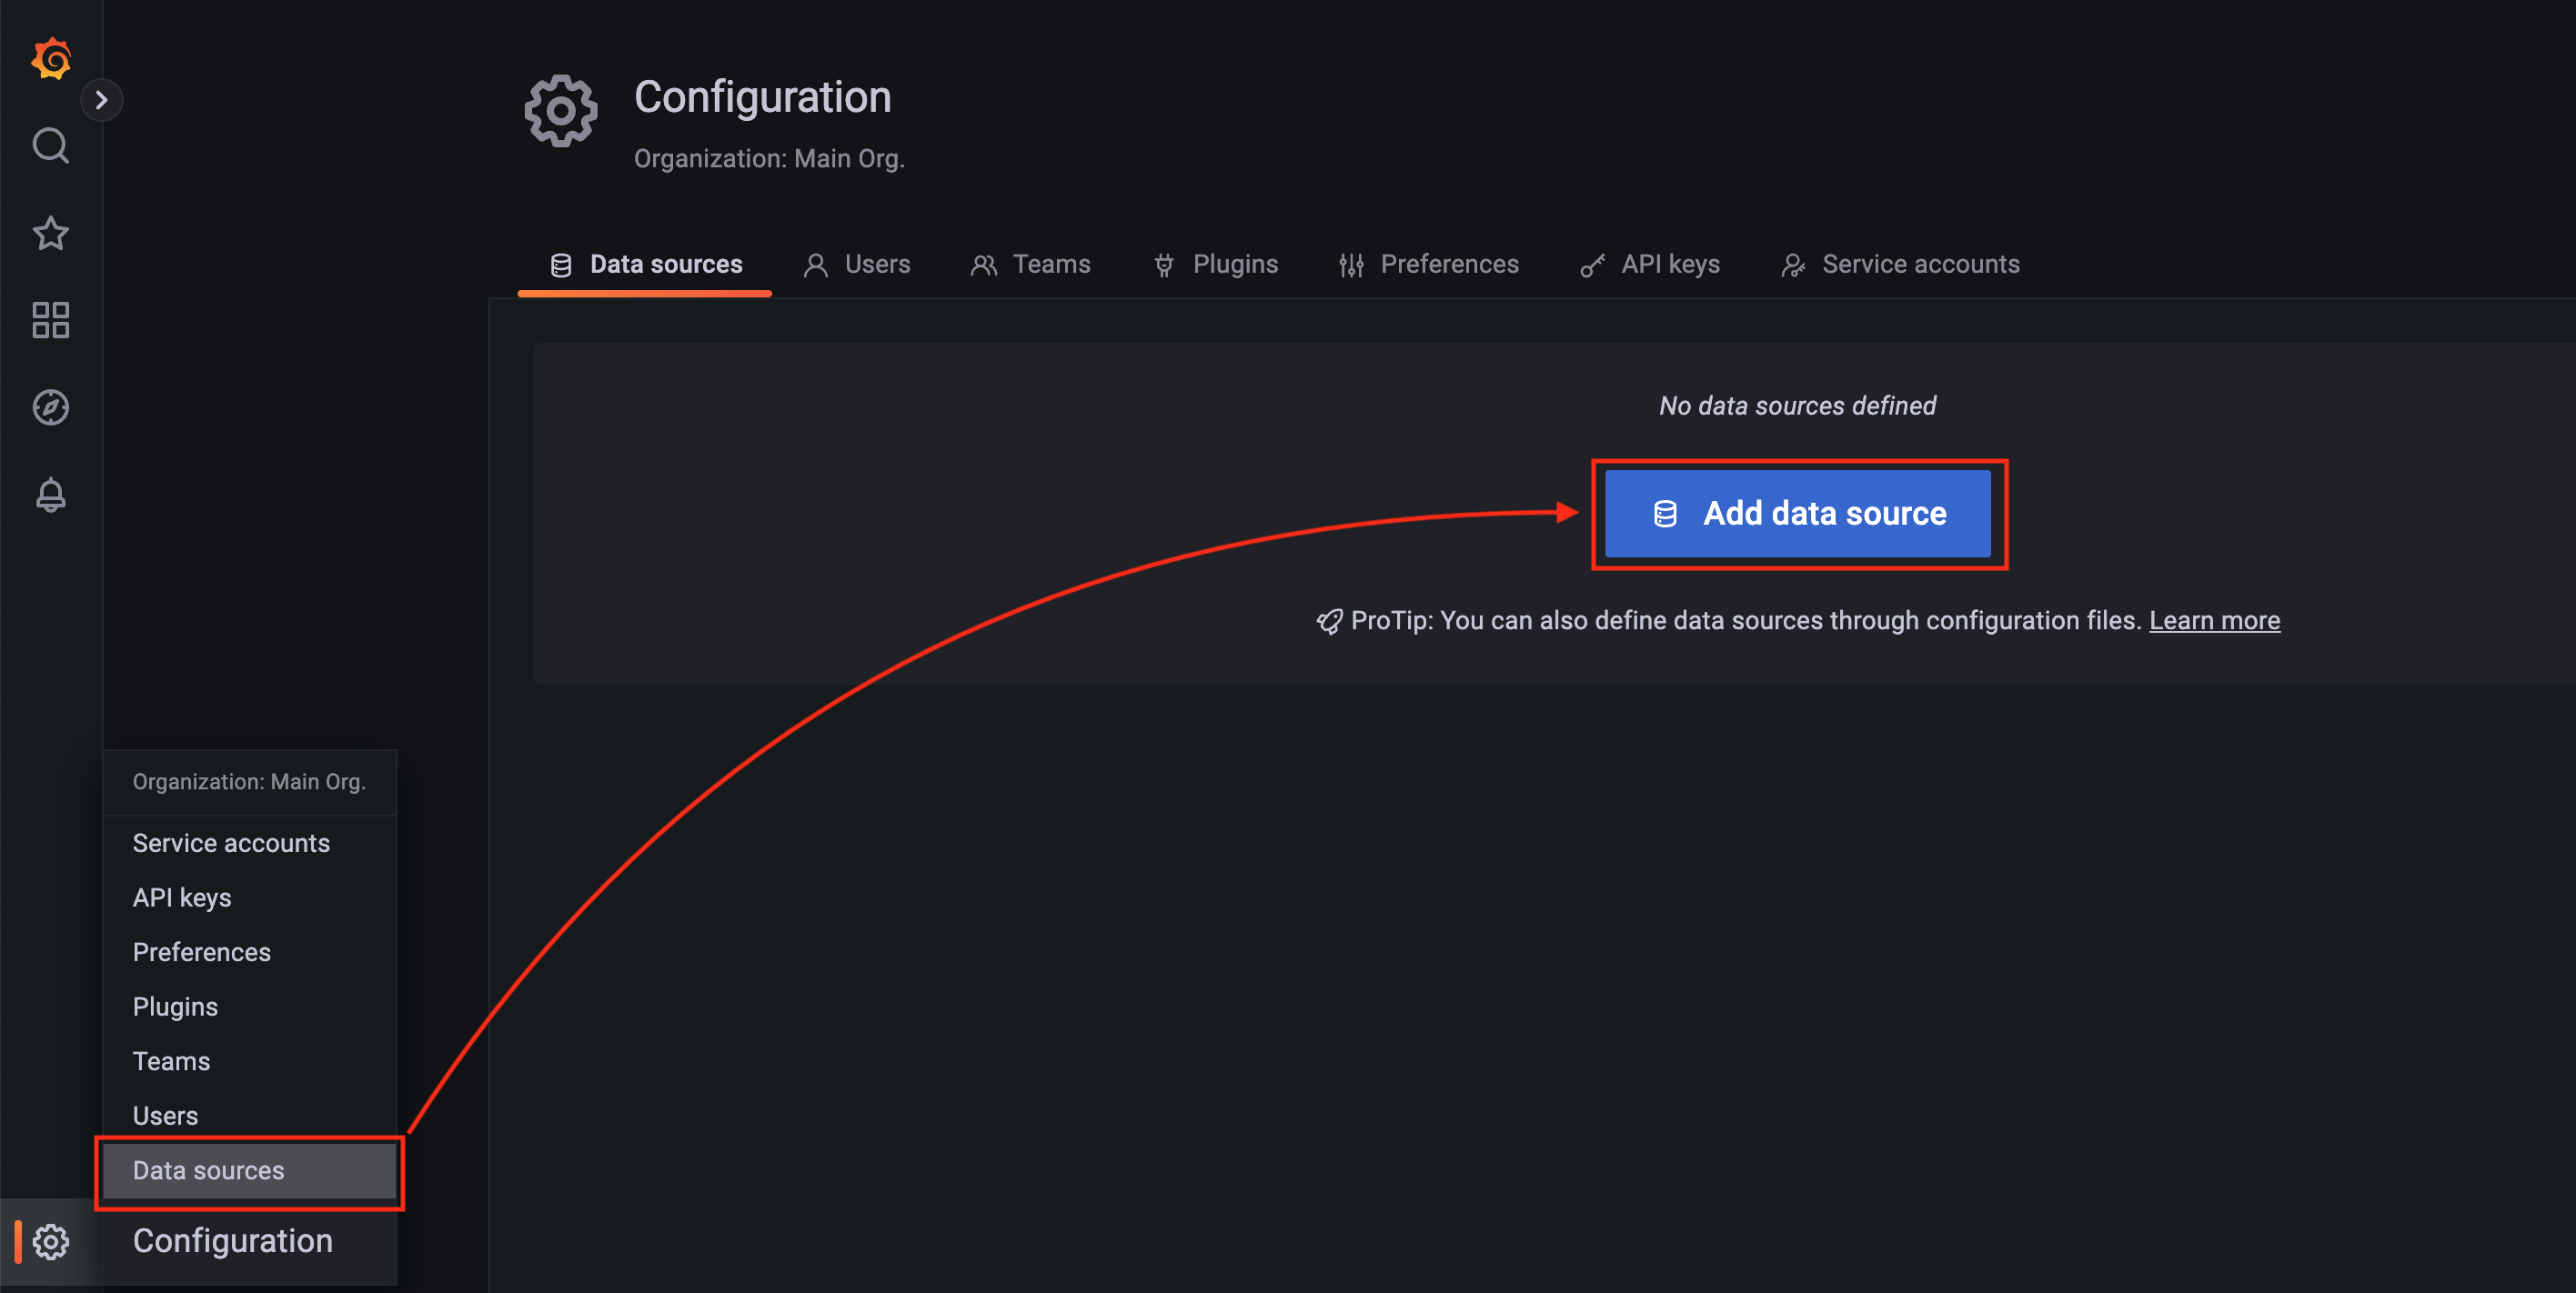
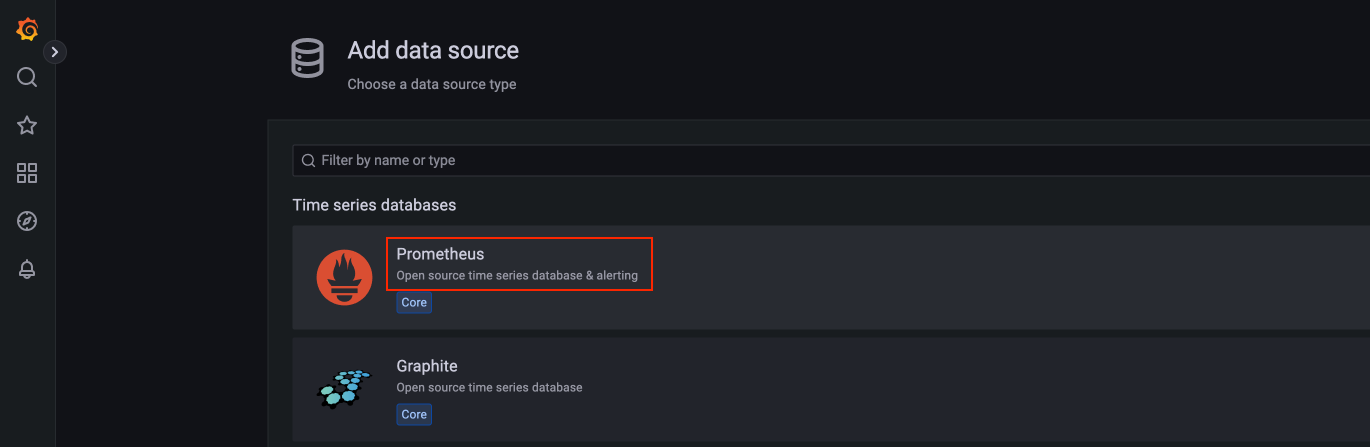
- 데이터 소스로 “Promethues"을 선택한다.
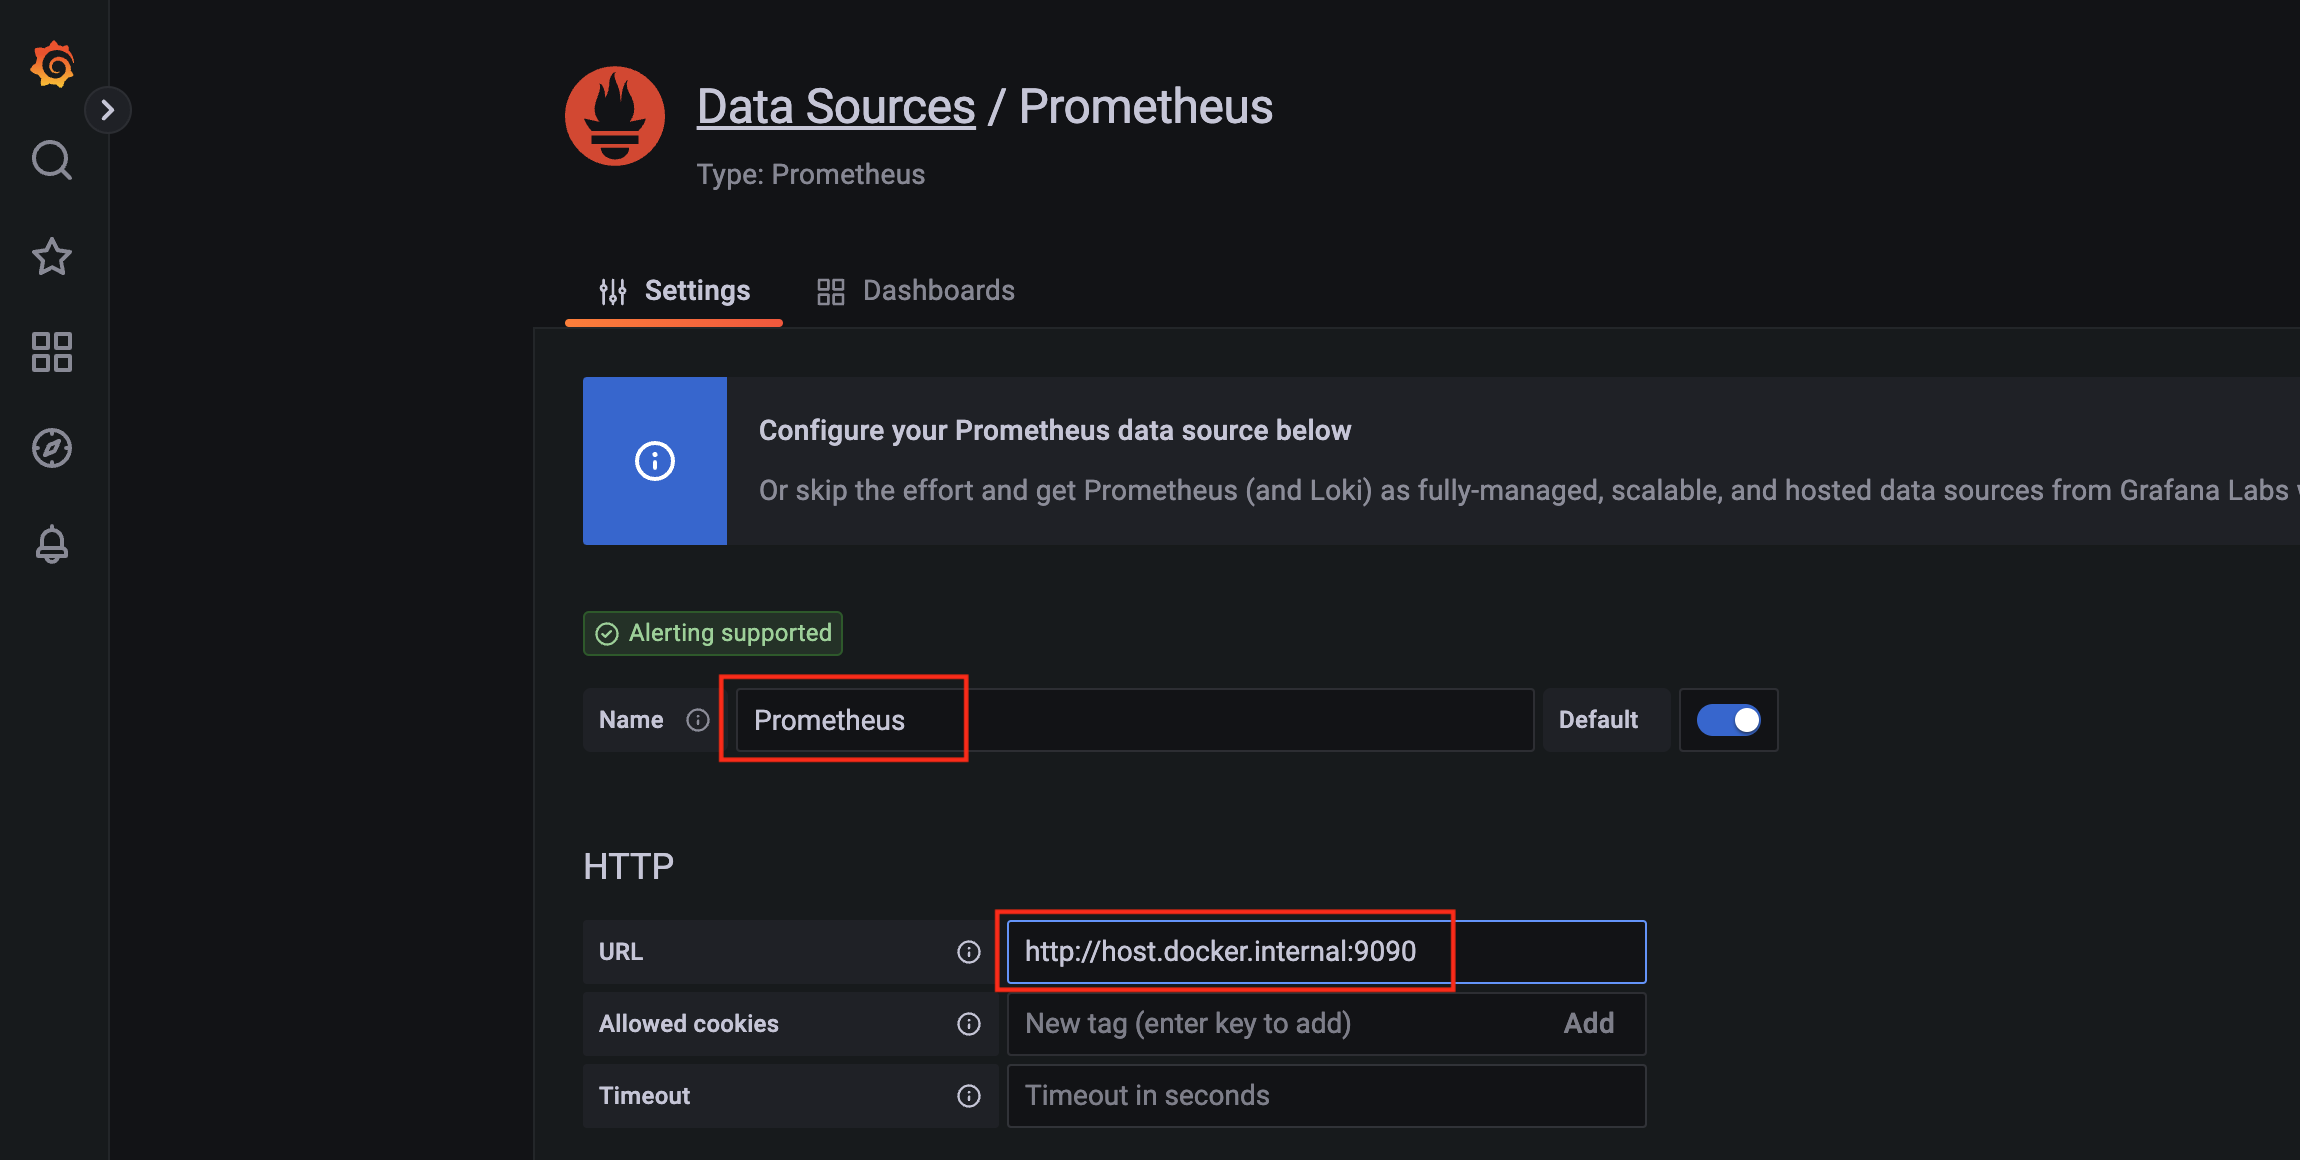
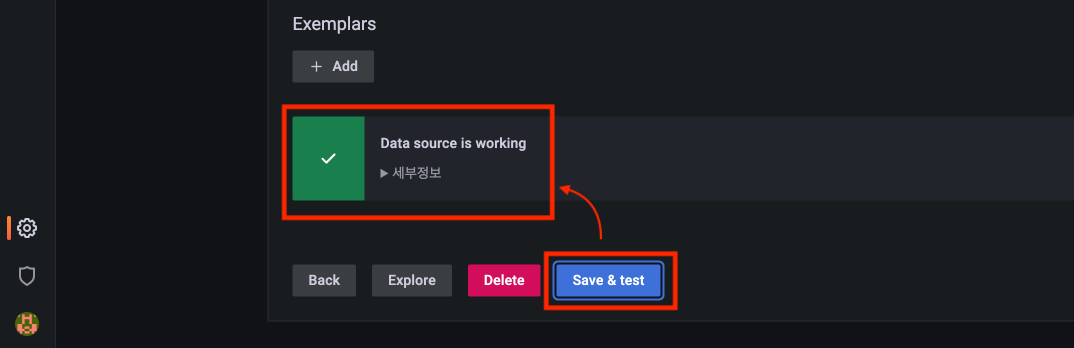
- Promethues의 Data Source 소스를 추가 화면이 나오면, “Name”, “URL"를 입력한다.
(여기서는 구현 환경이 macOS이어서 URL에는 “http://host.docker.internal:9090"을 입력하였으나, Linux 환경 등에서는 다를 수 있으니 주의바란다.) - Name 을 “Prometheus” 로 맞춰주어야 한다. → 추후 사용할 Dashboard 와 호환되도록 하기 위해서
Grafana Dashboard 설정 및 확인
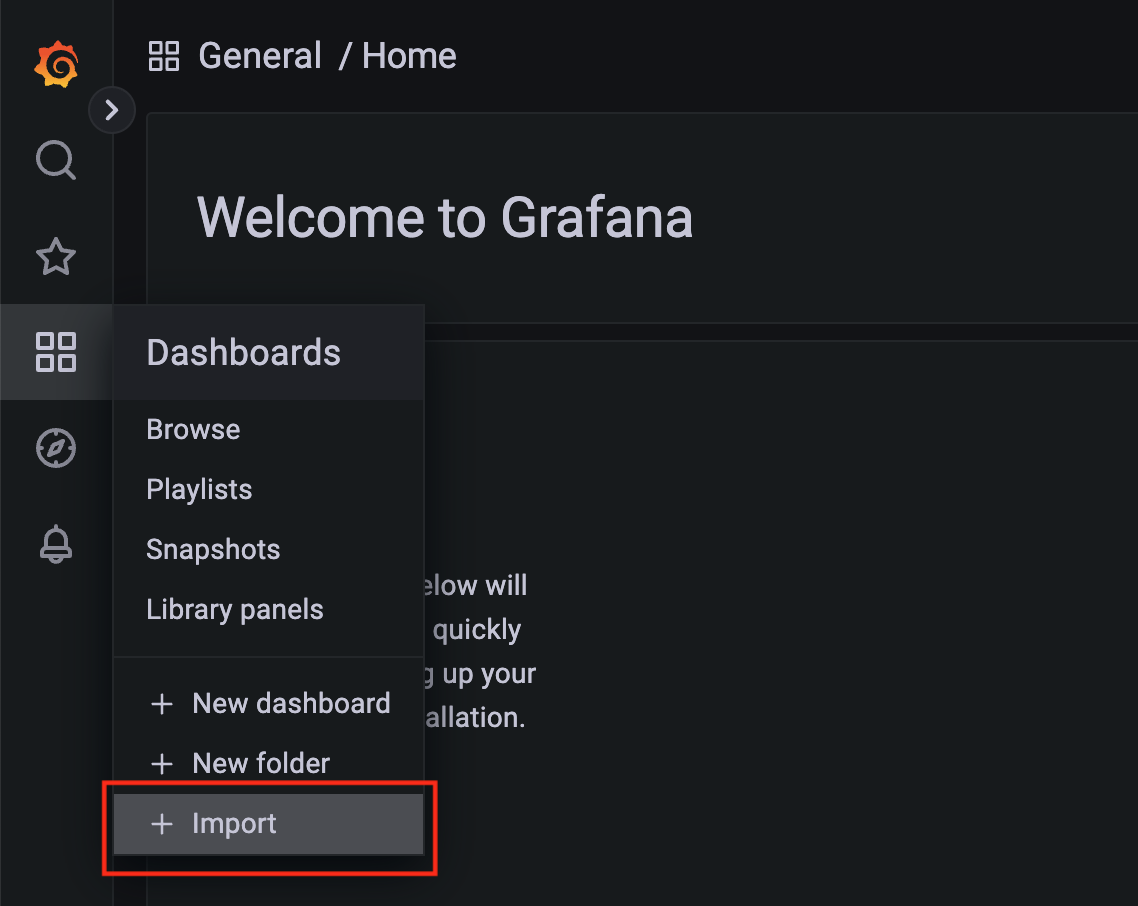
- 이어서 대시보드를 설정을 “Import"으로 추가한다.
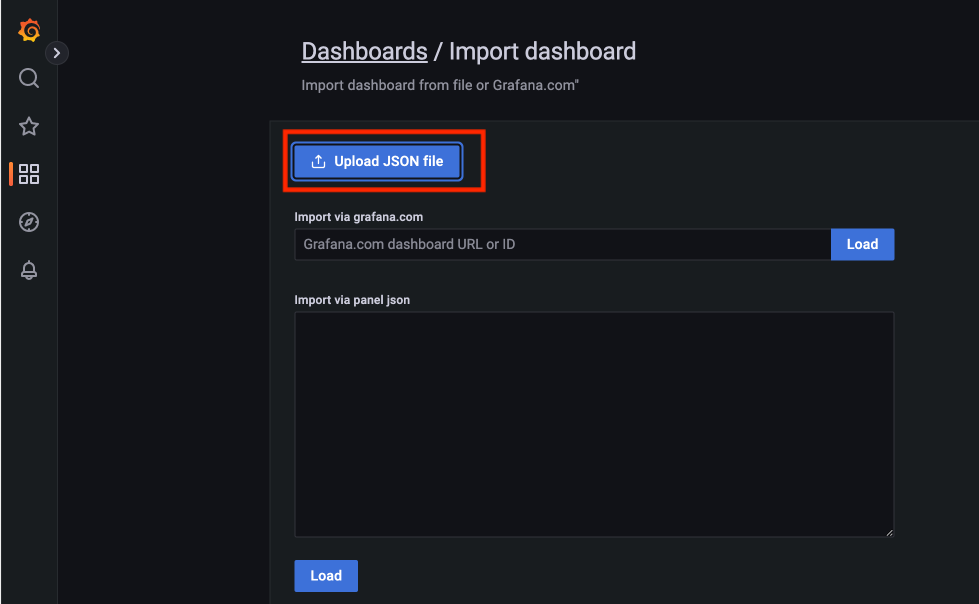
- 준비된 grafana dashboard Json 파일(spring-batch-dashboard.json)을 선택한다.
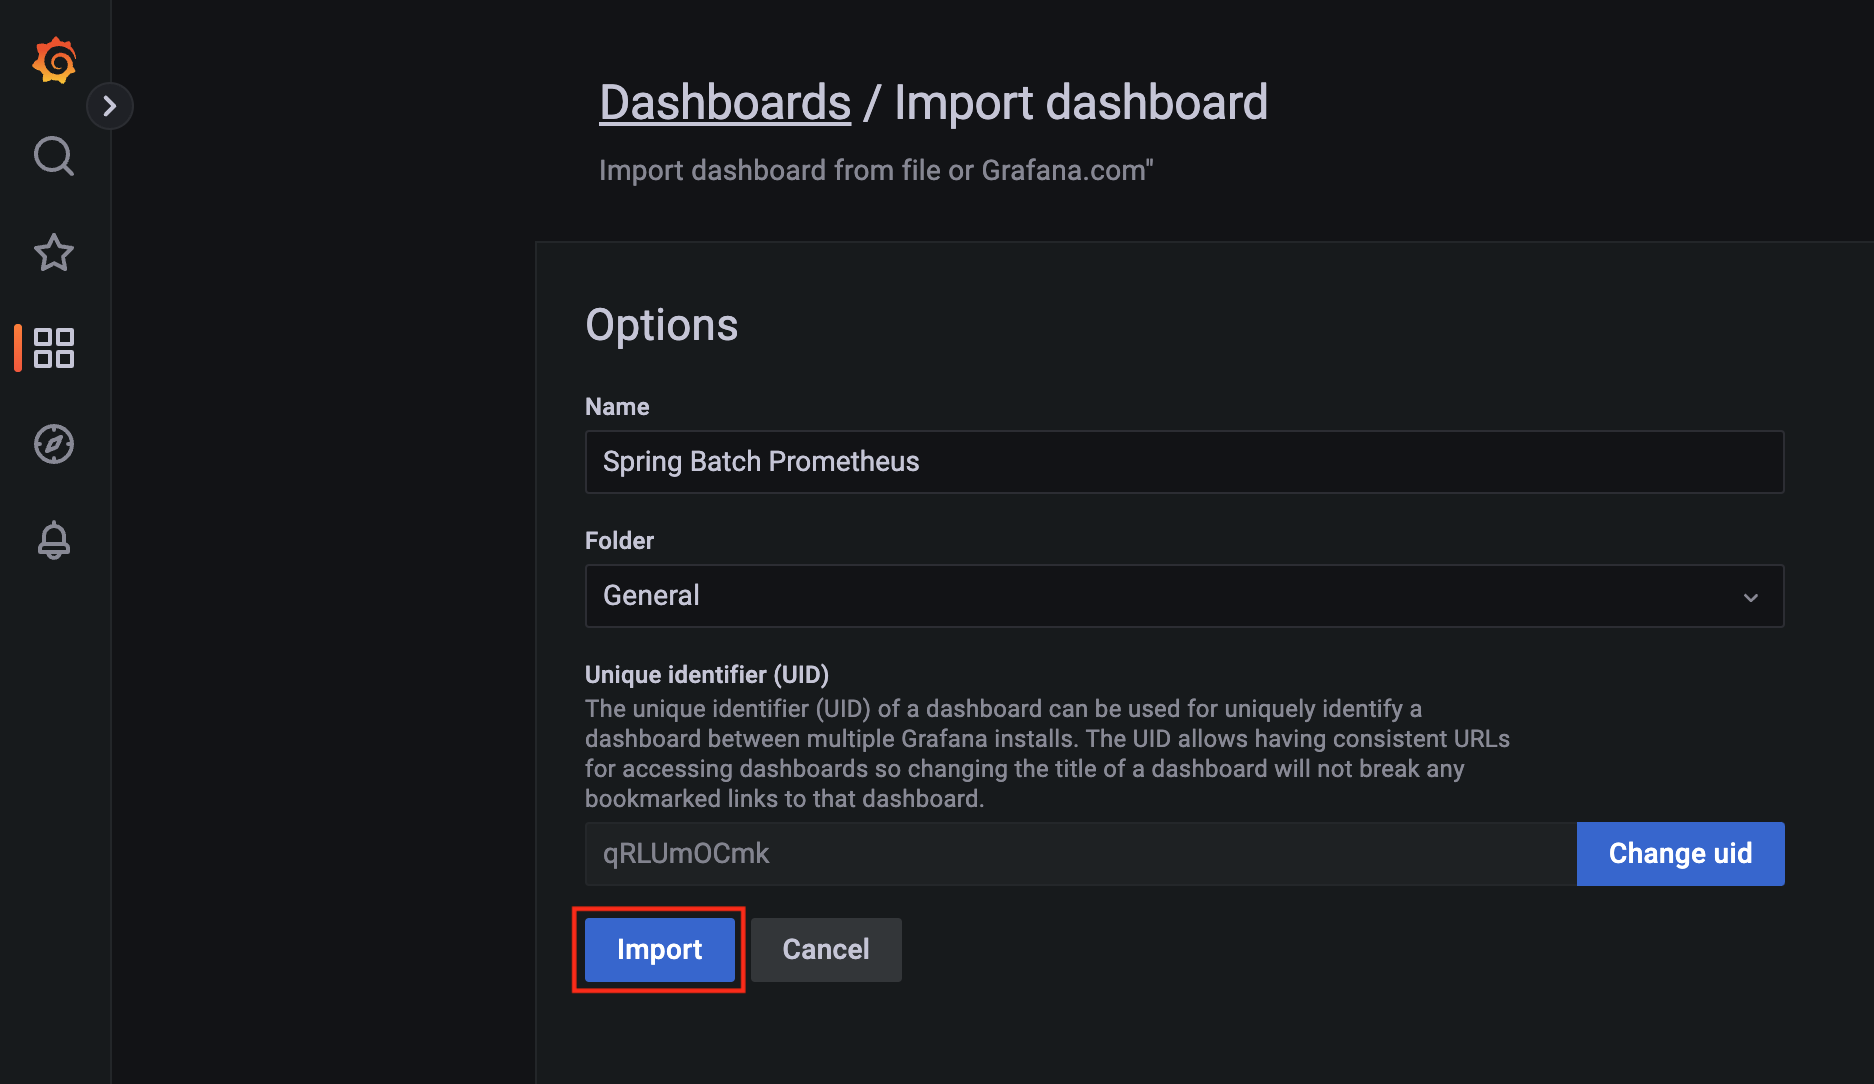
- 내용을 확인하고, “Import"을 클릭한다.
최종 Spring Batch - Grafana 모니터링 화면
- 이제 대시 보드 화면으로 이동하면 sprinb-batch 메트릭 정보가 그래프로 보이는 것을 확인할 수 있다.

소통을 중요하게 여기며, 정보의 공유를 통해 완전한 학습을 이루어 냅니다.