
출처
제목: "CloudWatch 이상 지표를 슬랙 알람으로 받기 (feat. SNS, Lambda)"
작성자: tistory(jojoldu)
작성자 수정일: 2021년7월17일
링크: https://jojoldu.tistory.com/586
작성일: 2022년7월5일
글 작성 계기
- 서비스 개발을 진행하던 중, 비즈니스 로직이 돌아가는 코드에서는 에러가 발생하였을 때, 슬랙으로 알람을 보내도록 설정해놓았는데, 중요한 데이터가 저장된 DB 서버에 문제가 생겨버리면 답이 없는? 상황이 발생할 것 같아서 서치하던 중, 향로님의 글을 보고 작성하게 되었다.
AWS 서비스를 이용하면 cloudWatch를 통해 서비스의 이상 지표를 손쉽게 확인할 수 있다. 예를 들면
- 평소보다 로드밸런서로 들어오는 요청양이 2배이상 높다거나
- RDS의 CPU가 60% 이상이 된다거나
- RDS에 사용중인 Connection이 갑자기 줄어든다거나
등등의 경우가 있다.
그래서 위와 같은 이상 지표가 발생하면 즉시 Slack 등 메신저를 통해 알람을 받아야만 한다.
AWS에서는 SNS와 Lambda를 통해 CloudWatch의 이상 지표를 손쉽게 알람을 받을 수 있다.

이번 시간에는 CloudWatch와 SNS, Lambda를 활용해 이상 지표 알람 서비스를 만들어보자
1. SNS 토픽 생성
제일 먼저 SNS 주제(Topic)을 생성한다.
아래 그림을 따라 차례로 진행한다.
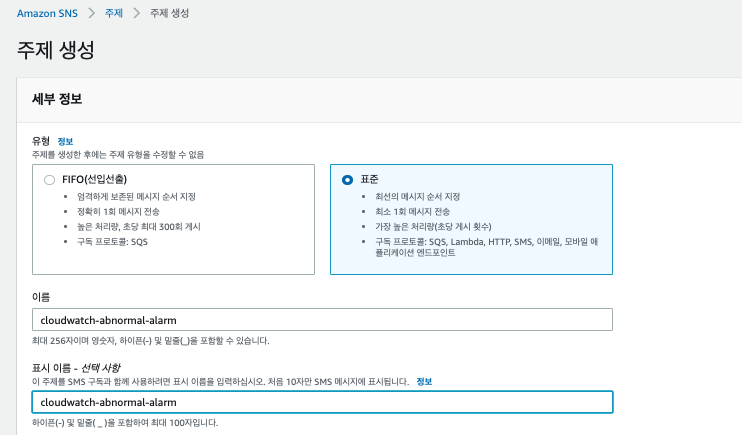
이렇게 만들어진 SNS는 바로 Lambda와 연결된다.
2. Lambda 함수 생성
두번째로 Lambda를 생성해보자
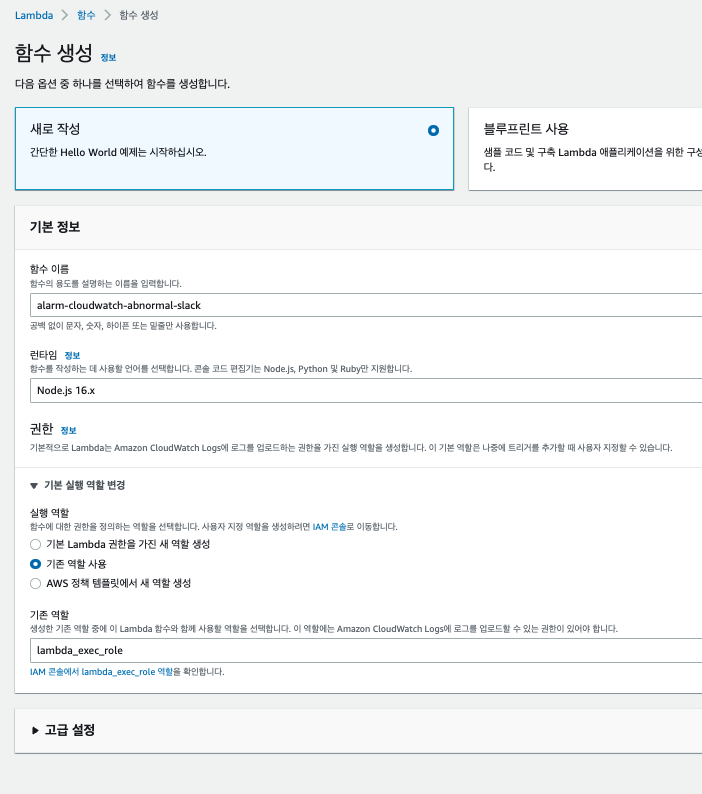
기본적인 Lambda 설정 후, 실제 SNS 메시지를 분해해서 Slack으로 메세지를 보내는 코드를 작성해보자.
2-1. Lambda 함수 코드 추가
전체 코드는 다음과 같다.
// 구성 -> 환경변수로 webhook을 받도록 합니다.
const ENV = process.env
if (!ENV.webhook) throw new Error('Missing environment variable: webhook')

const webhook = ENV.webhook;
const https = require('https')

const statusColorsAndMessage = {
    ALARM: {"color": "danger", "message":"위험"},
    INSUFFICIENT_DATA: {"color": "warning", "message":"데이터 부족"},
    OK: {"color": "good", "message":"정상"}
}

const comparisonOperator = {
    "GreaterThanOrEqualToThreshold": ">=",
    "GreaterThanThreshold": ">",
    "LowerThanOrEqualToThreshold": "<=",
    "LessThanThreshold": "<",
}

exports.handler = async (event) => {
    await exports.processEvent(event);
}

exports.processEvent = async (event) => {
    console.log('Event:', JSON.stringify(event))
    const snsMessage = event.Records[0].Sns.Message;
    console.log('SNS Message:', snsMessage);
    const postData = exports.buildSlackMessage(JSON.parse(snsMessage))
    await exports.postSlack(postData, webhook);
}

exports.buildSlackMessage = (data) => {
    const newState = statusColorsAndMessage[data.NewStateValue];
    const oldState = statusColorsAndMessage[data.OldStateValue];
    const executeTime = exports.toYyyymmddhhmmss(data.StateChangeTime);
    const description = data.AlarmDescription;
    const cause = exports.getCause(data);

    return {
        attachments: [
            {
                title: `[${data.AlarmName}]`,
                color: newState.color,
                fields: [
                    {
                        title: '언제',
                        value: executeTime
                    },
                    {
                        title: '설명',
                        value: description
                    },
                    {
                        title: '원인',
                        value: cause
                    },
                    {
                        title: '이전 상태',
                        value: oldState.message,
                        short: true
                    },
                    {
                        title: '현재 상태',
                        value: `*${newState.message}*`,
                        short: true
                    },
                    {
                        title: '바로가기',
                        value: exports.createLink(data)
                    }
                ]
            }
        ]
    }
}

// CloudWatch 알람 바로 가기 링크
exports.createLink = (data) => {
    return `https://console.aws.amazon.com/cloudwatch/home?region=${exports.exportRegionCode(data.AlarmArn)}#alarm:alarmFilter=ANY;name=${encodeURIComponent(data.AlarmName)}`;
}

exports.exportRegionCode = (arn) => {
    return  arn.replace("arn:aws:cloudwatch:", "").split(":")[0];
}

exports.getCause = (data) => {
    const trigger = data.Trigger;
    const evaluationPeriods = trigger.EvaluationPeriods;
    const minutes = Math.floor(trigger.Period / 60);

    if(data.Trigger.Metrics) {
        return exports.buildAnomalyDetectionBand(data, evaluationPeriods, minutes);
    }

    return exports.buildThresholdMessage(data, evaluationPeriods, minutes);
}

// 이상 지표 중 Band를 벗어나는 경우
exports.buildAnomalyDetectionBand = (data, evaluationPeriods, minutes) => {
    const metrics = data.Trigger.Metrics;
    const metric = metrics.find(metric => metric.Id === 'm1').MetricStat.Metric.MetricName;
    const expression = metrics.find(metric => metric.Id === 'ad1').Expression;
    const width = expression.split(',')[1].replace(')', '').trim();

    return `${evaluationPeriods * minutes} 분 동안 ${evaluationPeriods} 회 ${metric} 지표가 범위(약 ${width}배)를 벗어났습니다.`;
}

// 이상 지표 중 Threshold 벗어나는 경우
exports.buildThresholdMessage = (data, evaluationPeriods, minutes) => {
    const trigger = data.Trigger;
    const threshold = trigger.Threshold;
    const metric = trigger.MetricName;
    const operator = comparisonOperator[trigger.ComparisonOperator];

    return `${evaluationPeriods * minutes} 분 동안 ${evaluationPeriods} 회 ${metric} ${operator} ${threshold}`;
}

// 타임존 UTC -> KST
exports.toYyyymmddhhmmss = (timeString) => {

    if(!timeString){
        return '';
    }

    const kstDate = new Date(new Date(timeString).getTime() + 32400000);

    function pad2(n) { return n < 10 ? '0' + n : n }

    return kstDate.getFullYear().toString()
        + '-'+ pad2(kstDate.getMonth() + 1)
        + '-'+ pad2(kstDate.getDate())
        + ' '+ pad2(kstDate.getHours())
        + ':'+ pad2(kstDate.getMinutes())
        + ':'+ pad2(kstDate.getSeconds());
}

exports.postSlack = async (message, slackUrl) => {
    return await request(exports.options(slackUrl), message);
}

exports.options = (slackUrl) => {
    const {host, pathname} = new URL(slackUrl);
    return {
        hostname: host,
        path: pathname,
        method: 'POST',
        headers: {
            'Content-Type': 'application/json'
        },
    };
}

function request(options, data) {

    return new Promise((resolve, reject) => {
        const req = https.request(options, (res) => {
            res.setEncoding('utf8');
            let responseBody = '';

            res.on('data', (chunk) => {
                responseBody += chunk;
            });

            res.on('end', () => {
                resolve(responseBody);
            });
        });

        req.on('error', (err) => {
            console.error(err);
            reject(err);
        });

        req.write(JSON.stringify(data));
        req.end();
    });
}
exports로 만든 function들은jest로 모두 테스트 코드를 작성해서 굳이 Lambda로 테스트를 안하더라도, 대부분이 기능을 빠르게 검증/수정하였다.
describe('index.js', () => {
it('file load', () => {
expect(testObject.AlarmName).toBe('RDS-CPUUtilization-high');
});
it('시간 변경', () => {
const time = '2021-07-14T23:20:50.708+0000';
const kstTime = toYyyymmddhhmmss(time);
expect(kstTime).toBe('2021-07-15 17:20:50');
});
it('region code 추출', () => {
const arn = "arn:aws:cloudwatch:ap-northeast-2:123123:alarm:Aurora PostgreSQL CPU 알람 (60%이상시)";
const result = exportRegionCode(arn);
expect(result).toBe('ap-northeast-2');
});
it('link', () => {
const result = createLink(testObject);
expect(result).toBe('https://console.aws.amazon.com/cloudwatch/home?region=ap-northeast-2#alarm:alarmFilter=ANY;name=Aurora%20PostgreSQL%20CPU%20%EC%95%8C%EB%9E%8C%20(60%25%EC%9D%B4%EC%83%81%EC%8B%9C)');
});
...
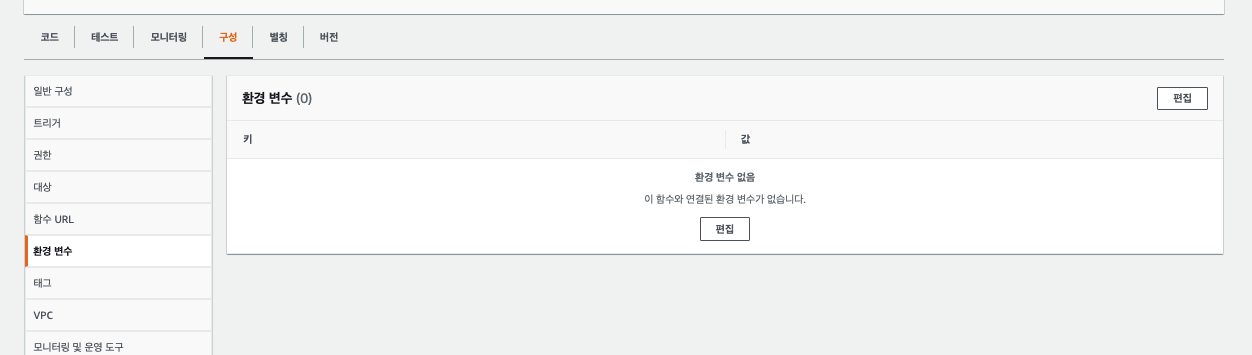
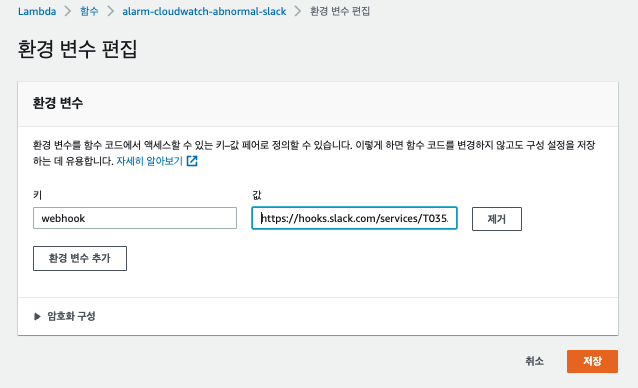
});작성된 Lambda를 실행하기 위해서는 Lambda 환경 변수에 webhook 값을 등록해야 한다.
const webhook = ENV.webhook; 에서 사용되는 값
환경 변수는 아래와 같이 구성-> 환경변수로 차례로 등록한다.
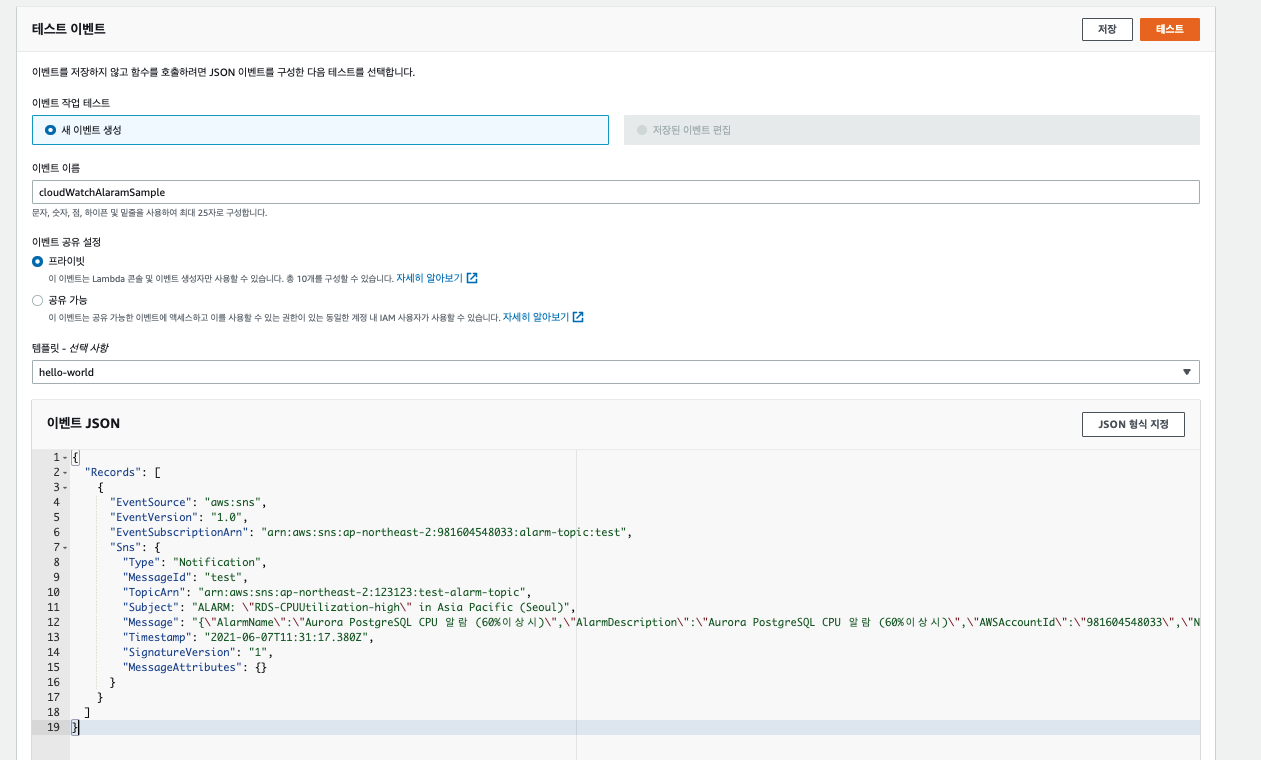
2-2. Lambda 테스트
작성된 Lambda 테스트를 위해서 SNS 메세지를 임의로 만들어보자.
{
  "Records": [
    {
      "EventSource": "aws:sns",
      "EventVersion": "1.0",
      "EventSubscriptionArn": "arn:aws:sns:ap-northeast-2:981604548033:alarm-topic:test",
      "Sns": {
        "Type": "Notification",
        "MessageId": "test",
        "TopicArn": "arn:aws:sns:ap-northeast-2:123123:test-alarm-topic",
        "Subject": "ALARM: \"RDS-CPUUtilization-high\" in Asia Pacific (Seoul)",
        "Message": "{\"AlarmName\":\"Aurora PostgreSQL CPU 알람 (60%이상시)\",\"AlarmDescription\":\"Aurora PostgreSQL CPU 알람 (60%이상시)\",\"AWSAccountId\":\"981604548033\",\"NewStateValue\":\"ALARM\",\"NewStateReason\":\"Threshold Crossed: 3 out of the last 3 datapoints [8.891518474692088 (14/07/21 23:18:00), 9.72 (14/07/21 23:17:00), 9.18241509182415 (14/07/21 23:16:00)] were greater than or equal to the threshold (7.0) (minimum 3 datapoints for OK -> ALARM transition).\",\"StateChangeTime\":\"2021-07-14T23:20:50.708+0000\",\"Region\":\"Asia Pacific (Seoul)\",\"AlarmArn\":\"arn:aws:cloudwatch:ap-northeast-2:981604548033:alarm:Aurora PostgreSQL CPU 알람 (60%이상시)\",\"OldStateValue\":\"OK\",\"Trigger\":{\"MetricName\":\"CPUUtilization\",\"Namespace\":\"AWS/RDS\",\"StatisticType\":\"Statistic\",\"Statistic\":\"MAXIMUM\",\"Unit\":null,\"Dimensions\":[{\"value\":\"aurora-postgresql\",\"name\":\"EngineName\"}],\"Period\":60,\"EvaluationPeriods\":3,\"ComparisonOperator\":\"GreaterThanOrEqualToThreshold\",\"Threshold\":7,\"TreatMissingData\":\"- TreatMissingData:                    ignore\",\"EvaluateLowSampleCountPercentile\":\"\"}}",
        "Timestamp": "2021-06-07T11:31:17.380Z",
        "SignatureVersion": "1",
        "MessageAttributes": {}
      }
    }
  ]
}
이 외에 다양한 형태의 SNS 메세지는 Github에 test.json과 testRequestHigh.json으로 확인할 수 있다.
위 테스트 메시지를 Lambda 테스트에 넣어보고 테스트를 해본다.
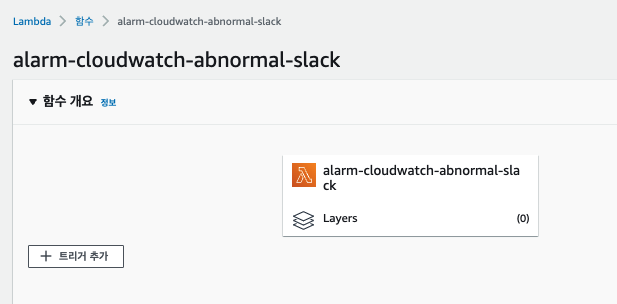
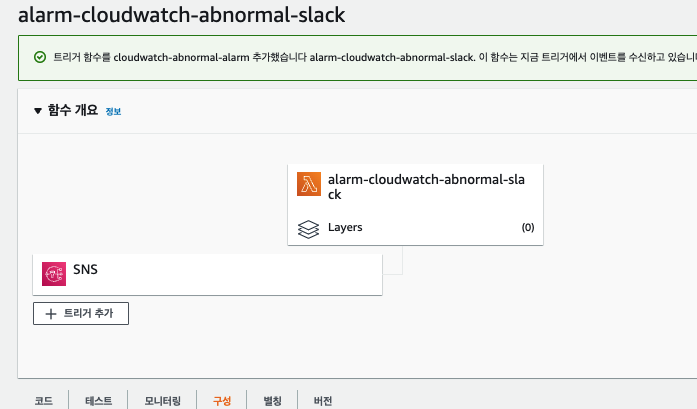
2-3. SNS와 Lambda 연동
SNS와 Lambda는 Lambda 화면에서 트리거로 바로 추가하면 된다.
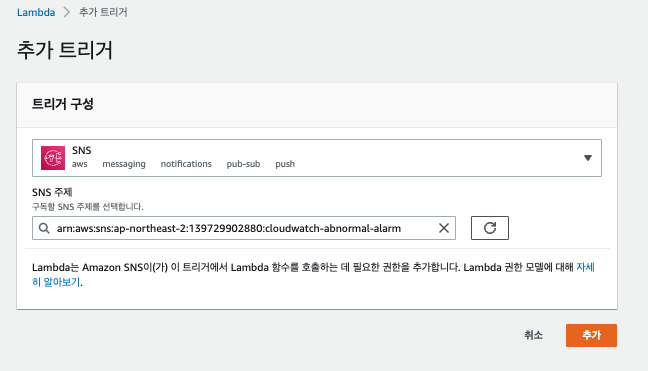
여기까지 SNS와 Lambda까지 연동이 되었다면 이제 CloudWatch 경보를 SNS와 연동만 하면 된다.
3. CloudWatch 경보와 SNS 연동
CloudWatch 경보 페이지로 가서 경보를 생성한다.
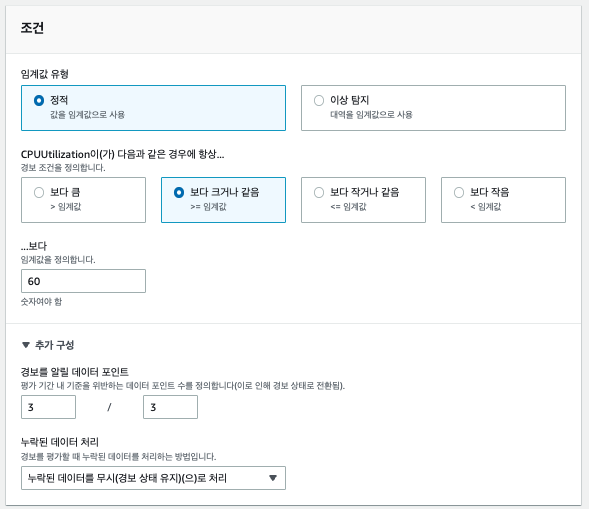
내가 원하는 여러 지표들 중 이번 알람으로 보고 싶은 지표를 선택한다.
- 여기서는 DB의 CPU 지표를 대상으로 삼았다.
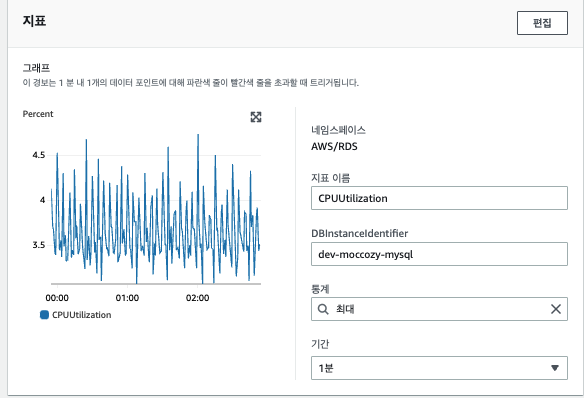
선택한 지표가 어느 조건일때 경보를 발생시킬지 선택한다.
- 여기서는 CPU 지표가 60프로 이상일 경우 경보 발생 조건으로 삼았다.
알람 트리거를 등록하고, 발생 시 SNS에 위에서 만든 SNS를 등록한다.
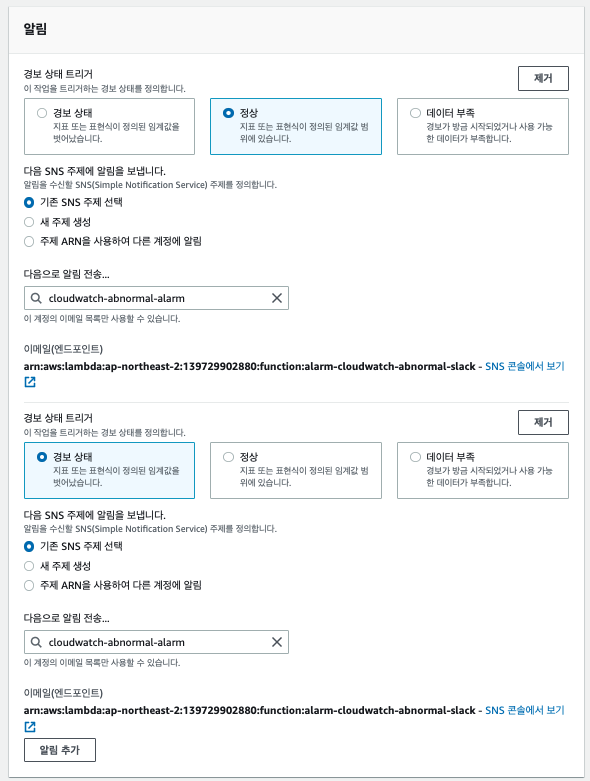
알람 트리거는 총 2개를 생성한다
- 정상 -> 경보
- 경보/데이터부족 => 정상
둘다 넣어야, 비정상 상태에서 정상으로 돌아왔음을 알람으로 인지할 수 있기 때문이다.
정상 알람을 걸어두지 않으면, 아직까지 장애인지/장애가 해소된건지 알 수가 없기 때문에 무조건 노트북을 열어 확인할 수 밖에 없다.
본인의 정신 건강을 위해서라도? 정상 알람까지 꼭 추가를 하자
마지막으로 경보 이름과 설명을 추가한다.
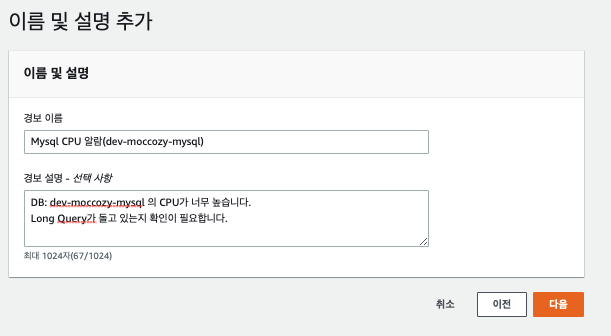
경보 설명은 최대한 상세하게 작성하는걸 추천한다
이 알람을 확인한 분들이 서비스/AWS 리소스를 잘 모르더라도 이 알람이 어떤 알람인지 쉽게 이해할 수 있다.
여기까지 했다면 모든 설정은 끝났다.
4. 실제 알람 발생
첫 연동 이후에 데이터부족 -> 정상으로 상태가 전환되면서 자동으로 아래와 같이 알람들이 오게 된다.
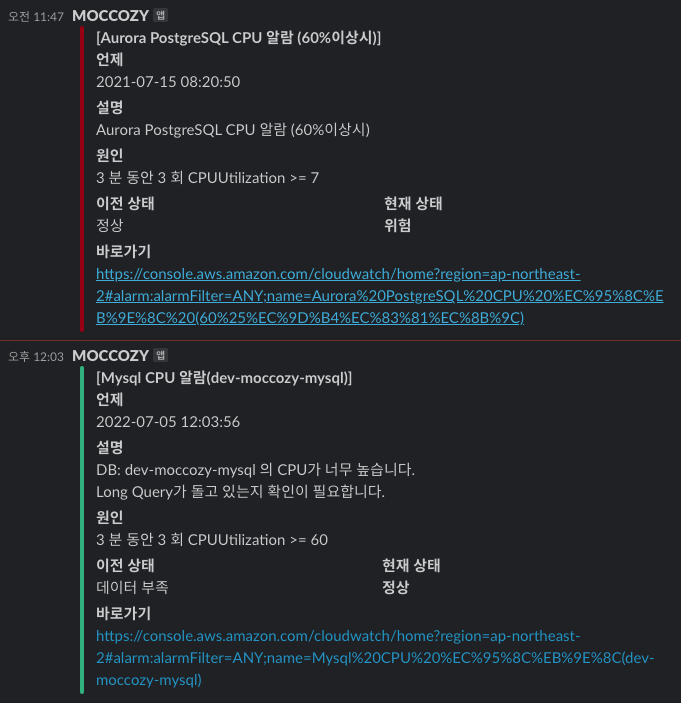
한번 구축된 SNS와 Lambda를 통해서 이후에는 CloudWatch 경보만 계속 추가하면서 알람을 등록하면 된다.
