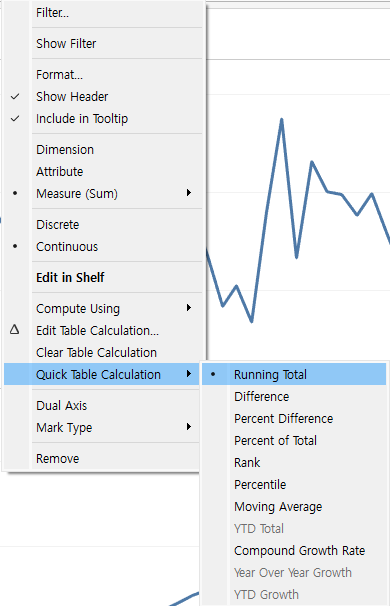
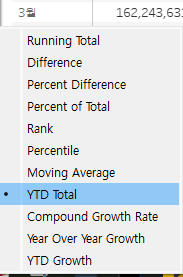
Quick Table Calculation
-
Running Total
-
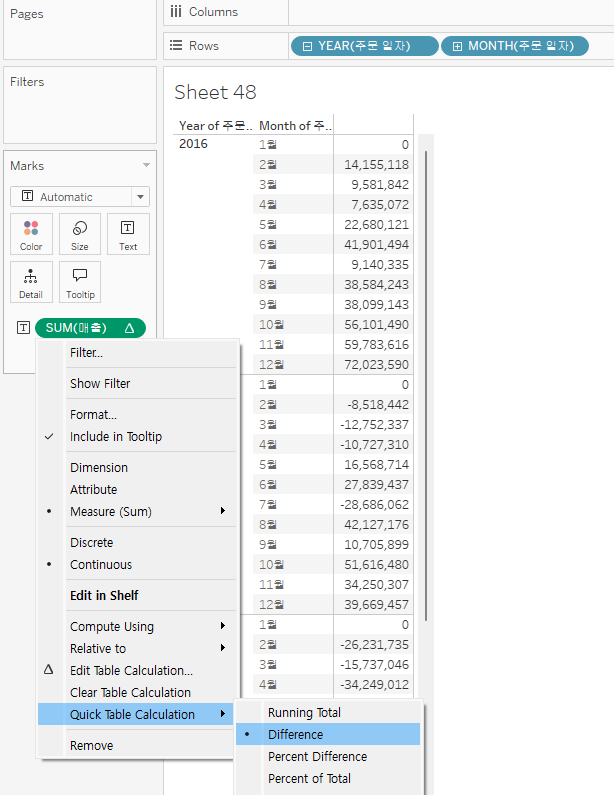
Difference
-
Percent Difference
-
Rank
-
Ratio Difference
YOY growth rate
percentile
moving average -
YTD 총계
-
통합 성장률
-
작년 대비 성장률
-
YTD 성장률
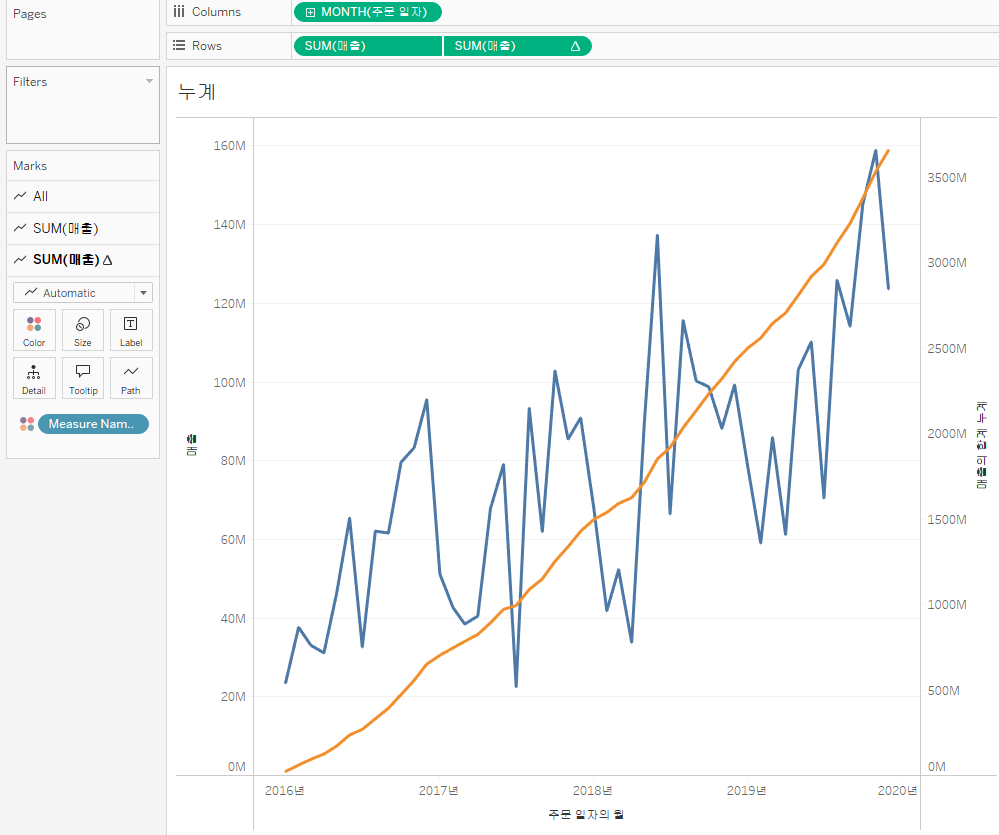
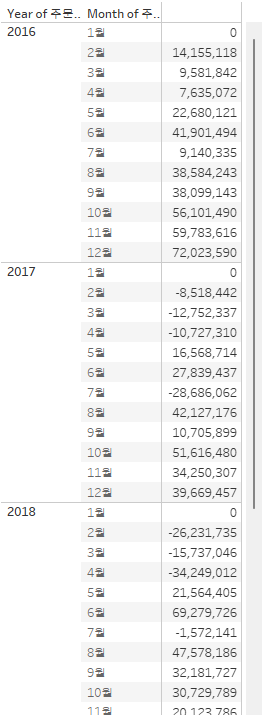
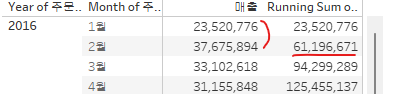
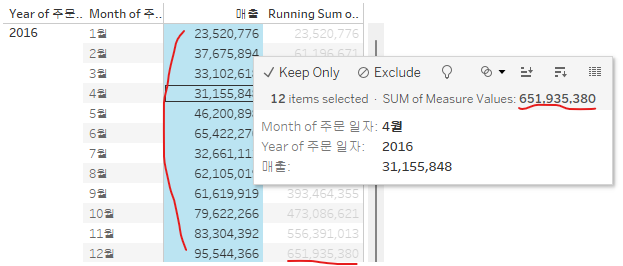
Running Total
Blue - Monthly Sales
Orange - Sales accumulation
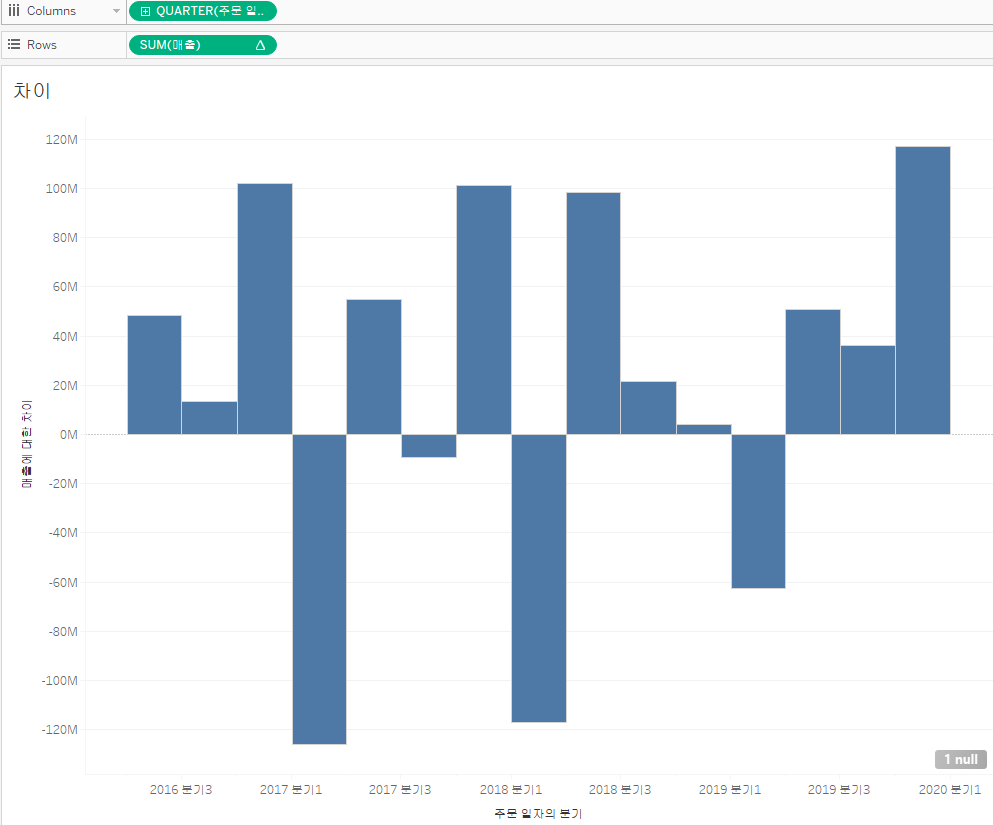
Difference
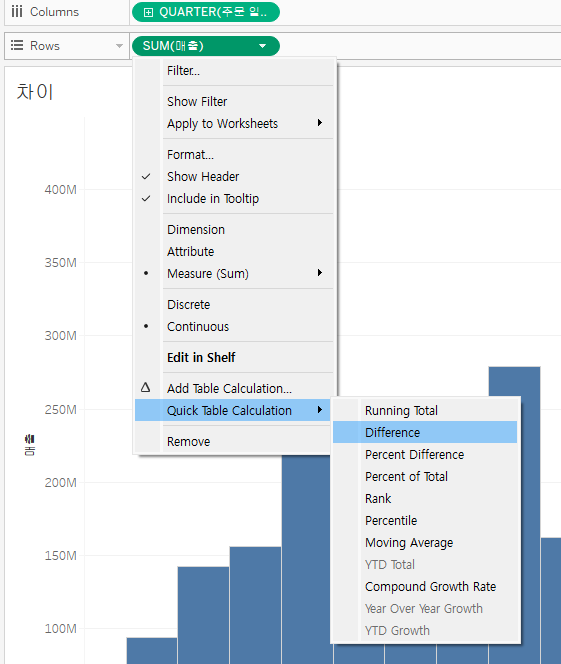
Expressed as difference from the previous quarter for total sales from Q2 2016 to Q4 2019
null is because there is no data for comparison in the first quarter of 2016
Difference - difference foramt example
Comparison based on the first value
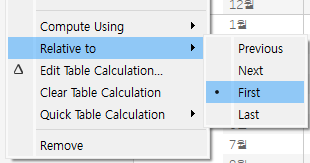
Comparison based on January value of each year
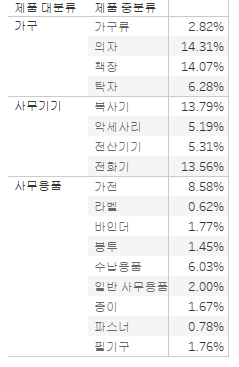
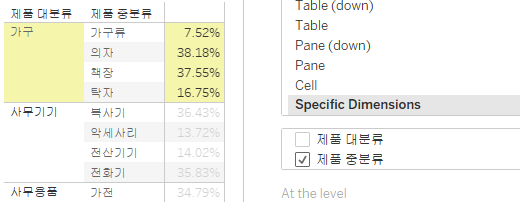
Percent of Total
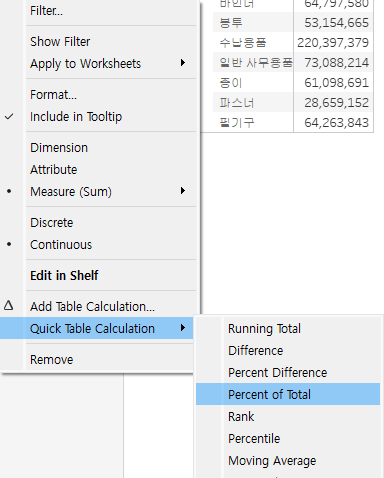
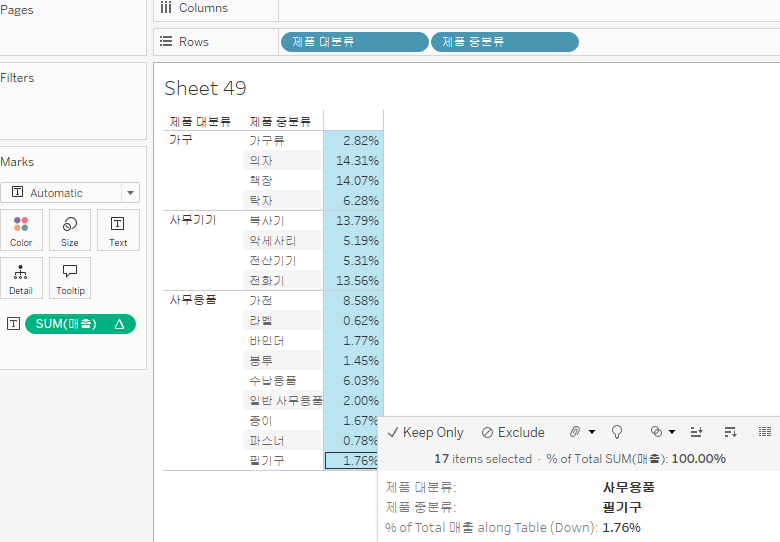
Proportion of "중분류"
Rank
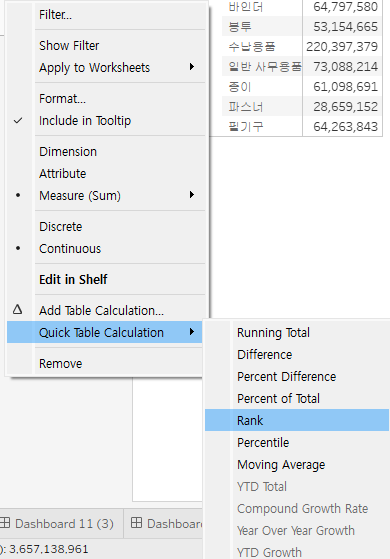
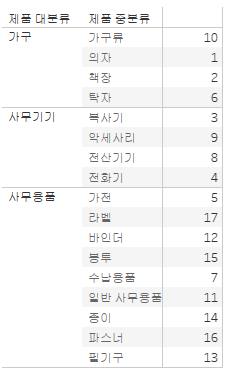
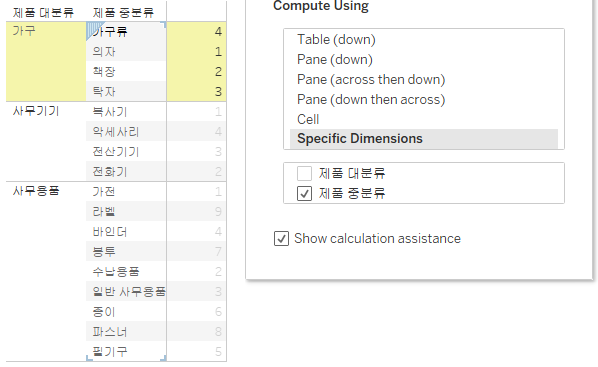
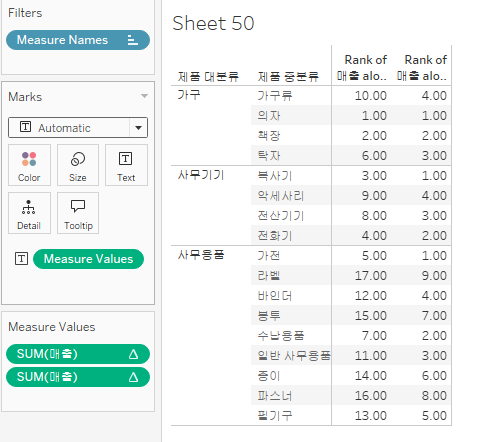
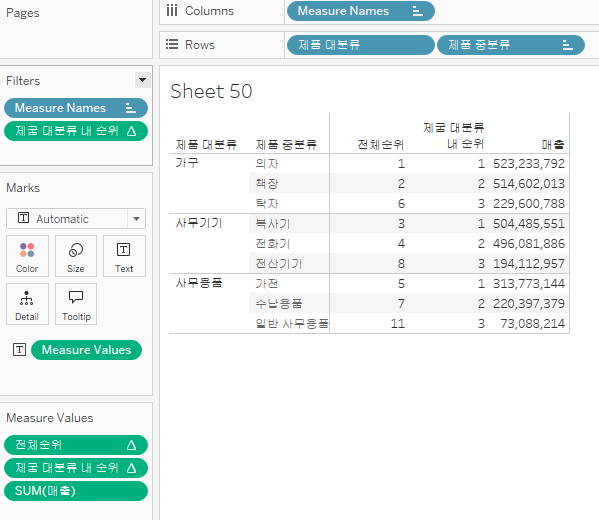
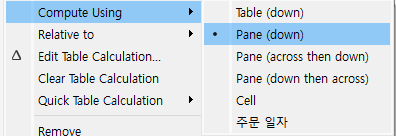
The first ranking is based on the entire table,
the second ranking is based on the panel within each product category.
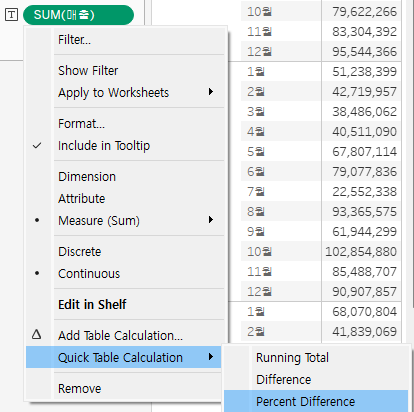
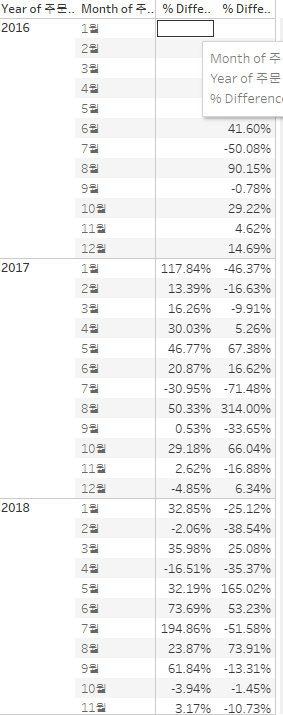
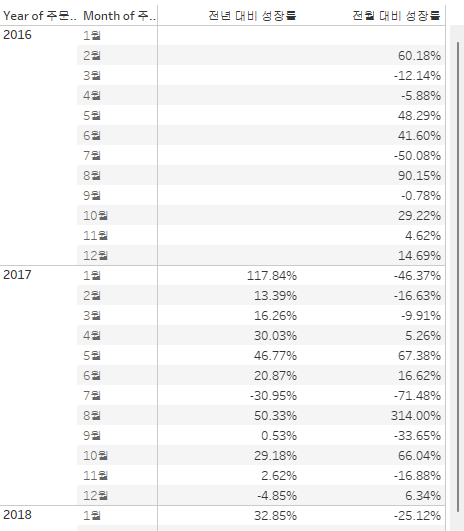
Percent Difference
-> growth rate
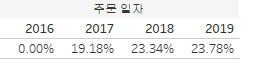
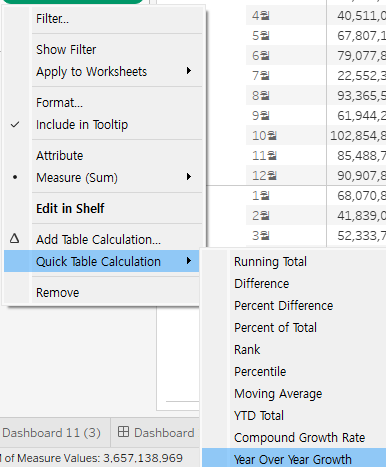
Year Over Year Growth
Year-on-year growth rate -> Comparison with previous year in the same month
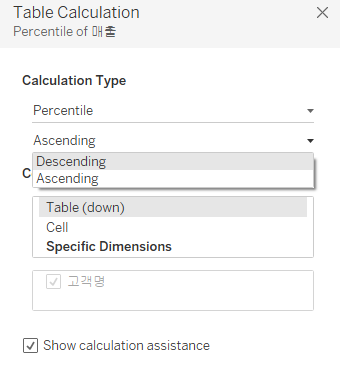
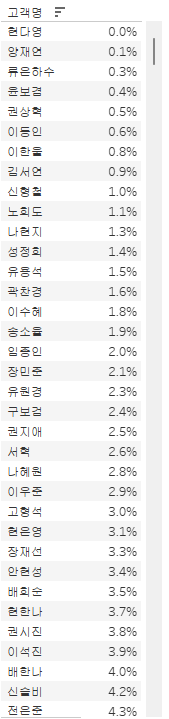
Percentile
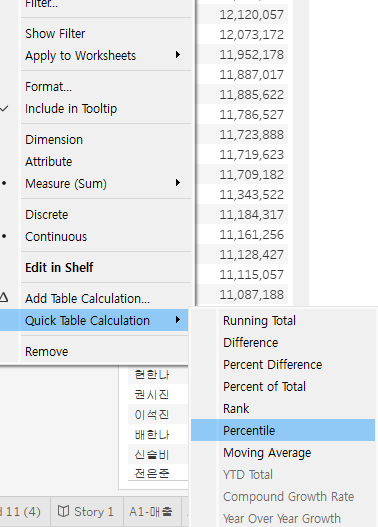
Percentile (expressed as top percent 5%, 10%, etc.)
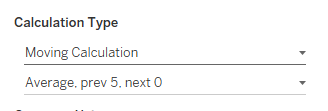
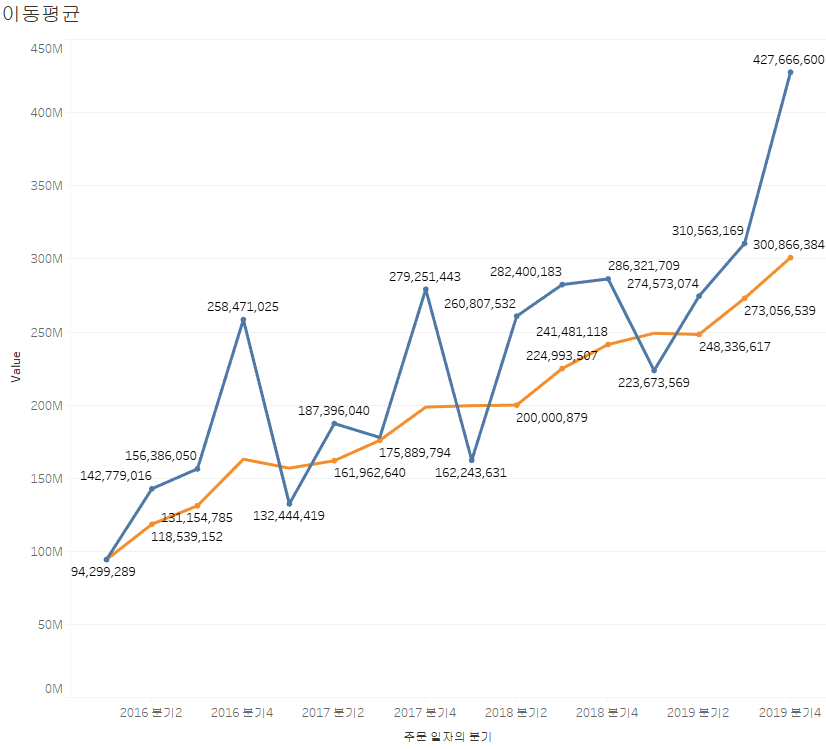
Moving average
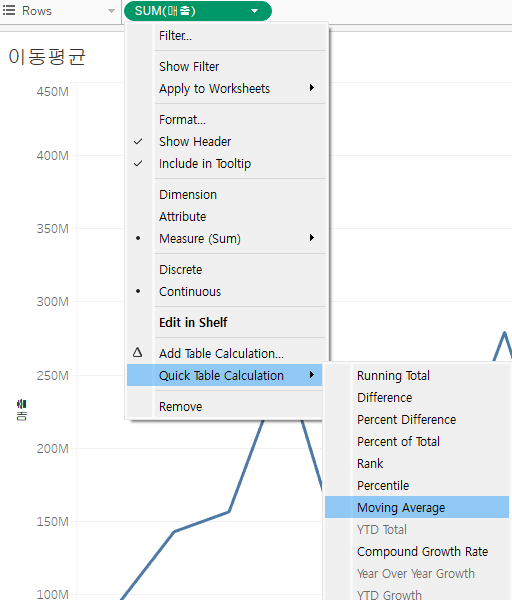
Moving average (set the period to calculate the average and then divide by the number of periods)
used for Test score average, Stock data
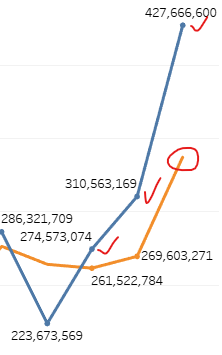
The average for 2019 2nd quarter 3rd quarter 4th quarter is 337,600,948
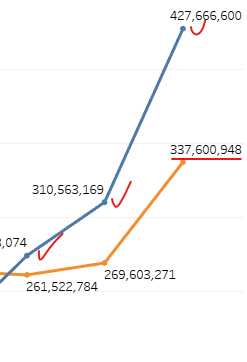
Change the averaging period
Above the orange moving average line, performance is relatively good, while below the moving average line, the performance is poor due to relative performance.
YTD Total
(From the start of the year to the present) Total up to a certain point in time
Sales 2016 sum of January and February is YTD February value
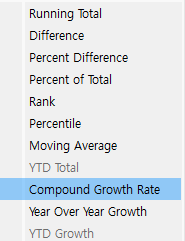
Compound Annual Growth Rate (CAGR)
= average annual growth rate
- The growth rate over several years is converted to an average, and the annual growth rate is converted to a geometric average, not an arithmetic average.
YOY growth
Growth rate compared to last year