
데이터 불러오기
import pandas as pd
import numpy as np
import seaborn as sns
import matplotlib.pyplot as plt
# tensorflow 를 tf로 불러오기
import tensorflow as tf
#pandas가 모든 열을 표시하도록 옵션을 변경합니다.
pd.set_option('display.max_columns', None)train = pd.read_csv("train.csv",encoding="cp949")
test = pd.read_csv("test.csv",encoding="cp949")
train.shape, test.shape((301, 58), (127, 58))label_name = "OC"test = test.drop(columns = "OC")데이터확인
train.info()<class 'pandas.core.frame.DataFrame'>
RangeIndex: 301 entries, 0 to 300
Data columns (total 58 columns):
# Column Non-Null Count Dtype
--- ------ -------------- -----
0 inst_id 301 non-null int64
1 OC 301 non-null object
2 sido 301 non-null object
3 sgg 301 non-null int64
4 openDate 301 non-null int64
5 bedCount 296 non-null float64
6 instkind 300 non-null object
7 revenue1 293 non-null float64
8 salescost1 293 non-null float64
9 sga1 293 non-null float64
10 salary1 293 non-null float64
11 noi1 293 non-null float64
12 noe1 293 non-null float64
13 interest1 293 non-null float64
14 ctax1 293 non-null float64
15 profit1 293 non-null float64
16 liquidAsset1 293 non-null float64
17 quickAsset1 293 non-null float64
18 receivableS1 293 non-null float64
19 inventoryAsset1 293 non-null float64
20 nonCAsset1 293 non-null float64
21 tanAsset1 293 non-null float64
22 OnonCAsset1 293 non-null float64
23 receivableL1 293 non-null float64
24 debt1 293 non-null float64
25 liquidLiabilities1 293 non-null float64
26 shortLoan1 293 non-null float64
27 NCLiabilities1 293 non-null float64
28 longLoan1 293 non-null float64
29 netAsset1 293 non-null float64
30 surplus1 293 non-null float64
31 revenue2 293 non-null float64
32 salescost2 293 non-null float64
33 sga2 293 non-null float64
34 salary2 293 non-null float64
35 noi2 293 non-null float64
36 noe2 293 non-null float64
37 interest2 293 non-null float64
38 ctax2 293 non-null float64
39 profit2 293 non-null float64
40 liquidAsset2 293 non-null float64
41 quickAsset2 293 non-null float64
42 receivableS2 293 non-null float64
43 inventoryAsset2 293 non-null float64
44 nonCAsset2 293 non-null float64
45 tanAsset2 293 non-null float64
46 OnonCAsset2 293 non-null float64
47 receivableL2 293 non-null float64
48 debt2 293 non-null float64
49 liquidLiabilities2 293 non-null float64
50 shortLoan2 293 non-null float64
51 NCLiabilities2 293 non-null float64
52 longLoan2 293 non-null float64
53 netAsset2 293 non-null float64
54 surplus2 293 non-null float64
55 employee1 291 non-null float64
56 employee2 288 non-null float64
57 ownerChange 289 non-null object
dtypes: float64(51), int64(3), object(4)
memory usage: 136.5+ KB결측치 확인
# 결측치를 확인합니다.
train.isnull().sum()
inst_id 0
OC 0
sido 0
sgg 0
openDate 0
bedCount 5
instkind 1
revenue1 8
salescost1 8
sga1 8
salary1 8
noi1 8
noe1 8
interest1 8
ctax1 8
profit1 8
liquidAsset1 8
quickAsset1 8
receivableS1 8
inventoryAsset1 8
nonCAsset1 8
tanAsset1 8
OnonCAsset1 8
receivableL1 8
debt1 8
liquidLiabilities1 8
shortLoan1 8
NCLiabilities1 8
longLoan1 8
netAsset1 8
surplus1 8
revenue2 8
salescost2 8
sga2 8
salary2 8
noi2 8
noe2 8
interest2 8
ctax2 8
profit2 8
liquidAsset2 8
quickAsset2 8
receivableS2 8
inventoryAsset2 8
nonCAsset2 8
tanAsset2 8
OnonCAsset2 8
receivableL2 8
debt2 8
liquidLiabilities2 8
shortLoan2 8
NCLiabilities2 8
longLoan2 8
netAsset2 8
surplus2 8
employee1 10
employee2 13
ownerChange 12
dtype: int64데이터 전처리
test["openDate"] = test["openDate"].fillna(0)train["openDate"] = pd.to_datetime(train["openDate"].astype("str"), format="%Y/%m/%d")
test["openDate"] = pd.to_datetime(test["openDate"].astype("int").astype("str"), format="%Y/%m/%d", errors="coerce")train["open_year"] = train["openDate"].dt.year
train["open_month"] = train["openDate"].dt.month
test["open_year"] = test["openDate"].dt.year
test["open_month"] = test["openDate"].dt.month
train.drop(columns="openDate", axis=1, inplace=True)
test.drop(columns="openDate", axis=1, inplace=True)fig, ax = plt.subplots(1, 2, figsize=(32, 8))
sns.countplot(data=train, x="open_year", ax=ax[0]).set_title("Train - Year")
sns.countplot(data=test, x="open_year", ax=ax[1]).set_title("Test - Year")
plt.show()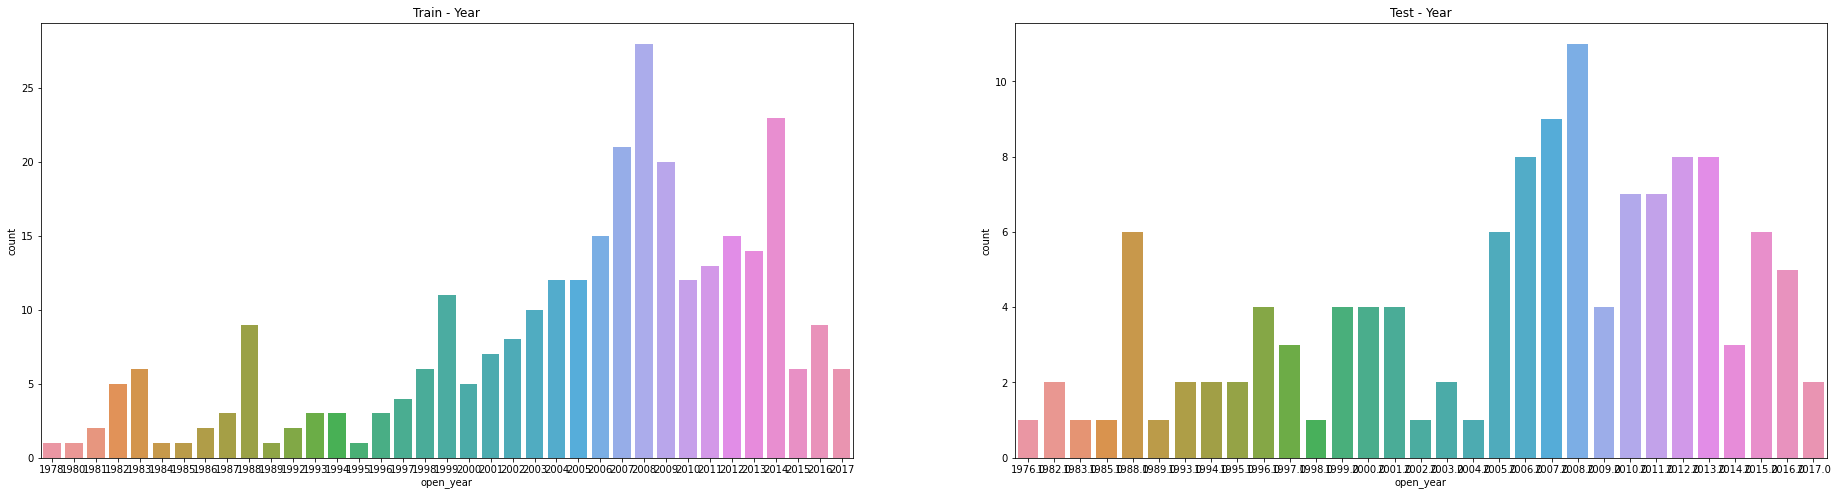
train["sido"].isnull().sum(), test["sido"].isnull().sum()(0, 0)set(train["sido"].value_counts().index) - set(test["sido"].value_counts().index){'gangwon', 'gwangju'}train[train["sido"]=='jeju'].shape, test[test["sido"]=='jeju'].shape((0, 59), (3, 58))# ~남 ~북을 제거, ex. 충남 -> 충 / 충북 -> 충
train["sido"] = train["sido"].str.replace("nam|buk", "")
test["sido"] = test["sido"].str.replace("nam|buk", "")
# 인천과 경기를 묶어줌
train["sido"] = train["sido"].str.replace("gyeonggi|incheon", "gyeon-in")
test["sido"] = test["sido"].str.replace("gyeonggi|incheon", "gyeon-in")<ipython-input-15-b23b3513b0b1>:2: FutureWarning: The default value of regex will change from True to False in a future version.
train["sido"] = train["sido"].str.replace("nam|buk", "")
<ipython-input-15-b23b3513b0b1>:3: FutureWarning: The default value of regex will change from True to False in a future version.
test["sido"] = test["sido"].str.replace("nam|buk", "")
<ipython-input-15-b23b3513b0b1>:5: FutureWarning: The default value of regex will change from True to False in a future version.
train["sido"] = train["sido"].str.replace("gyeonggi|incheon", "gyeon-in")
<ipython-input-15-b23b3513b0b1>:6: FutureWarning: The default value of regex will change from True to False in a future version.
test["sido"] = test["sido"].str.replace("gyeonggi|incheon", "gyeon-in")sido_list = set(train["sido"].value_counts().index) | set(test["sido"].value_counts().index)
len(sido_list)13sido_list{'busan',
'choong',
'daegu',
'daejeon',
'gangwon',
'gwangju',
'gyeon-in',
'gyeong',
'jeju',
'jeon',
'sejong',
'seoul',
'ulsan'}fig, ax = plt.subplots(1, 2, figsize=(28, 8))
sns.countplot(data=train, x="sido", ax=ax[0]).set_title("Train - sido")
sns.countplot(data=test, x="sido", ax=ax[1]).set_title("Test - sido")
plt.show()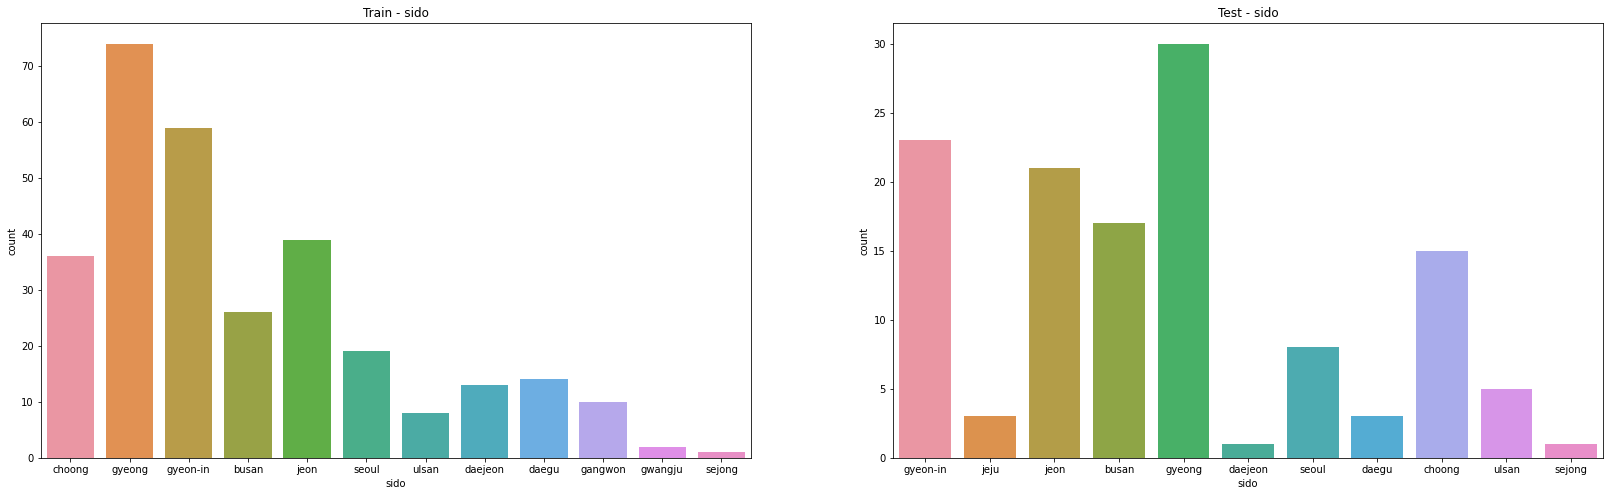
train.hist(bins=50,figsize=(20,20))array([[<matplotlib.axes._subplots.AxesSubplot object at 0x7fddb70799a0>,
<matplotlib.axes._subplots.AxesSubplot object at 0x7fddb7020dc0>,
<matplotlib.axes._subplots.AxesSubplot object at 0x7fddb6fd9220>,
<matplotlib.axes._subplots.AxesSubplot object at 0x7fddb6f85610>,
<matplotlib.axes._subplots.AxesSubplot object at 0x7fddb6f34a30>,
<matplotlib.axes._subplots.AxesSubplot object at 0x7fddb6f60d60>,
<matplotlib.axes._subplots.AxesSubplot object at 0x7fddb6f60e50>],
[<matplotlib.axes._subplots.AxesSubplot object at 0x7fddb6f1d310>,
<matplotlib.axes._subplots.AxesSubplot object at 0x7fddb6e78a60>,
<matplotlib.axes._subplots.AxesSubplot object at 0x7fddb6ea4e50>,
<matplotlib.axes._subplots.AxesSubplot object at 0x7fddb6e6b280>,
<matplotlib.axes._subplots.AxesSubplot object at 0x7fddb6e17670>,
<matplotlib.axes._subplots.AxesSubplot object at 0x7fddb6dc6a90>,
<matplotlib.axes._subplots.AxesSubplot object at 0x7fddb6d73e80>],
[<matplotlib.axes._subplots.AxesSubplot object at 0x7fddb6daf2b0>,
<matplotlib.axes._subplots.AxesSubplot object at 0x7fddb6d5c6d0>,
<matplotlib.axes._subplots.AxesSubplot object at 0x7fddb6d09ac0>,
<matplotlib.axes._subplots.AxesSubplot object at 0x7fddb6cb6eb0>,
<matplotlib.axes._subplots.AxesSubplot object at 0x7fddb6cf12b0>,
<matplotlib.axes._subplots.AxesSubplot object at 0x7fddb6c9b9d0>,
<matplotlib.axes._subplots.AxesSubplot object at 0x7fddb6c52130>],
[<matplotlib.axes._subplots.AxesSubplot object at 0x7fddb6bfc850>,
<matplotlib.axes._subplots.AxesSubplot object at 0x7fddb6c29fa0>,
<matplotlib.axes._subplots.AxesSubplot object at 0x7fddb6bde700>,
<matplotlib.axes._subplots.AxesSubplot object at 0x7fddb6b8ae20>,
<matplotlib.axes._subplots.AxesSubplot object at 0x7fddb6b3f580>,
<matplotlib.axes._subplots.AxesSubplot object at 0x7fddb6b6aca0>,
<matplotlib.axes._subplots.AxesSubplot object at 0x7fddb6b22400>],
[<matplotlib.axes._subplots.AxesSubplot object at 0x7fddb6accb20>,
<matplotlib.axes._subplots.AxesSubplot object at 0x7fddb6a842b0>,
<matplotlib.axes._subplots.AxesSubplot object at 0x7fddb6aaf9d0>,
<matplotlib.axes._subplots.AxesSubplot object at 0x7fddb6a67130>,
<matplotlib.axes._subplots.AxesSubplot object at 0x7fddb6a10850>,
<matplotlib.axes._subplots.AxesSubplot object at 0x7fddb69b9f70>,
<matplotlib.axes._subplots.AxesSubplot object at 0x7fddb69ef6d0>],
[<matplotlib.axes._subplots.AxesSubplot object at 0x7fddb699edf0>,
<matplotlib.axes._subplots.AxesSubplot object at 0x7fddb6950550>,
<matplotlib.axes._subplots.AxesSubplot object at 0x7fddb68fbc70>,
<matplotlib.axes._subplots.AxesSubplot object at 0x7fddb68b33d0>,
<matplotlib.axes._subplots.AxesSubplot object at 0x7fddb68ddaf0>,
<matplotlib.axes._subplots.AxesSubplot object at 0x7fddb6896250>,
<matplotlib.axes._subplots.AxesSubplot object at 0x7fddb683e9a0>],
[<matplotlib.axes._subplots.AxesSubplot object at 0x7fddb6868160>,
<matplotlib.axes._subplots.AxesSubplot object at 0x7fddb681e820>,
<matplotlib.axes._subplots.AxesSubplot object at 0x7fddb67c9f40>,
<matplotlib.axes._subplots.AxesSubplot object at 0x7fddb67806a0>,
<matplotlib.axes._subplots.AxesSubplot object at 0x7fddb67abdc0>,
<matplotlib.axes._subplots.AxesSubplot object at 0x7fddb6763520>,
<matplotlib.axes._subplots.AxesSubplot object at 0x7fddb670ac40>],
[<matplotlib.axes._subplots.AxesSubplot object at 0x7fddb66c53a0>,
<matplotlib.axes._subplots.AxesSubplot object at 0x7fddb66edac0>,
<matplotlib.axes._subplots.AxesSubplot object at 0x7fddb66a5220>,
<matplotlib.axes._subplots.AxesSubplot object at 0x7fddb6fcc250>,
<matplotlib.axes._subplots.AxesSubplot object at 0x7fddb6e38640>,
<matplotlib.axes._subplots.AxesSubplot object at 0x7fddb6d17a00>,
<matplotlib.axes._subplots.AxesSubplot object at 0x7fddb76bd0d0>]],
dtype=object)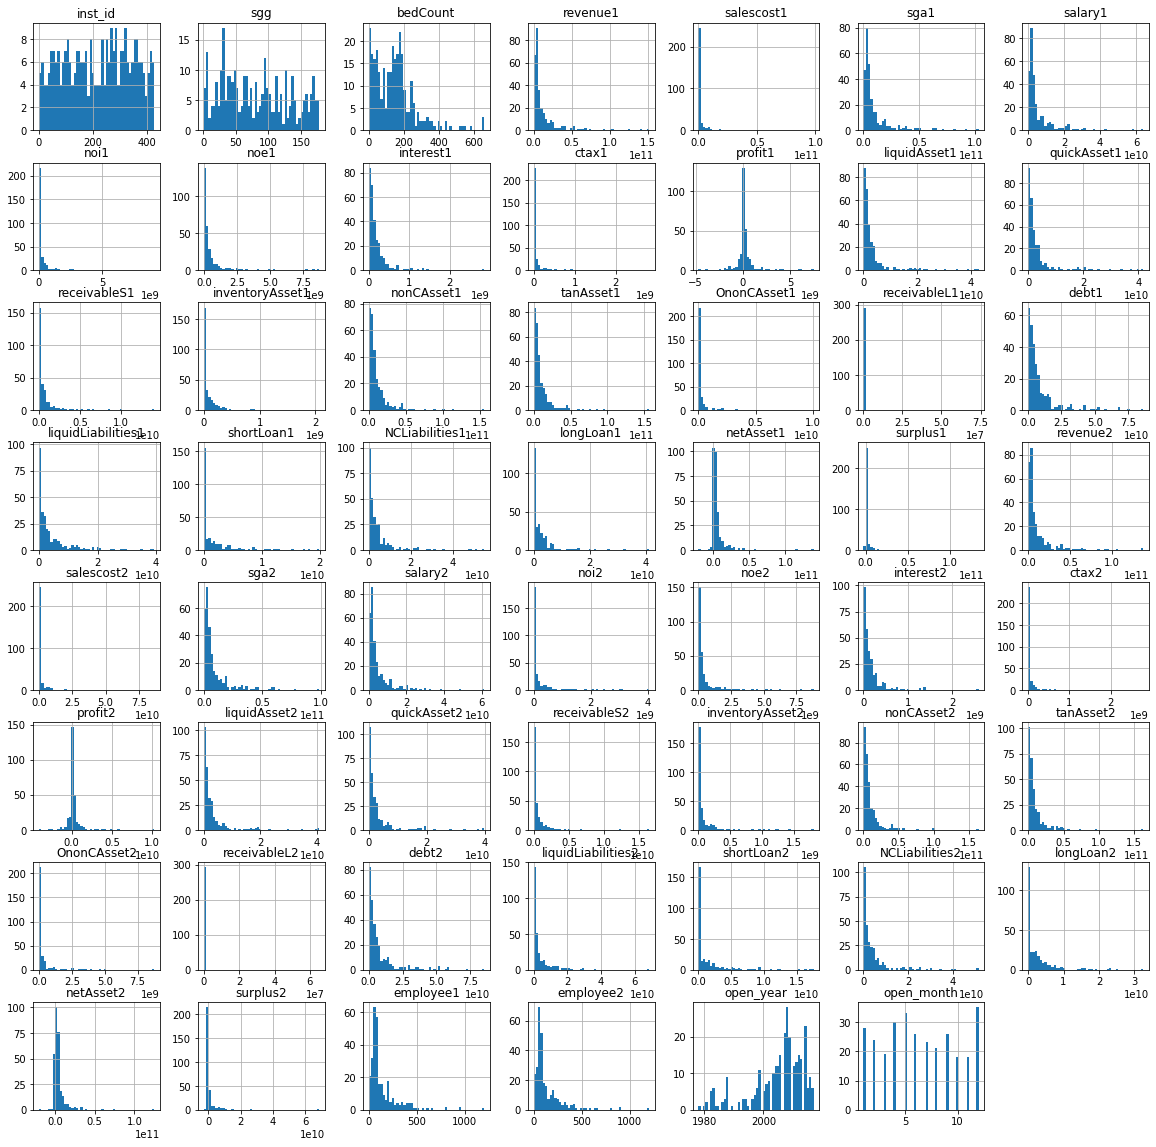
sns.heatmap(train.isnull())<matplotlib.axes._subplots.AxesSubplot at 0x7fddb4691b50>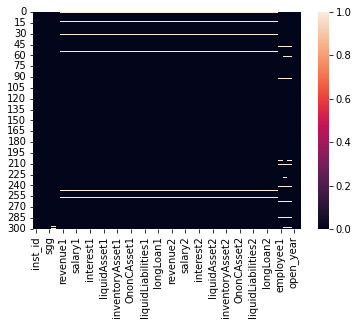
sns.heatmap(test.isnull())<matplotlib.axes._subplots.AxesSubplot at 0x7fddb52ba9d0>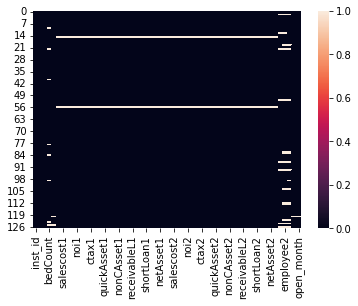
train["OC"] = train["OC"].replace("open",1)
train["OC"] = train["OC"].replace(" close",0)
# OC (value_counts)
train["OC"].value_counts()1 286
0 15
Name: OC, dtype: int64train["OC"].value_counts().value_counts(normalize=True)286 0.5
15 0.5
Name: OC, dtype: float64# countplot
sns.countplot(data=train,x="OC")<matplotlib.axes._subplots.AxesSubplot at 0x7fddb718fa60>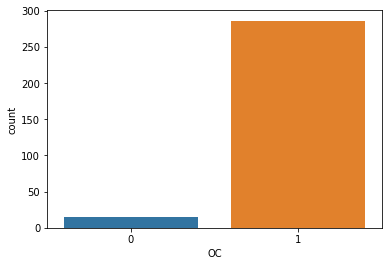
train.head()| inst_id | OC | sido | sgg | bedCount | instkind | revenue1 | salescost1 | sga1 | salary1 | noi1 | noe1 | interest1 | ctax1 | profit1 | liquidAsset1 | quickAsset1 | receivableS1 | inventoryAsset1 | nonCAsset1 | tanAsset1 | OnonCAsset1 | receivableL1 | debt1 | liquidLiabilities1 | shortLoan1 | NCLiabilities1 | longLoan1 | netAsset1 | surplus1 | revenue2 | salescost2 | sga2 | salary2 | noi2 | noe2 | interest2 | ctax2 | profit2 | liquidAsset2 | quickAsset2 | receivableS2 | inventoryAsset2 | nonCAsset2 | tanAsset2 | OnonCAsset2 | receivableL2 | debt2 | liquidLiabilities2 | shortLoan2 | NCLiabilities2 | longLoan2 | netAsset2 | surplus2 | employee1 | employee2 | ownerChange | open_year | open_month | |
|---|---|---|---|---|---|---|---|---|---|---|---|---|---|---|---|---|---|---|---|---|---|---|---|---|---|---|---|---|---|---|---|---|---|---|---|---|---|---|---|---|---|---|---|---|---|---|---|---|---|---|---|---|---|---|---|---|---|---|---|
| 0 | 1 | 1 | choong | 73 | 175.0 | nursing_hospital | 4.217530e+09 | 0.0 | 3.961135e+09 | 2.033835e+09 | 15652441.0 | 1.523624e+07 | 1.323624e+07 | 31641798.0 | 225169678.0 | 1.012700e+09 | 9.976719e+08 | 4.700557e+08 | 1.502781e+07 | 2.514586e+09 | 2.360684e+09 | 1.434496e+08 | 0.0 | 6.828260e+08 | 2.013237e+08 | 0.000000e+00 | 4.815023e+08 | 3.510000e+08 | 2.844460e+09 | 1.496394e+09 | 4.297848e+09 | 0.0 | 4.057422e+09 | 2.063787e+09 | 16194675.0 | 2.998335e+07 | 1.568305e+07 | 18808074.0 | 207829685.0 | 8.301695e+08 | 8.165705e+08 | 5.237026e+08 | 1.359897e+07 | 2.548115e+09 | 2.386263e+09 | 1.458986e+08 | 0.0 | 7.589937e+08 | 2.228769e+08 | 0.000000e+00 | 5.361169e+08 | 3.900000e+08 | 2.619290e+09 | 1.271224e+09 | 62.0 | 64.0 | same | 2007 | 12 |
| 1 | 3 | 1 | gyeong | 32 | 410.0 | general_hospital | NaN | NaN | NaN | NaN | NaN | NaN | NaN | NaN | NaN | NaN | NaN | NaN | NaN | NaN | NaN | NaN | NaN | NaN | NaN | NaN | NaN | NaN | NaN | NaN | NaN | NaN | NaN | NaN | NaN | NaN | NaN | NaN | NaN | NaN | NaN | NaN | NaN | NaN | NaN | NaN | NaN | NaN | NaN | NaN | NaN | NaN | NaN | NaN | 801.0 | 813.0 | same | 1997 | 4 |
| 2 | 4 | 1 | gyeon-in | 89 | 468.0 | nursing_hospital | 1.004522e+09 | 515483669.0 | 4.472197e+08 | 2.964023e+08 | 76156.0 | 3.000000e+04 | 0.000000e+00 | 0.0 | 41864754.0 | 2.724421e+08 | 2.536822e+08 | 8.095950e+06 | 1.875997e+07 | 1.204810e+08 | 1.204810e+08 | 0.000000e+00 | 0.0 | 9.241434e+07 | 9.241434e+07 | 0.000000e+00 | 0.000000e+00 | 0.000000e+00 | 3.005088e+08 | 0.000000e+00 | 0.000000e+00 | 0.0 | 0.000000e+00 | 0.000000e+00 | 0.0 | 0.000000e+00 | 0.000000e+00 | 0.0 | 0.0 | 0.000000e+00 | 0.000000e+00 | 0.000000e+00 | 0.000000e+00 | 0.000000e+00 | 0.000000e+00 | 0.000000e+00 | 0.0 | 0.000000e+00 | 0.000000e+00 | 0.000000e+00 | 0.000000e+00 | 0.000000e+00 | 0.000000e+00 | 0.000000e+00 | 234.0 | 1.0 | same | 2016 | 12 |
| 3 | 7 | 1 | gyeon-in | 141 | 353.0 | general_hospital | 7.250734e+10 | 0.0 | 7.067740e+10 | 3.178605e+10 | 506223059.0 | 1.259568e+09 | 1.196881e+09 | 173769780.0 | 902830288.0 | 1.304154e+10 | 1.153475e+10 | 0.000000e+00 | 1.506793e+09 | 4.317936e+10 | 3.832078e+10 | 3.945208e+09 | 0.0 | 4.236380e+10 | 2.799188e+10 | 1.988520e+10 | 1.437192e+10 | 7.253040e+09 | 1.385710e+10 | 8.643659e+09 | 6.685834e+10 | 0.0 | 6.492419e+10 | 2.971135e+10 | 476807804.0 | 1.353672e+09 | 1.277422e+09 | 218891720.0 | 838387466.0 | 1.112572e+10 | 9.890540e+09 | 0.000000e+00 | 1.235181e+09 | 3.958356e+10 | 3.485576e+10 | 3.915906e+09 | 0.0 | 3.775501e+10 | 1.701860e+10 | 9.219427e+09 | 2.073641e+10 | 1.510000e+10 | 1.295427e+10 | 7.740829e+09 | 663.0 | 663.0 | same | 2000 | 8 |
| 4 | 9 | 1 | gyeong | 32 | 196.0 | general_hospital | 4.904354e+10 | 0.0 | 4.765605e+10 | 2.446078e+10 | 112352259.0 | 1.419089e+09 | 1.307249e+09 | 0.0 | 80749696.0 | 6.317084e+09 | 5.873265e+09 | 4.099320e+09 | 4.438186e+08 | 4.366733e+10 | 4.330613e+10 | 2.223400e+08 | 0.0 | 4.989811e+10 | 2.890919e+10 | 1.793038e+10 | 2.098892e+10 | 1.350000e+10 | 8.631164e+07 | 9.025550e+09 | 4.808280e+10 | 0.0 | 4.712580e+10 | 2.346004e+10 | 597748128.0 | 1.522108e+09 | 1.349851e+09 | 0.0 | 32642585.0 | 4.906776e+09 | 4.464017e+09 | 3.365227e+09 | 4.427591e+08 | 4.653138e+10 | 4.562945e+10 | 7.893407e+08 | 0.0 | 5.143259e+10 | 3.007259e+10 | 1.759375e+10 | 2.136001e+10 | 1.410803e+10 | 5.561941e+06 | 9.025550e+09 | 206.0 | 197.0 | same | 2005 | 9 |
<svg xmlns="http://www.w3.org/2000/svg" height="24px"viewBox="0 0 24 24"
width="24px">
  <script>
    const buttonEl =
      document.querySelector('#df-2ffd38eb-be1d-4e84-b043-7a9a643acafc button.colab-df-convert');
    buttonEl.style.display =
      google.colab.kernel.accessAllowed ? 'block' : 'none';

    async function convertToInteractive(key) {
      const element = document.querySelector('#df-2ffd38eb-be1d-4e84-b043-7a9a643acafc');
      const dataTable =
        await google.colab.kernel.invokeFunction('convertToInteractive',
                                                 [key], {});
      if (!dataTable) return;

      const docLinkHtml = 'Like what you see? Visit the ' +
        '<a target="_blank" href=https://colab.research.google.com/notebooks/data_table.ipynb>data table notebook</a>'
        + ' to learn more about interactive tables.';
      element.innerHTML = '';
      dataTable['output_type'] = 'display_data';
      await google.colab.output.renderOutput(dataTable, element);
      const docLink = document.createElement('div');
      docLink.innerHTML = docLinkHtml;
      element.appendChild(docLink);
    }
  </script>
</div>sns.countplot(data=train, x="open_year")
plt.show()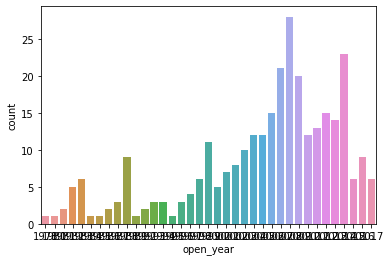
train.info()<class 'pandas.core.frame.DataFrame'>
RangeIndex: 301 entries, 0 to 300
Data columns (total 59 columns):
# Column Non-Null Count Dtype
--- ------ -------------- -----
0 inst_id 301 non-null int64
1 OC 301 non-null int64
2 sido 301 non-null object
3 sgg 301 non-null int64
4 bedCount 296 non-null float64
5 instkind 300 non-null object
6 revenue1 293 non-null float64
7 salescost1 293 non-null float64
8 sga1 293 non-null float64
9 salary1 293 non-null float64
10 noi1 293 non-null float64
11 noe1 293 non-null float64
12 interest1 293 non-null float64
13 ctax1 293 non-null float64
14 profit1 293 non-null float64
15 liquidAsset1 293 non-null float64
16 quickAsset1 293 non-null float64
17 receivableS1 293 non-null float64
18 inventoryAsset1 293 non-null float64
19 nonCAsset1 293 non-null float64
20 tanAsset1 293 non-null float64
21 OnonCAsset1 293 non-null float64
22 receivableL1 293 non-null float64
23 debt1 293 non-null float64
24 liquidLiabilities1 293 non-null float64
25 shortLoan1 293 non-null float64
26 NCLiabilities1 293 non-null float64
27 longLoan1 293 non-null float64
28 netAsset1 293 non-null float64
29 surplus1 293 non-null float64
30 revenue2 293 non-null float64
31 salescost2 293 non-null float64
32 sga2 293 non-null float64
33 salary2 293 non-null float64
34 noi2 293 non-null float64
35 noe2 293 non-null float64
36 interest2 293 non-null float64
37 ctax2 293 non-null float64
38 profit2 293 non-null float64
39 liquidAsset2 293 non-null float64
40 quickAsset2 293 non-null float64
41 receivableS2 293 non-null float64
42 inventoryAsset2 293 non-null float64
43 nonCAsset2 293 non-null float64
44 tanAsset2 293 non-null float64
45 OnonCAsset2 293 non-null float64
46 receivableL2 293 non-null float64
47 debt2 293 non-null float64
48 liquidLiabilities2 293 non-null float64
49 shortLoan2 293 non-null float64
50 NCLiabilities2 293 non-null float64
51 longLoan2 293 non-null float64
52 netAsset2 293 non-null float64
53 surplus2 293 non-null float64
54 employee1 291 non-null float64
55 employee2 288 non-null float64
56 ownerChange 289 non-null object
57 open_year 301 non-null int64
58 open_month 301 non-null int64
dtypes: float64(51), int64(5), object(3)
memory usage: 138.9+ KBtest.info()<class 'pandas.core.frame.DataFrame'>
RangeIndex: 127 entries, 0 to 126
Data columns (total 58 columns):
# Column Non-Null Count Dtype
--- ------ -------------- -----
0 inst_id 127 non-null int64
1 sido 127 non-null object
2 sgg 127 non-null int64
3 bedCount 119 non-null float64
4 instkind 125 non-null object
5 revenue1 125 non-null float64
6 salescost1 125 non-null float64
7 sga1 125 non-null float64
8 salary1 125 non-null float64
9 noi1 125 non-null float64
10 noe1 125 non-null float64
11 interest1 125 non-null float64
12 ctax1 125 non-null float64
13 profit1 125 non-null float64
14 liquidAsset1 125 non-null float64
15 quickAsset1 125 non-null float64
16 receivableS1 125 non-null float64
17 inventoryAsset1 125 non-null float64
18 nonCAsset1 125 non-null float64
19 tanAsset1 125 non-null float64
20 OnonCAsset1 125 non-null float64
21 receivableL1 125 non-null float64
22 debt1 125 non-null float64
23 liquidLiabilities1 125 non-null float64
24 shortLoan1 125 non-null float64
25 NCLiabilities1 125 non-null float64
26 longLoan1 125 non-null float64
27 netAsset1 125 non-null float64
28 surplus1 125 non-null float64
29 revenue2 125 non-null float64
30 salescost2 125 non-null float64
31 sga2 125 non-null float64
32 salary2 125 non-null float64
33 noi2 125 non-null float64
34 noe2 125 non-null float64
35 interest2 125 non-null float64
36 ctax2 125 non-null float64
37 profit2 125 non-null float64
38 liquidAsset2 125 non-null float64
39 quickAsset2 125 non-null float64
40 receivableS2 125 non-null float64
41 inventoryAsset2 125 non-null float64
42 nonCAsset2 125 non-null float64
43 tanAsset2 125 non-null float64
44 OnonCAsset2 125 non-null float64
45 receivableL2 125 non-null float64
46 debt2 125 non-null float64
47 liquidLiabilities2 125 non-null float64
48 shortLoan2 125 non-null float64
49 NCLiabilities2 125 non-null float64
50 longLoan2 125 non-null float64
51 netAsset2 125 non-null float64
52 surplus2 125 non-null float64
53 employee1 119 non-null object
54 employee2 112 non-null object
55 ownerChange 112 non-null object
56 open_year 126 non-null float64
57 open_month 126 non-null float64
dtypes: float64(51), int64(2), object(5)
memory usage: 57.7+ KBtrain[['employee1', 'employee2']] = train[['employee1', 'employee2']].astype(float)
test['employee1'] = pd.to_numeric(test['employee1'],errors = 'coerce')
test['employee2'] = pd.to_numeric(test['employee2'],errors = 'coerce')test.info()<class 'pandas.core.frame.DataFrame'>
RangeIndex: 127 entries, 0 to 126
Data columns (total 58 columns):
# Column Non-Null Count Dtype
--- ------ -------------- -----
0 inst_id 127 non-null int64
1 sido 127 non-null object
2 sgg 127 non-null int64
3 bedCount 119 non-null float64
4 instkind 125 non-null object
5 revenue1 125 non-null float64
6 salescost1 125 non-null float64
7 sga1 125 non-null float64
8 salary1 125 non-null float64
9 noi1 125 non-null float64
10 noe1 125 non-null float64
11 interest1 125 non-null float64
12 ctax1 125 non-null float64
13 profit1 125 non-null float64
14 liquidAsset1 125 non-null float64
15 quickAsset1 125 non-null float64
16 receivableS1 125 non-null float64
17 inventoryAsset1 125 non-null float64
18 nonCAsset1 125 non-null float64
19 tanAsset1 125 non-null float64
20 OnonCAsset1 125 non-null float64
21 receivableL1 125 non-null float64
22 debt1 125 non-null float64
23 liquidLiabilities1 125 non-null float64
24 shortLoan1 125 non-null float64
25 NCLiabilities1 125 non-null float64
26 longLoan1 125 non-null float64
27 netAsset1 125 non-null float64
28 surplus1 125 non-null float64
29 revenue2 125 non-null float64
30 salescost2 125 non-null float64
31 sga2 125 non-null float64
32 salary2 125 non-null float64
33 noi2 125 non-null float64
34 noe2 125 non-null float64
35 interest2 125 non-null float64
36 ctax2 125 non-null float64
37 profit2 125 non-null float64
38 liquidAsset2 125 non-null float64
39 quickAsset2 125 non-null float64
40 receivableS2 125 non-null float64
41 inventoryAsset2 125 non-null float64
42 nonCAsset2 125 non-null float64
43 tanAsset2 125 non-null float64
44 OnonCAsset2 125 non-null float64
45 receivableL2 125 non-null float64
46 debt2 125 non-null float64
47 liquidLiabilities2 125 non-null float64
48 shortLoan2 125 non-null float64
49 NCLiabilities2 125 non-null float64
50 longLoan2 125 non-null float64
51 netAsset2 125 non-null float64
52 surplus2 125 non-null float64
53 employee1 116 non-null float64
54 employee2 109 non-null float64
55 ownerChange 112 non-null object
56 open_year 126 non-null float64
57 open_month 126 non-null float64
dtypes: float64(53), int64(2), object(3)
memory usage: 57.7+ KBtrain[train.columns.tolist()].head(2)| inst_id | OC | sido | sgg | bedCount | instkind | revenue1 | salescost1 | sga1 | salary1 | noi1 | noe1 | interest1 | ctax1 | profit1 | liquidAsset1 | quickAsset1 | receivableS1 | inventoryAsset1 | nonCAsset1 | tanAsset1 | OnonCAsset1 | receivableL1 | debt1 | liquidLiabilities1 | shortLoan1 | NCLiabilities1 | longLoan1 | netAsset1 | surplus1 | revenue2 | salescost2 | sga2 | salary2 | noi2 | noe2 | interest2 | ctax2 | profit2 | liquidAsset2 | quickAsset2 | receivableS2 | inventoryAsset2 | nonCAsset2 | tanAsset2 | OnonCAsset2 | receivableL2 | debt2 | liquidLiabilities2 | shortLoan2 | NCLiabilities2 | longLoan2 | netAsset2 | surplus2 | employee1 | employee2 | ownerChange | open_year | open_month | |
|---|---|---|---|---|---|---|---|---|---|---|---|---|---|---|---|---|---|---|---|---|---|---|---|---|---|---|---|---|---|---|---|---|---|---|---|---|---|---|---|---|---|---|---|---|---|---|---|---|---|---|---|---|---|---|---|---|---|---|---|
| 0 | 1 | 1 | choong | 73 | 175.0 | nursing_hospital | 4.217530e+09 | 0.0 | 3.961135e+09 | 2.033835e+09 | 15652441.0 | 15236236.0 | 13236236.0 | 31641798.0 | 225169678.0 | 1.012700e+09 | 997671878.0 | 470055740.0 | 15027807.0 | 2.514586e+09 | 2.360684e+09 | 143449600.0 | 0.0 | 682825991.0 | 201323700.0 | 0.0 | 481502291.0 | 351000000.0 | 2.844460e+09 | 1.496394e+09 | 4.297848e+09 | 0.0 | 4.057422e+09 | 2.063787e+09 | 16194675.0 | 29983354.0 | 15683046.0 | 18808074.0 | 207829685.0 | 830169459.0 | 816570489.0 | 523702570.0 | 13598970.0 | 2.548115e+09 | 2.386263e+09 | 145898600.0 | 0.0 | 758993742.0 | 222876855.0 | 0.0 | 536116887.0 | 390000000.0 | 2.619290e+09 | 1.271224e+09 | 62.0 | 64.0 | same | 2007 | 12 |
| 1 | 3 | 1 | gyeong | 32 | 410.0 | general_hospital | NaN | NaN | NaN | NaN | NaN | NaN | NaN | NaN | NaN | NaN | NaN | NaN | NaN | NaN | NaN | NaN | NaN | NaN | NaN | NaN | NaN | NaN | NaN | NaN | NaN | NaN | NaN | NaN | NaN | NaN | NaN | NaN | NaN | NaN | NaN | NaN | NaN | NaN | NaN | NaN | NaN | NaN | NaN | NaN | NaN | NaN | NaN | NaN | 801.0 | 813.0 | same | 1997 | 4 |
<svg xmlns="http://www.w3.org/2000/svg" height="24px"viewBox="0 0 24 24"
width="24px">
  <script>
    const buttonEl =
      document.querySelector('#df-073dd921-04d4-4d86-bae0-1b6fa8fa31eb button.colab-df-convert');
    buttonEl.style.display =
      google.colab.kernel.accessAllowed ? 'block' : 'none';

    async function convertToInteractive(key) {
      const element = document.querySelector('#df-073dd921-04d4-4d86-bae0-1b6fa8fa31eb');
      const dataTable =
        await google.colab.kernel.invokeFunction('convertToInteractive',
                                                 [key], {});
      if (!dataTable) return;

      const docLinkHtml = 'Like what you see? Visit the ' +
        '<a target="_blank" href=https://colab.research.google.com/notebooks/data_table.ipynb>data table notebook</a>'
        + ' to learn more about interactive tables.';
      element.innerHTML = '';
      dataTable['output_type'] = 'display_data';
      await google.colab.output.renderOutput(dataTable, element);
      const docLink = document.createElement('div');
      docLink.innerHTML = docLinkHtml;
      element.appendChild(docLink);
    }
  </script>
</div>
train = pd.get_dummies(train[train.columns.tolist()])
test = pd.get_dummies(test[test.columns.tolist()])set(train.columns) - set(test.columns){'OC', 'instkind_dental_clinic', 'sido_gangwon', 'sido_gwangju'}train.shape, test.shape((301, 77), (127, 74))feature_name = train.columns.tolist()
feature_name.remove(label_name)
feature_name.remove('sido_gangwon')
feature_name.remove('instkind_dental_clinic')
feature_name.remove('sido_gwangju')
feature_name['inst_id',
'sgg',
'bedCount',
'revenue1',
'salescost1',
'sga1',
'salary1',
'noi1',
'noe1',
'interest1',
'ctax1',
'profit1',
'liquidAsset1',
'quickAsset1',
'receivableS1',
'inventoryAsset1',
'nonCAsset1',
'tanAsset1',
'OnonCAsset1',
'receivableL1',
'debt1',
'liquidLiabilities1',
'shortLoan1',
'NCLiabilities1',
'longLoan1',
'netAsset1',
'surplus1',
'revenue2',
'salescost2',
'sga2',
'salary2',
'noi2',
'noe2',
'interest2',
'ctax2',
'profit2',
'liquidAsset2',
'quickAsset2',
'receivableS2',
'inventoryAsset2',
'nonCAsset2',
'tanAsset2',
'OnonCAsset2',
'receivableL2',
'debt2',
'liquidLiabilities2',
'shortLoan2',
'NCLiabilities2',
'longLoan2',
'netAsset2',
'surplus2',
'employee1',
'employee2',
'open_year',
'open_month',
'sido_busan',
'sido_choong',
'sido_daegu',
'sido_daejeon',
'sido_gyeon-in',
'sido_gyeong',
'sido_jeon',
'sido_sejong',
'sido_seoul',
'sido_ulsan',
'instkind_clinic',
'instkind_general_hospital',
'instkind_hospital',
'instkind_nursing_hospital',
'instkind_traditional_clinic',
'instkind_traditional_hospital',
'ownerChange_change',
'ownerChange_same']train = train.fillna(0)
test = test.fillna(0)# 데이터 분할
X_train = train[feature_name]
print(X_train.shape)
X_train.head(2)(301, 73)| inst_id | sgg | bedCount | revenue1 | salescost1 | sga1 | salary1 | noi1 | noe1 | interest1 | ctax1 | profit1 | liquidAsset1 | quickAsset1 | receivableS1 | inventoryAsset1 | nonCAsset1 | tanAsset1 | OnonCAsset1 | receivableL1 | debt1 | liquidLiabilities1 | shortLoan1 | NCLiabilities1 | longLoan1 | netAsset1 | surplus1 | revenue2 | salescost2 | sga2 | salary2 | noi2 | noe2 | interest2 | ctax2 | profit2 | liquidAsset2 | quickAsset2 | receivableS2 | inventoryAsset2 | nonCAsset2 | tanAsset2 | OnonCAsset2 | receivableL2 | debt2 | liquidLiabilities2 | shortLoan2 | NCLiabilities2 | longLoan2 | netAsset2 | surplus2 | employee1 | employee2 | open_year | open_month | sido_busan | sido_choong | sido_daegu | sido_daejeon | sido_gyeon-in | sido_gyeong | sido_jeon | sido_sejong | sido_seoul | sido_ulsan | instkind_clinic | instkind_general_hospital | instkind_hospital | instkind_nursing_hospital | instkind_traditional_clinic | instkind_traditional_hospital | ownerChange_change | ownerChange_same | |
|---|---|---|---|---|---|---|---|---|---|---|---|---|---|---|---|---|---|---|---|---|---|---|---|---|---|---|---|---|---|---|---|---|---|---|---|---|---|---|---|---|---|---|---|---|---|---|---|---|---|---|---|---|---|---|---|---|---|---|---|---|---|---|---|---|---|---|---|---|---|---|---|---|---|
| 0 | 1 | 73 | 175.0 | 4.217530e+09 | 0.0 | 3.961135e+09 | 2.033835e+09 | 15652441.0 | 15236236.0 | 13236236.0 | 31641798.0 | 225169678.0 | 1.012700e+09 | 997671878.0 | 470055740.0 | 15027807.0 | 2.514586e+09 | 2.360684e+09 | 143449600.0 | 0.0 | 682825991.0 | 201323700.0 | 0.0 | 481502291.0 | 351000000.0 | 2.844460e+09 | 1.496394e+09 | 4.297848e+09 | 0.0 | 4.057422e+09 | 2.063787e+09 | 16194675.0 | 29983354.0 | 15683046.0 | 18808074.0 | 207829685.0 | 830169459.0 | 816570489.0 | 523702570.0 | 13598970.0 | 2.548115e+09 | 2.386263e+09 | 145898600.0 | 0.0 | 758993742.0 | 222876855.0 | 0.0 | 536116887.0 | 390000000.0 | 2.619290e+09 | 1.271224e+09 | 62.0 | 64.0 | 2007 | 12 | 0 | 1 | 0 | 0 | 0 | 0 | 0 | 0 | 0 | 0 | 0 | 0 | 0 | 1 | 0 | 0 | 0 | 1 |
| 1 | 3 | 32 | 410.0 | 0.000000e+00 | 0.0 | 0.000000e+00 | 0.000000e+00 | 0.0 | 0.0 | 0.0 | 0.0 | 0.0 | 0.000000e+00 | 0.0 | 0.0 | 0.0 | 0.000000e+00 | 0.000000e+00 | 0.0 | 0.0 | 0.0 | 0.0 | 0.0 | 0.0 | 0.0 | 0.000000e+00 | 0.000000e+00 | 0.000000e+00 | 0.0 | 0.000000e+00 | 0.000000e+00 | 0.0 | 0.0 | 0.0 | 0.0 | 0.0 | 0.0 | 0.0 | 0.0 | 0.0 | 0.000000e+00 | 0.000000e+00 | 0.0 | 0.0 | 0.0 | 0.0 | 0.0 | 0.0 | 0.0 | 0.000000e+00 | 0.000000e+00 | 801.0 | 813.0 | 1997 | 4 | 0 | 0 | 0 | 0 | 0 | 1 | 0 | 0 | 0 | 0 | 0 | 1 | 0 | 0 | 0 | 0 | 0 | 1 |
<svg xmlns="http://www.w3.org/2000/svg" height="24px"viewBox="0 0 24 24"
width="24px">
  <script>
    const buttonEl =
      document.querySelector('#df-47aaf846-3fed-4922-9b36-0308f3ae6393 button.colab-df-convert');
    buttonEl.style.display =
      google.colab.kernel.accessAllowed ? 'block' : 'none';

    async function convertToInteractive(key) {
      const element = document.querySelector('#df-47aaf846-3fed-4922-9b36-0308f3ae6393');
      const dataTable =
        await google.colab.kernel.invokeFunction('convertToInteractive',
                                                 [key], {});
      if (!dataTable) return;

      const docLinkHtml = 'Like what you see? Visit the ' +
        '<a target="_blank" href=https://colab.research.google.com/notebooks/data_table.ipynb>data table notebook</a>'
        + ' to learn more about interactive tables.';
      element.innerHTML = '';
      dataTable['output_type'] = 'display_data';
      await google.colab.output.renderOutput(dataTable, element);
      const docLink = document.createElement('div');
      docLink.innerHTML = docLinkHtml;
      element.appendChild(docLink);
    }
  </script>
</div>
X_test = test[feature_name]
print(X_test.shape)
X_test.head(2)(127, 73)| inst_id | sgg | bedCount | revenue1 | salescost1 | sga1 | salary1 | noi1 | noe1 | interest1 | ctax1 | profit1 | liquidAsset1 | quickAsset1 | receivableS1 | inventoryAsset1 | nonCAsset1 | tanAsset1 | OnonCAsset1 | receivableL1 | debt1 | liquidLiabilities1 | shortLoan1 | NCLiabilities1 | longLoan1 | netAsset1 | surplus1 | revenue2 | salescost2 | sga2 | salary2 | noi2 | noe2 | interest2 | ctax2 | profit2 | liquidAsset2 | quickAsset2 | receivableS2 | inventoryAsset2 | nonCAsset2 | tanAsset2 | OnonCAsset2 | receivableL2 | debt2 | liquidLiabilities2 | shortLoan2 | NCLiabilities2 | longLoan2 | netAsset2 | surplus2 | employee1 | employee2 | open_year | open_month | sido_busan | sido_choong | sido_daegu | sido_daejeon | sido_gyeon-in | sido_gyeong | sido_jeon | sido_sejong | sido_seoul | sido_ulsan | instkind_clinic | instkind_general_hospital | instkind_hospital | instkind_nursing_hospital | instkind_traditional_clinic | instkind_traditional_hospital | ownerChange_change | ownerChange_same | |
|---|---|---|---|---|---|---|---|---|---|---|---|---|---|---|---|---|---|---|---|---|---|---|---|---|---|---|---|---|---|---|---|---|---|---|---|---|---|---|---|---|---|---|---|---|---|---|---|---|---|---|---|---|---|---|---|---|---|---|---|---|---|---|---|---|---|---|---|---|---|---|---|---|---|
| 0 | 2 | 139 | 300.0 | 6.682486e+10 | 0.0 | 6.565709e+10 | 3.223695e+10 | 4.314093e+09 | 4.901517e+09 | 1.775872e+09 | 76680000.0 | 503669196.0 | 2.591385e+10 | 2.438741e+10 | 724257978.0 | 1.526434e+09 | 4.807282e+10 | 4.629931e+10 | 746312240.0 | 0.0 | 6.769090e+10 | 5.426088e+10 | 3.805927e+10 | 1.343002e+10 | 6.319097e+09 | 6.295769e+09 | 8.944587e+09 | 6.360375e+10 | 0.0 | 6.261126e+10 | 3.016946e+10 | 4.076448e+09 | 4.332357e+09 | 1.578626e+09 | 218399804.0 | 5.181821e+08 | 2.498992e+10 | 2.367928e+10 | 1.237754e+09 | 1.310637e+09 | 4.650191e+10 | 4.356296e+10 | 796386240.0 | 0.0 | 5.540643e+10 | 5.068443e+10 | 3.714334e+10 | 4.720000e+09 | 4.690000e+09 | 1.608540e+10 | 8.944587e+09 | 693.0 | 693.0 | 1998.0 | 11.0 | 0 | 0 | 0 | 0 | 1 | 0 | 0 | 0 | 0 | 0 | 0 | 1 | 0 | 0 | 0 | 0 | 0 | 1 |
| 1 | 5 | 149 | 44.0 | 3.495758e+10 | 0.0 | 3.259270e+10 | 1.672254e+10 | 6.871024e+07 | 1.981033e+09 | 1.936455e+09 | 0.0 | 452555746.0 | 5.861727e+09 | 5.372198e+09 | 661028976.0 | 4.895291e+08 | 7.511010e+10 | 6.678648e+10 | 4500000.0 | 0.0 | 6.626737e+10 | 4.210945e+10 | 2.330000e+10 | 2.415791e+10 | 1.720000e+10 | 1.470447e+10 | 1.046277e+10 | 3.754253e+10 | 0.0 | 3.868523e+10 | 1.897732e+10 | 1.918022e+08 | 3.694365e+09 | 2.016114e+09 | 0.0 | -4.645265e+09 | 5.503720e+09 | 4.943368e+09 | 1.544307e+08 | 5.603519e+08 | 6.559379e+10 | 6.545302e+10 | 14500000.0 | 0.0 | 6.730838e+10 | 4.209828e+10 | 2.420000e+10 | 2.521009e+10 | 1.830000e+10 | 3.789135e+09 | 0.000000e+00 | 379.0 | 371.0 | 2016.0 | 3.0 | 0 | 0 | 0 | 0 | 0 | 0 | 0 | 0 | 0 | 0 | 0 | 0 | 1 | 0 | 0 | 0 | 0 | 1 |
<svg xmlns="http://www.w3.org/2000/svg" height="24px"viewBox="0 0 24 24"
   width="24px">
<path d="M0 0h24v24H0V0z" fill="none"/>
<path d="M18.56 5.44l.94 2.06.94-2.06 2.06-.94-2.06-.94-.94-2.06-.94 2.06-2.06.94zm-11 1L8.5 8.5l.94-2.06 2.06-.94-2.06-.94L8.5 2.5l-.94 2.06-2.06.94zm10 10l.94 2.06.94-2.06 2.06-.94-2.06-.94-.94-2.06-.94 2.06-2.06.94z"/><path d="M17.41 7.96l-1.37-1.37c-.4-.4-.92-.59-1.43-.59-.52 0-1.04.2-1.43.59L10.3 9.45l-7.72 7.72c-.78.78-.78 2.05 0 2.83L4 21.41c.39.39.9.59 1.41.59.51 0 1.02-.2 1.41-.59l7.78-7.78 2.81-2.81c.8-.78.8-2.07 0-2.86zM5.41 20L4 18.59l7.72-7.72 1.47 1.35L5.41 20z"/> <script>
const buttonEl =
document.querySelector('#df-0ae6d6a2-4f91-4804-84c7-d23049f0cc83 button.colab-df-convert');
buttonEl.style.display =
google.colab.kernel.accessAllowed ? 'block' : 'none';
async function convertToInteractive(key) {
const element = document.querySelector('#df-0ae6d6a2-4f91-4804-84c7-d23049f0cc83');
const dataTable =
await google.colab.kernel.invokeFunction('convertToInteractive',
[key], {});
if (!dataTable) return;
const docLinkHtml = 'Like what you see? Visit the ' +
'<a target="_blank" href=https://colab.research.google.com/notebooks/data_table.ipynb>data table notebook</a>'
+ ' to learn more about interactive tables.';
element.innerHTML = '';
dataTable['output_type'] = 'display_data';
await google.colab.output.renderOutput(dataTable, element);
const docLink = document.createElement('div');
docLink.innerHTML = docLinkHtml;
element.appendChild(docLink);
}
</script>
</div>y_train = train[label_name]
print(y_train.shape)
y_train.head(2)(301,)
0 1
1 1
Name: OC, dtype: int64X_train.shape,X_test.shape,y_train.shape((301, 73), (127, 73), (301,))y_train.value_counts(1)1 0.950166
0 0.049834
Name: OC, dtype: float64딥러닝
# SMOTE는 Synthetic Minority Over-sampling Technique의 약자로 합성 소수자 오버샘플링 기법입니다.
# X, y를 학습하고 다시 샘플링합니다(fit_resample).
from imblearn.over_sampling import SMOTE

sm = SMOTE(random_state = 42)
X_resample, y_resample = sm.fit_resample(X_train,y_train)
X_resample.shape, y_resample.shape
((572, 73), (572,))# X shape
X_train.shape, X_resample.shape((301, 73), (572, 73))# y shape
y_train.shape, y_resample.shape((301,), (572,))# y의 value_counts
y_train.value_counts()1 286
0 15
Name: OC, dtype: int64# 입력데이터 수 구하기
input_shape = X_resample.shape[1]
input_shape73# tf.keras.models.Sequential 로 입력-히든-출력(sigmoid) 레이어로 구성
model = tf.keras.models.Sequential([
tf.keras.layers.Dense(units = 128, input_shape = [input_shape]),
tf.keras.layers.Dense(128, activation='selu'),
tf.keras.layers.Dense(128, activation='selu'),
tf.keras.layers.Dropout(0.2),
tf.keras.layers.Dense(128, activation='selu'),
tf.keras.layers.Dropout(0.2),
tf.keras.layers.Dense(128, activation='selu'),
tf.keras.layers.Dense(1, activation='sigmoid')
])# 모델 컴파일
model.compile(optimizer = 'adam',
loss = 'binary_crossentropy',
metrics=['accuracy'])# 모델 요약
model.summary()Model: "sequential_3"
_________________________________________________________________
Layer (type) Output Shape Param #
=================================================================
dense_18 (Dense) (None, 128) 9472
dense_19 (Dense) (None, 128) 16512
dense_20 (Dense) (None, 128) 16512
dropout_4 (Dropout) (None, 128) 0
dense_21 (Dense) (None, 128) 16512
dropout_5 (Dropout) (None, 128) 0
dense_22 (Dense) (None, 128) 16512
dense_23 (Dense) (None, 1) 129
=================================================================
Total params: 75,649
Trainable params: 75,649
Non-trainable params: 0
_________________________________________________________________class PrintDot(tf.keras.callbacks.Callback):
def on_epoch_end(self, epoch, logs):
if epoch % 100 == 0: print('')
print('.', end='')
early_stop = tf.keras.callbacks.EarlyStopping(monitor='val_loss', patience=20)# 학습하기
# callbacks=[early_stop, PrintDot()]
# history
history = model.fit(X_resample, y_resample, epochs=1000, validation_split=0.2,
callbacks=[early_stop, PrintDot()], verbose=0)...........................................................................<keras.callbacks.History at 0x7fddaef410d0># 학습결과의 history 값을 가져와서 비교하기 위해 데이터프레임으로 변환
df_hist = pd.DataFrame(history.history)
df_hist.tail()| loss | accuracy | val_loss | val_accuracy | |
|---|---|---|---|---|
| 70 | 878323.625 | 0.923414 | 4.036087e+05 | 0.886957 |
| 71 | 641911.375 | 0.912473 | 1.904817e+06 | 0.747826 |
| 72 | 1718010.625 | 0.890591 | 2.168276e+06 | 0.765217 |
| 73 | 1829800.375 | 0.912473 | 7.250955e+05 | 0.886957 |
| 74 | 2249924.500 | 0.897155 | 2.952428e+06 | 0.826087 |
<svg xmlns="http://www.w3.org/2000/svg" height="24px"viewBox="0 0 24 24"
width="24px">
  <script>
    const buttonEl =
      document.querySelector('#df-8b55d0f5-048b-4f9a-85c3-c5a52675e8d4 button.colab-df-convert');
    buttonEl.style.display =
      google.colab.kernel.accessAllowed ? 'block' : 'none';

    async function convertToInteractive(key) {
      const element = document.querySelector('#df-8b55d0f5-048b-4f9a-85c3-c5a52675e8d4');
      const dataTable =
        await google.colab.kernel.invokeFunction('convertToInteractive',
                                                 [key], {});
      if (!dataTable) return;

      const docLinkHtml = 'Like what you see? Visit the ' +
        '<a target="_blank" href=https://colab.research.google.com/notebooks/data_table.ipynb>data table notebook</a>'
        + ' to learn more about interactive tables.';
      element.innerHTML = '';
      dataTable['output_type'] = 'display_data';
      await google.colab.output.renderOutput(dataTable, element);
      const docLink = document.createElement('div');
      docLink.innerHTML = docLinkHtml;
      element.appendChild(docLink);
    }
  </script>
</div>
# loss, accuracy 값 시각화
df_hist[["loss","val_loss"]].plot()<matplotlib.axes._subplots.AxesSubplot at 0x7fddaef54340>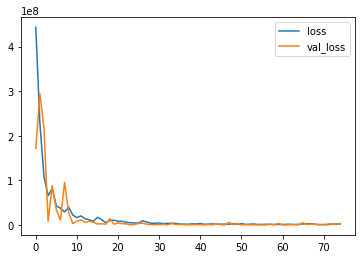
df_hist[["accuracy","val_accuracy"]].plot()<matplotlib.axes._subplots.AxesSubplot at 0x7fddaa9c5f70>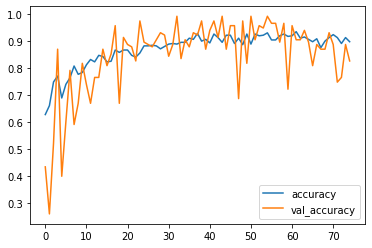
# 예측값을 y_pred 변수에 할당 후 재사용합니다.
y_pred = model.predict(X_test)
y_pred.shape
# 예측값을 1차원으로 변환
y_predict = y_pred.flatten()
4/4 [==============================] - 0s 4ms/stepsub = pd.read_csv("submission_sample.csv",encoding="cp949")sub.head(2)| inst_id | OC | |
|---|---|---|
| 0 | 2 | 0 |
| 1 | 5 | 0 |
<svg xmlns="http://www.w3.org/2000/svg" height="24px"viewBox="0 0 24 24"
width="24px">
  <script>
    const buttonEl =
      document.querySelector('#df-6249274e-a0a9-46b2-9dd6-d25a13b1e61c button.colab-df-convert');
    buttonEl.style.display =
      google.colab.kernel.accessAllowed ? 'block' : 'none';

    async function convertToInteractive(key) {
      const element = document.querySelector('#df-6249274e-a0a9-46b2-9dd6-d25a13b1e61c');
      const dataTable =
        await google.colab.kernel.invokeFunction('convertToInteractive',
                                                 [key], {});
      if (!dataTable) return;

      const docLinkHtml = 'Like what you see? Visit the ' +
        '<a target="_blank" href=https://colab.research.google.com/notebooks/data_table.ipynb>data table notebook</a>'
        + ' to learn more about interactive tables.';
      element.innerHTML = '';
      dataTable['output_type'] = 'display_data';
      await google.colab.output.renderOutput(dataTable, element);
      const docLink = document.createElement('div');
      docLink.innerHTML = docLinkHtml;
      element.appendChild(docLink);
    }
  </script>
</div>sub["OC"].shape(127,)sub["OC"] = y_predictsub["OC"].value_counts()1.0 119
0.0 8
Name: OC, dtype: int64file_name = "hospital_4.csv"
file_name'hospital_4.csv'# csv 파일로 저장합니다.
sub.to_csv(file_name, index=False)데이터 출처

배운걸 다 흡수하는 제로민