기본적으로 제공하는 chart 컨트롤을 사용하는데 x축 값의 font size 값을 조정하는 방법과 그외 chart control 설정값 정리
using WinChart = System.Windows.Forms.DataVisualization.Charting.Chart;
private static void AddChartArea(ref WinChart Chart, string X_Title, string Y_Title)
{
ChartArea ChartArea = new ChartArea();
ChartArea.BackColor = Color.FromArgb(0, 0, 0, 0); // 차트 영역 배경색 > 투명하게
ChartArea.AxisX.IntervalAutoMode = IntervalAutoMode.VariableCount; // 축 간격의 수 설정 > VariableCount는 축 길이에 맞춤
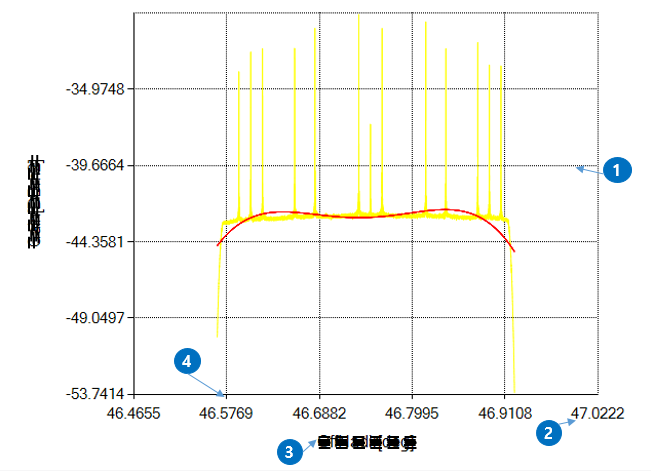
ChartArea.AxisX.TitleForeColor = Color.Black; // 축 Title 색 (그림에서 3번)
ChartArea.AxisX.LineWidth = 1; // 축 두께 (그림에서 4번의 가로 부분)
ChartArea.AxisX.TitleFont = new Font("Microsoft Sans Serif",12); // 축 Title의 (Font, size)설정 (그림에서 3번)
ChartArea.AxisX.LineColor = Color.Black; // 축 라인 색 (그림에서 4번 가로부분)
ChartArea.AxisX.MajorGrid.LineColor = Color.Black; // x축 주 모눈선 색 (그림에서 1번)
ChartArea.AxisX.MajorGrid.LineDashStyle = ChartDashStyle.Dot; // x축 주 모눈선 스타일 > Dot 은 점선으로 표시 (그림에서 1번)
ChartArea.AxisX.MajorGrid.Enabled = true; // x축 주 모눈선 도시할지 여부 (그림에서 1번)
ChartArea.AxisX.IsLabelAutoFit = false; // x축 값 크기를 자동으로 설정할지 여부 > 이 부분이 true면 아래에서 size 설정이 적용되지 않음
ChartArea.AxisX.LabelStyle.ForeColor = Color.Black; // x축 값 색 (그림에서 2번)
ChartArea.AxisX.LabelStyle.Font = new Font("Microsoft Sans Serif",11); // x축 값의 (Font, size) (그림에서 2번)
ChartArea.AxisX.MajorTickMark.LineColor = Color.Black; // x축 주 눈금 색 (그림에서 2번)
ChartArea.AxisX.Title = X_Title; // Title 텍스트 (그림에서 3번)
// y축에대한 설정
ChartArea.AxisY.LineColor = Color.Black;
ChartArea.AxisY.LineWidth = 1;
ChartArea.AxisY.TitleFont = new Font("Microsoft Sans Serif", 12);
ChartArea.AxisY.IsLabelAutoFit = false;
ChartArea.AxisY.LabelStyle.ForeColor = Color.Black;
ChartArea.AxisY.LabelStyle.Font = new Font("Microsoft Sans Serif", 11);
ChartArea.AxisY.TitleForeColor = Color.Black;
ChartArea.AxisY.MajorGrid.Enabled = true;
ChartArea.AxisY.MajorGrid.LineDashStyle = ChartDashStyle.Dot;
ChartArea.AxisY.MajorTickMark.LineColor = Color.Black;
ChartArea.AxisY.Title = Y_Title;
Chart.ChartAreas.Add(ChartArea);
}

주섬주섬..