Kubernetes(Pod 및 클러스터)를 Grafana로 모니터링하기 위해 몇 가지 방법이 존재하는데,
여기서는 Prometheus와 Exporters를 사용하는 방법을 소개합니다.
1. Prometheus와 Exporters를 사용하는 방법
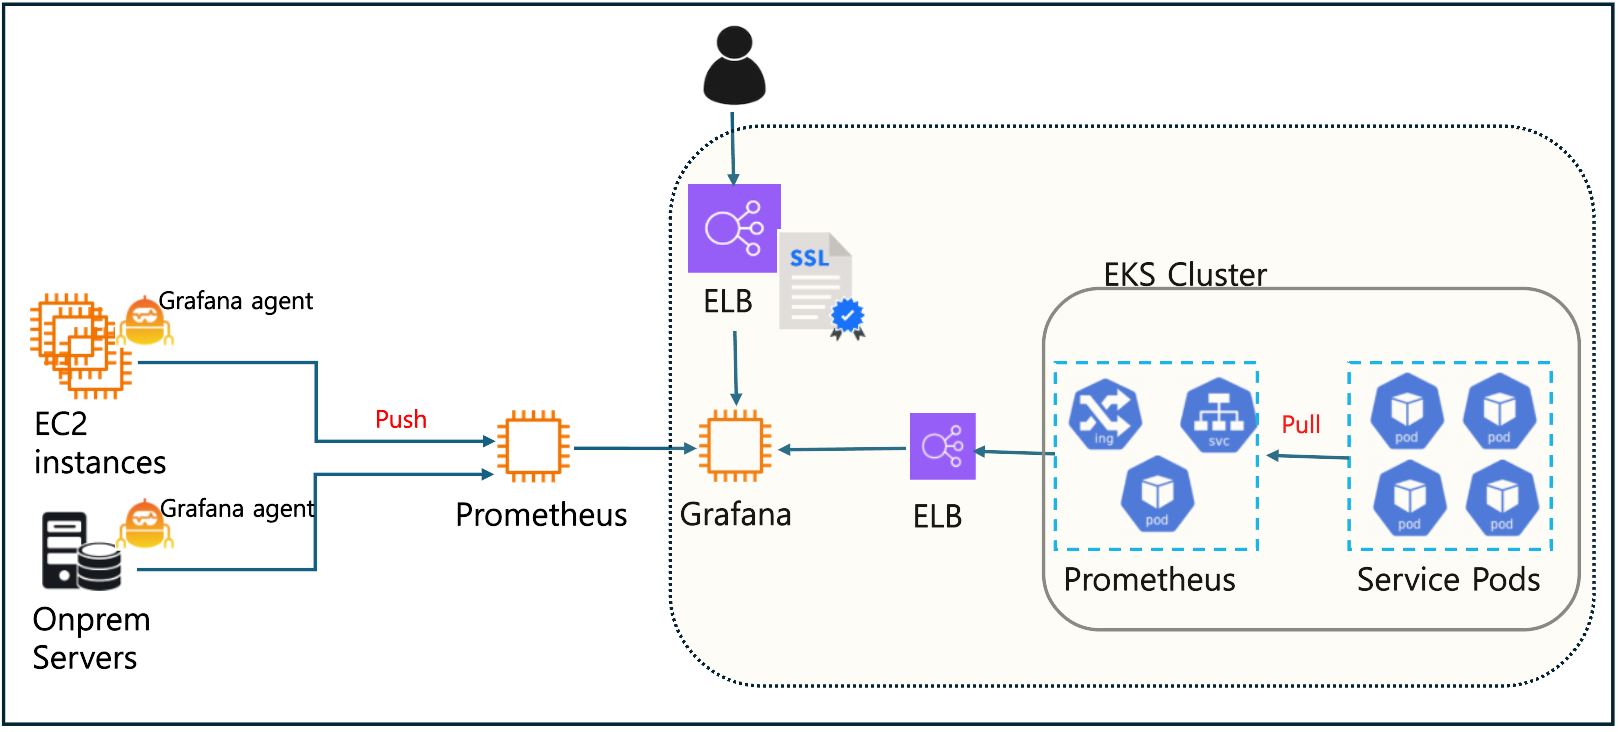
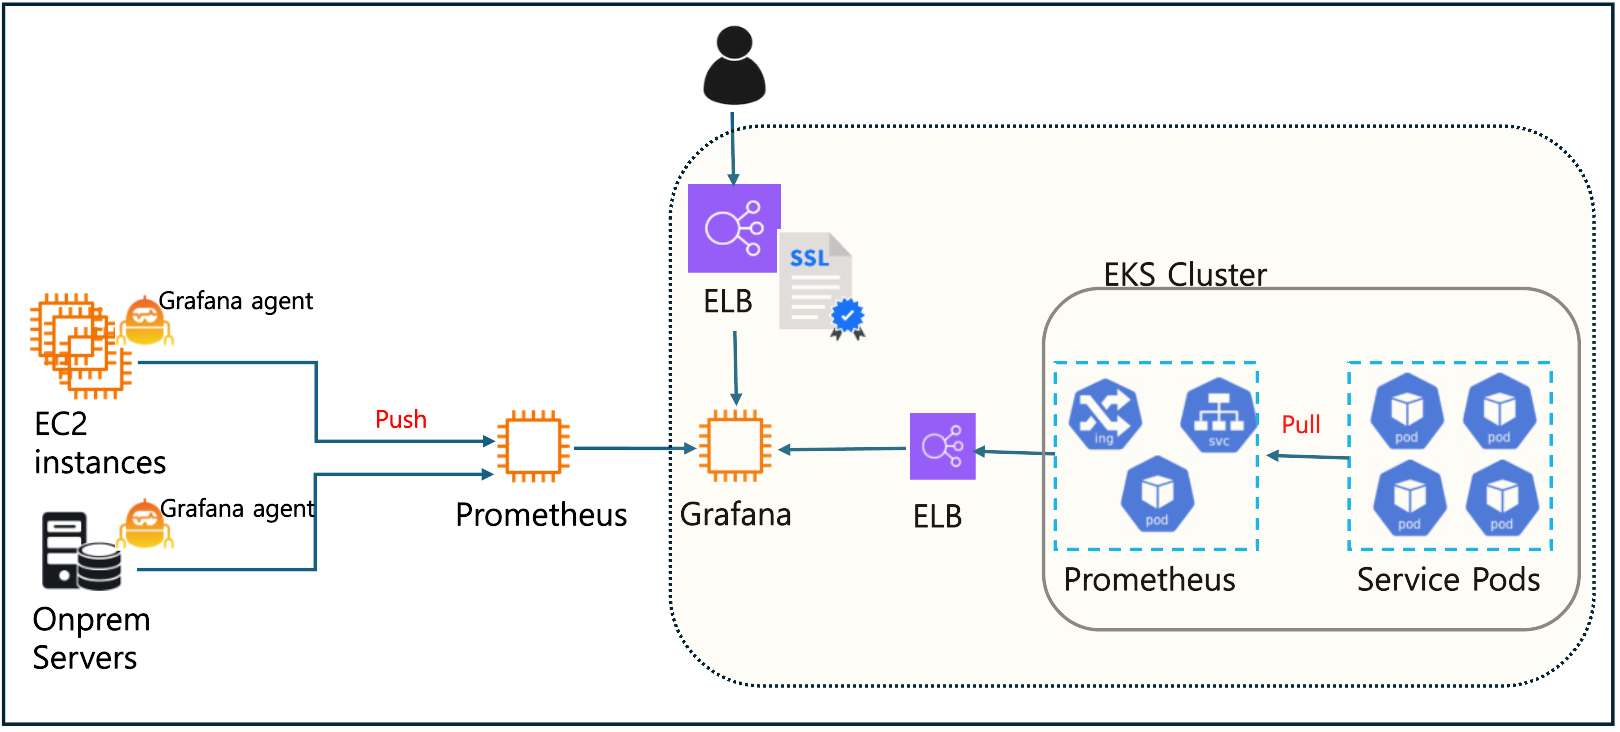
Prometheus는 Kubernetes 모니터링에서 가장 널리 사용되는 도구 중 하나입니다. Prometheus는 Kubernetes에서 메트릭을 스크랩(Pull 방식)하여 데이터를 수집하고, 이를 Grafana에서 시각화할 수 있습니다.
1.1) Prometheus 배포
-
Prometheus는 Kubernetes 클러스터 내부에서 Pod으로 배포됩니다.
-
아래와 같이 Helm 차트를 사용해서 간편하게 설치할 수 있습니다.
helm repo add prometheus-community https://prometheus-community.github.io/helm-charts
helm install prometheus prometheus-community/prometheus
-
Prometheus는 기본적으로 Kubernetes API 서버와 통신하여 메트릭을 수집합니다.
-
기타 comtomizing은 values.yaml 파일로 합니다.
1.2) Grafana 설치 및 Prometheus 연동
Grafana를 Kubernetes에 설치하거나 별도의 EC2 instance 등에 설치한 후, Prometheus를 데이터 소스로 구성합니다.
-
Helm 차트로 설치:
helm repo add grafana https://grafana.github.io/helm-charts
helm install grafana grafana/grafana -
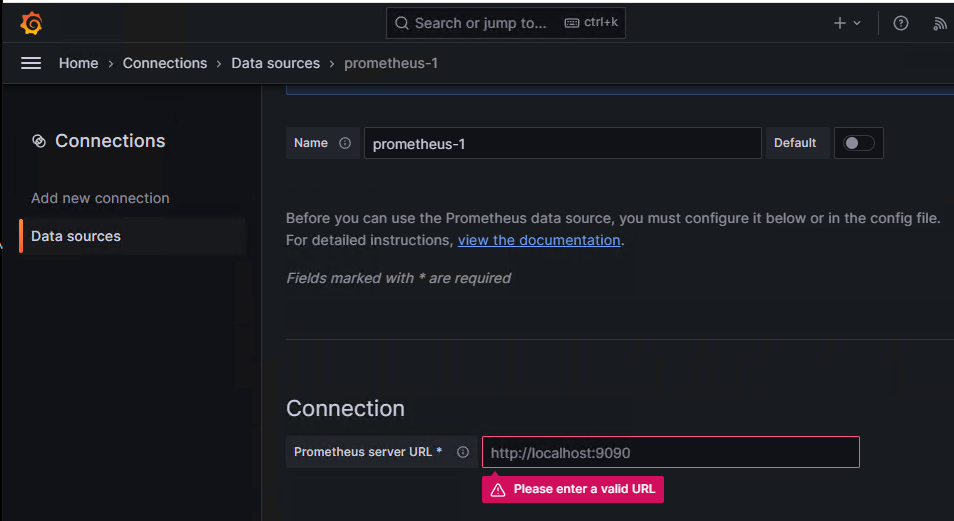
Grafana 콘솔에서 Prometheus를 데이터 소스로 추가
1) Grafana에 로그인 후 "Connections" > "Data Sources" > "Add Data Source" > Prometheus 선택.
2) Prometheus 서버 URL 입력(http://:9090).
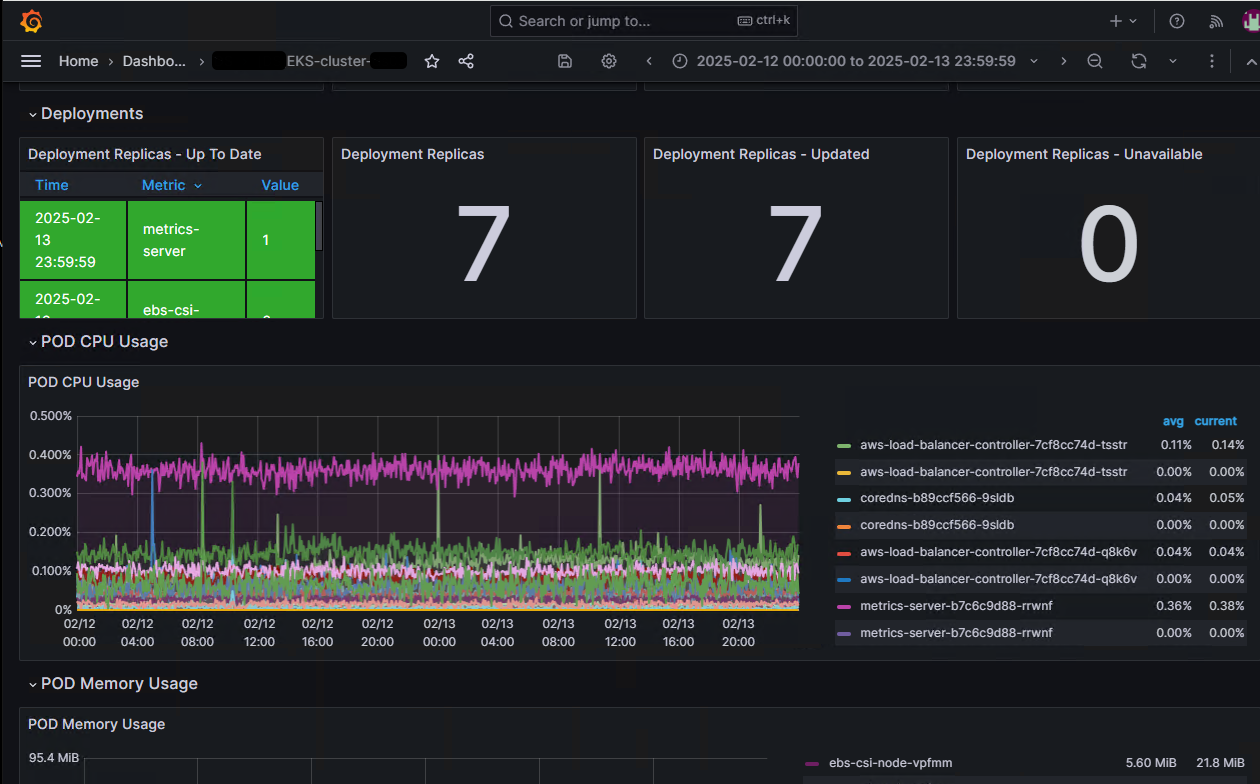
1.3) Kubernetes 대시보드 import
Grafana는 Kubernetes 리소스를 시각화하기 위한 대시보드 템플릿(ID)을 제공합니다. (※ Kubernetes 대시보드 ID: 315, 6417)
-
"Import" 버튼을 클릭해 대시보드를 불러옵니다.
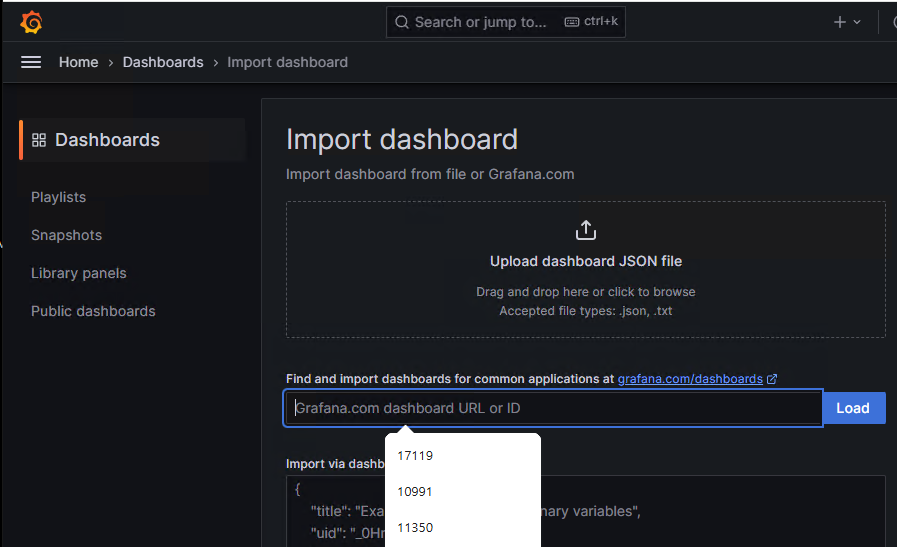
-
그 결과 Grafana 대시보드에서 EKS Cluster 내 kubernetes 리소스 모니터링이 가능합니다.