Prometheus와 Grafana를 연동하여 모니터링 환경을 구성할 때, 모니터링 대상 서버에서 데이터를 수집하기 위한 방법으로는 여러 가지가 있습니다. 그중에서 Grafana Agent를 설치하는 방식은 Prometheus와의 직접적인 데이터 수집 방식과는 다른 몇 가지 장점을 제공합니다.
1. Prometheus로 데이터 수집 방법
1.1) Prometheus 서버에서 직접 수집 (Pull 방식)
- 원 리
- Prometheus는 네트워크를 통해 대상 서버에 연결하여 데이터를 Pull 방식으로 스크랩 - 장 점
- Prometheus 기본 구성에 포함되어 있으며, 추가적인 소프트웨어 설치가 불필요 - 단 점
- 많은 대상 서버에서 데이터를 스크랩할 경우 Prometheus 서버의 부하가 커짐
1.2) Node Exporter
- 원 리
- Prometheus용 Exporter를 각 서버에 설치하여 시스템 메트릭, 애플리케이션 상태 등을 수집하고 Prometheus가 이를 스크랩하는 방식 - 장 점
- Prometheus에서 쉽게 데이터를 수집할 수 있는 Exporter 생태계(Node Exporter, MySQL Exporter, Redis Exporter 등)가 풍부함
- 대상 애플리케이션에 최적화된 메트릭을 제공 - 단 점
- Exporter마다 별도의 설정 및 설치가 필요하여 관리 복잡성이 증가할 수 있음
- Exporter는 메트릭 수집에 특화되어 있으므로, 로그 및 트레이싱 수집은 추가적인 도구가 필요
1.3) Pushgateway 사용 (Push & Pull 방식)
- 원 리
- 서버에 Pushgateway를 설치하고, 메트릭 데이터를 Pushgateway에 푸시(전송)하면 Prometheus가 Pushgateway로부터 데이터를 수집(Pull) - 적용 사례
- 단기 데이터 저장
1.4) Grafana agent (Push 방식)
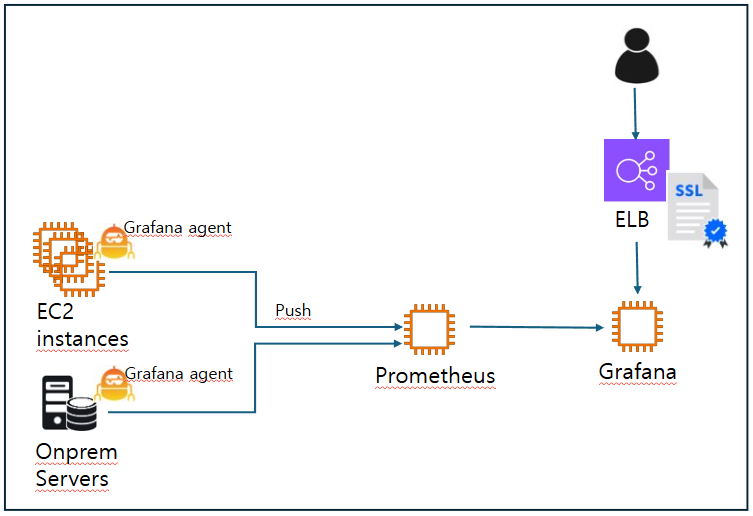
- Grafana Agent는 Prometheus의 경량화된 데이터 수집기입니다. Prometheus 서버에서 모든 메트릭을 직접 수집하는 대신, Grafana Agent를 사용하면 메트릭을 수집하여 지정된 원격 저장소(예: Prometheus 서버로 원격 쓰기)를 통해 전송할 수 있습니다.
- Grafana Agent는 데이터를 로컬에서 수집하고, 원격 저장소로 전송하는 방식(Push)입니다.
2. Grafana agent 설치
2.1) Windows
- Windows용 agent 다운로드
[agent 최신 버전]
-
Grafana Agent config 수정
C:\Program Files\Grafana Agent\agent-config.yaml 수정
-
Grafana Agent 서비스 재시작
net stop "Grafana Agent" & net start "Grafana Agent"
2.2) Linux
- Grafana repository 추가
vi /etc/yum.repos.d/grafana.repo
[grafana]
name=grafana
baseurl=https://rpm.grafana.com
repo_gpgcheck=1
enabled=1
gpgcheck=1
gpgkey=https://rpm.grafana.com/gpg.key
sslverify=1
sslcacert=/etc/pki/tls/certs/ca-bundle.crt
- grafana agent 설치
yum install grafana-agent
Grafana agent config 설정
- agent config 파일 경로
/etc/grafana-agent.yaml
Target의 유형에 따라 알맞은 형태로 endpoint를 기술합니다.
<기본값>
server:
  log_level: warn

metrics:
  global:
    scrape_interval: 1m
  wal_directory: '/var/lib/grafana-agent'
  configs:
    # Example Prometheus scrape configuration to scrape the agent itself for metrics.
    # This is not needed if the agent integration is enabled.
    # - name: agent
    #   host_filter: false
    #   scrape_configs:
    #     - job_name: agent
    #       static_configs:
    #         - targets: ['127.0.0.1:9090']

integrations:
  agent:                                   // metric을 Grafana agent에서 수집
    enabled: true
  node_exporter:                           // metric을 Linux OS에서 수집
    enabled: true
    include_exporter_metrics: true
    disable_collectors:
      - "mdadm"
< Target이 AMP일 경우 >
server:
  log_level: warn

metrics:
  global:
    scrape_interval: 15s
  wal_directory: '/var/lib/grafana-agent'
  configs:
    # Example Prometheus scrape configuration to scrape the agent itself for metrics.
    # This is not needed if the agent integration is enabled.
    # - name: agent
    - name: agent
       host_filter: false
       scrape_configs:
         - job_name: agent
           static_configs:
             - targets: ['127.0.0.1:12345']

integrations:
  agent:
    #enabled: true
    enabled: false
  node_exporter:
    enabled: true
    include_exporter_metrics: true
    disable_collectors:
      - "mdadm"

  prometheus_remote_write:
   - url: https://aps-workspaces.us-west-2.amazonaws.com/workspaces/ws-5467c113-4851-4e6d-bb70-2e53046b7dae/api/v1/remote_write
     sigv4:
       region: us-west-2
       access_key: AKIAVxxxxxxxWNGLN          // IAM 주체와 연결된 보안 액세스 키 및 액세스 키 ID를 사용하여 요청에 서명해야 함
       secret_key: M/vrUyjx/xxxxxxxxxx/xxxxxxOekA8lG
< Target이 일반 Prometheus일 경우 >
server:
  log_level: warn

metrics:
  global:
    scrape_interval: 15s
  wal_directory: '/var/lib/grafana-agent'
  configs:
    - name: agent
      host_filter: false
      scrape_configs:
        - job_name: agent
          static_configs:
            - targets: ['127.0.0.1:12345']

integrations:
  agent:
    enabled: false
  node_exporter:
    enabled: true
    include_exporter_metrics: true
    disable_collectors:
      - "mdadm"

  prometheus_remote_write:
    - url: http://monitoring-p.company.com:9090/api/v1/write
서비스 시작
< run the service >
systemctl start grafana-agent
< configure the Grafana Agent to restart at boot >
systemctl enable grafana-agent.service
< check the logs of running agent >
journalctl -u grafana-agent
참조 문서