US Dollar
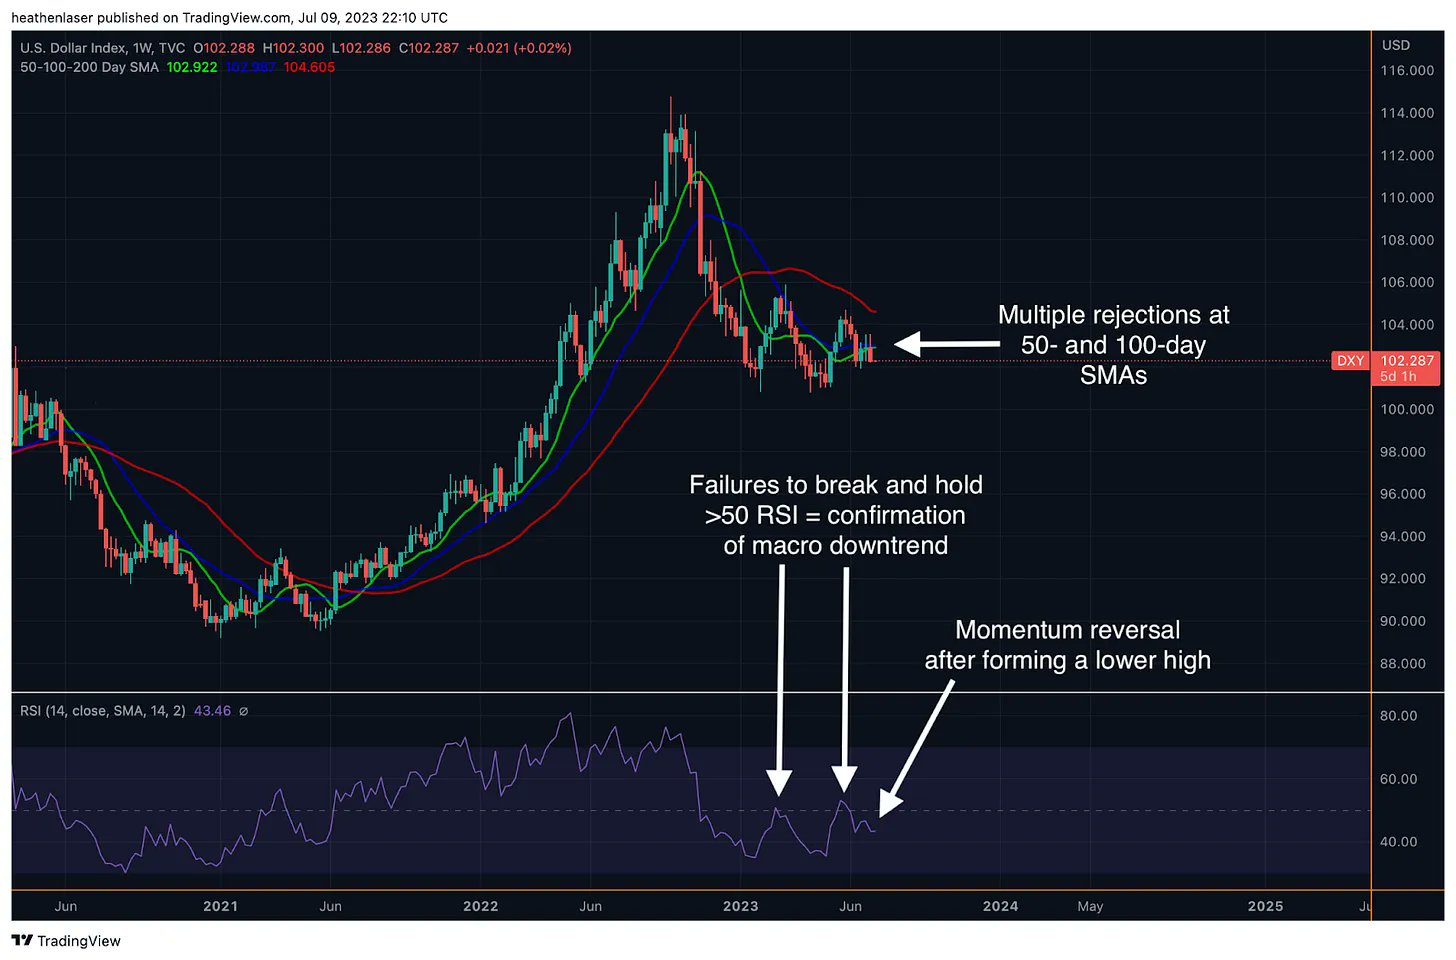
The U.S. dollar has continued to remain resilient above the ever-crucial 100 mark, but late last week, it finally began to show some signs of cracking. Let's explore in a short 🧵
Not only did it fail at the 50-RSI mark on its weekly chart, it has also fallen back below its 50-day (green line) and 100-day (blue line) moving averages (MAs) which now appear to have become resistance, at least for the time being.
In fact, the rates market is now pricing in an additional 25 basis-point hike coming at July’s FOMC, followed by a prolonged period of “higher for longer,” as speculators have now formally capitulated on any hopes for a cutting cycle to begin in 2023.
This discrepancy between the dollar’s fundamentals and DXY’s price action is telling us that the long dollar trade is now overcrowded due to the rates market at long last capitulating, and as a result, new sub-100 lows may finally be on the menu before summer is up.
Gold may be hinting at the same conclusion…
To dive deeper into @JLabsJanitor’s thoughts on DXY and its interplay with BTC and Fed policy, check out his newest analysis.
Source Tweet - JarvisLabs
Bitcoin’s Next Target: A LUNA Leftover
Redbook
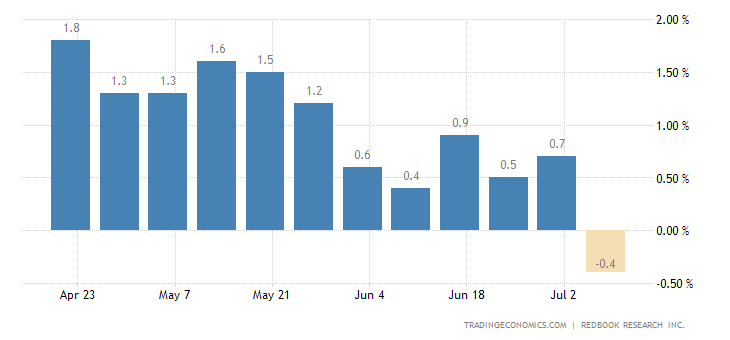
Redbook Retail sales goes negative for the first time since the COVID collapse.
-.4% year-over-year shrinkage in retail sales.
Capitulation - SPX 4543
RTY Small Caps
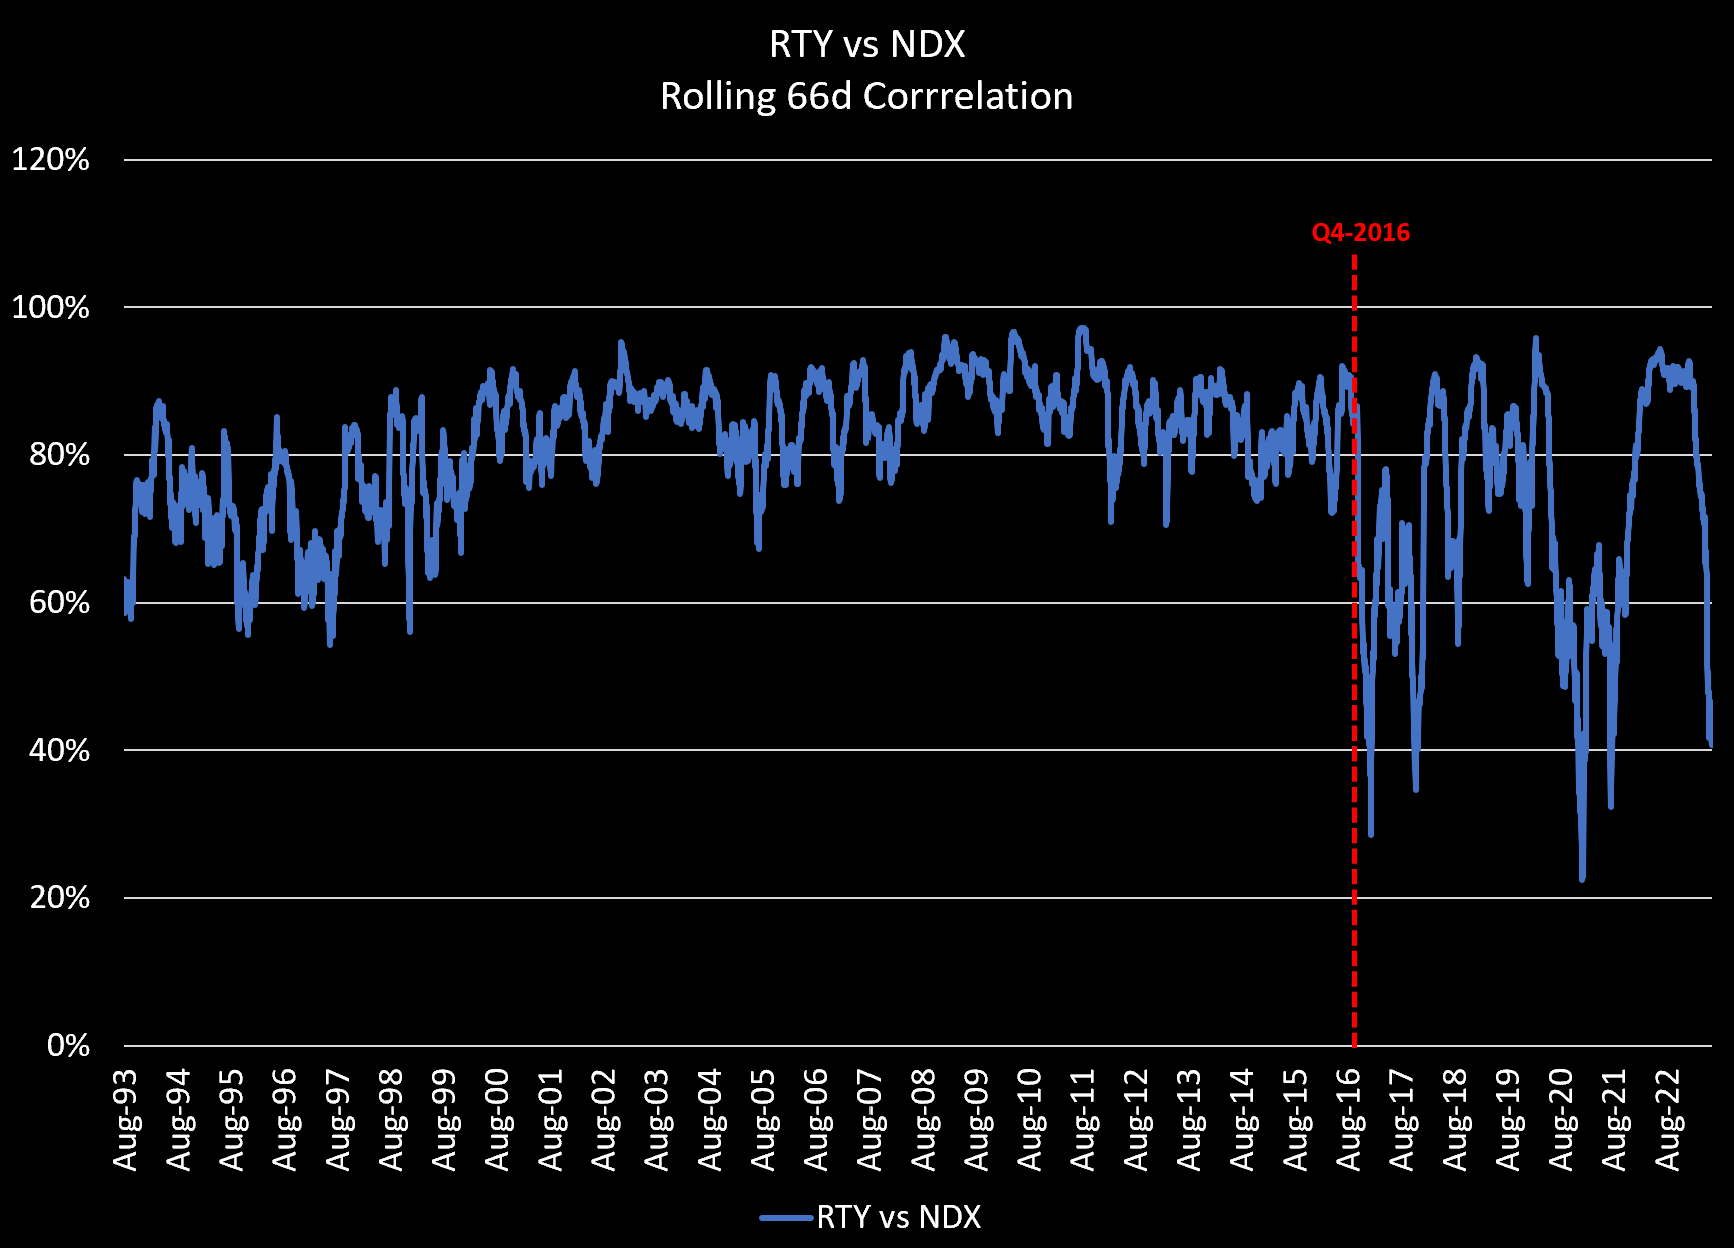
With small caps and unprofitable tech catching fire yesterday (unprofitable tech up 4%, $IWM up 1.7% vs $SPX only up 0.24%), we decided to take a deeper dive.
It turns out that there's been a notable structural shift in regime since 2016:
We don't have a ready explanation for why the shift on THIS date, but would note that the R2000 Growth, typically correlated to the Nasdaq 100, has actually been the source of this breakdown -- R2K Growth is no longer a proxy for the tech-heavy Nasdaq 100.
The obvious answer is that the Nasdaq is no longer a good proxy for growth; in fact, it shows a strongly negative correlation with the size factor and suggests the mega-cap dominated Nasdaq is increasingly the "default" investment... almost sounds like passive flows.
June CPI Estimates
Goldman Sachs expects a 0.23% increase in core that lowers the YoY rate to 4.93% (vs 5.3% in May) and a 0.25% increase in headline CPI that lowers the year-over-year rate to 3.08% (vs 4.0% in May).
UBS: Core +0.19% (+4.9% YoY), headline +0.18% (+3.0% YoY)
Citi: Core +0.26% (+5.0% YoY), headline +0.2% (+3.0% YoY)
Morgan Stanley: Core +0.27% (+5.0% YoY), headline +0.29% (+3.1% YoY)
BofA: Core +0.29% (+5.0% YoY), headline +0.27% (+3.1% YoY)
Barclays: Core +0.3% (+5.0% YoY), headline +0.25% (+3.1% YoY)
CPI - Disinflationary Base Effects
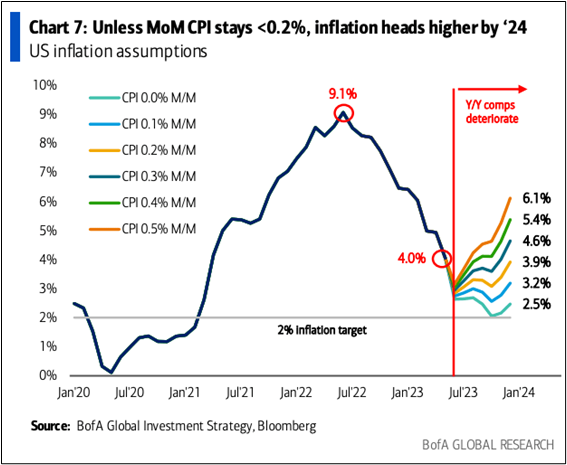
Nice chart from BofA showing how we are about to pass the peak of the disinflationary base effects.
With housing solid, employment strong, and wages still rising at 4.4% YoY... The easy part is over for disinflation. 9% to 4% was the easy part. 4% to 2% will probably be much more difficult to achieve.
Robinhood 24H
Crypto Institutional Flows
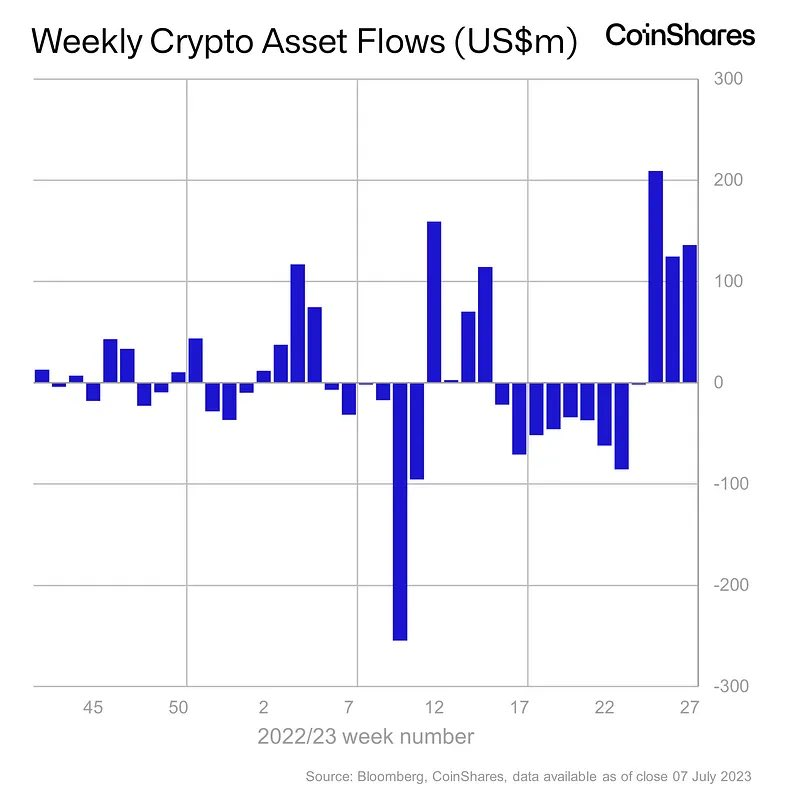
Institutional flows into #BTC remain strong… yet this size will look like a drop in the ocean if spot ETFs are approved.
The market has definitely not priced in 100s of billions (even trillions) of new $$$ inflow.
BTC vs BTC Equity
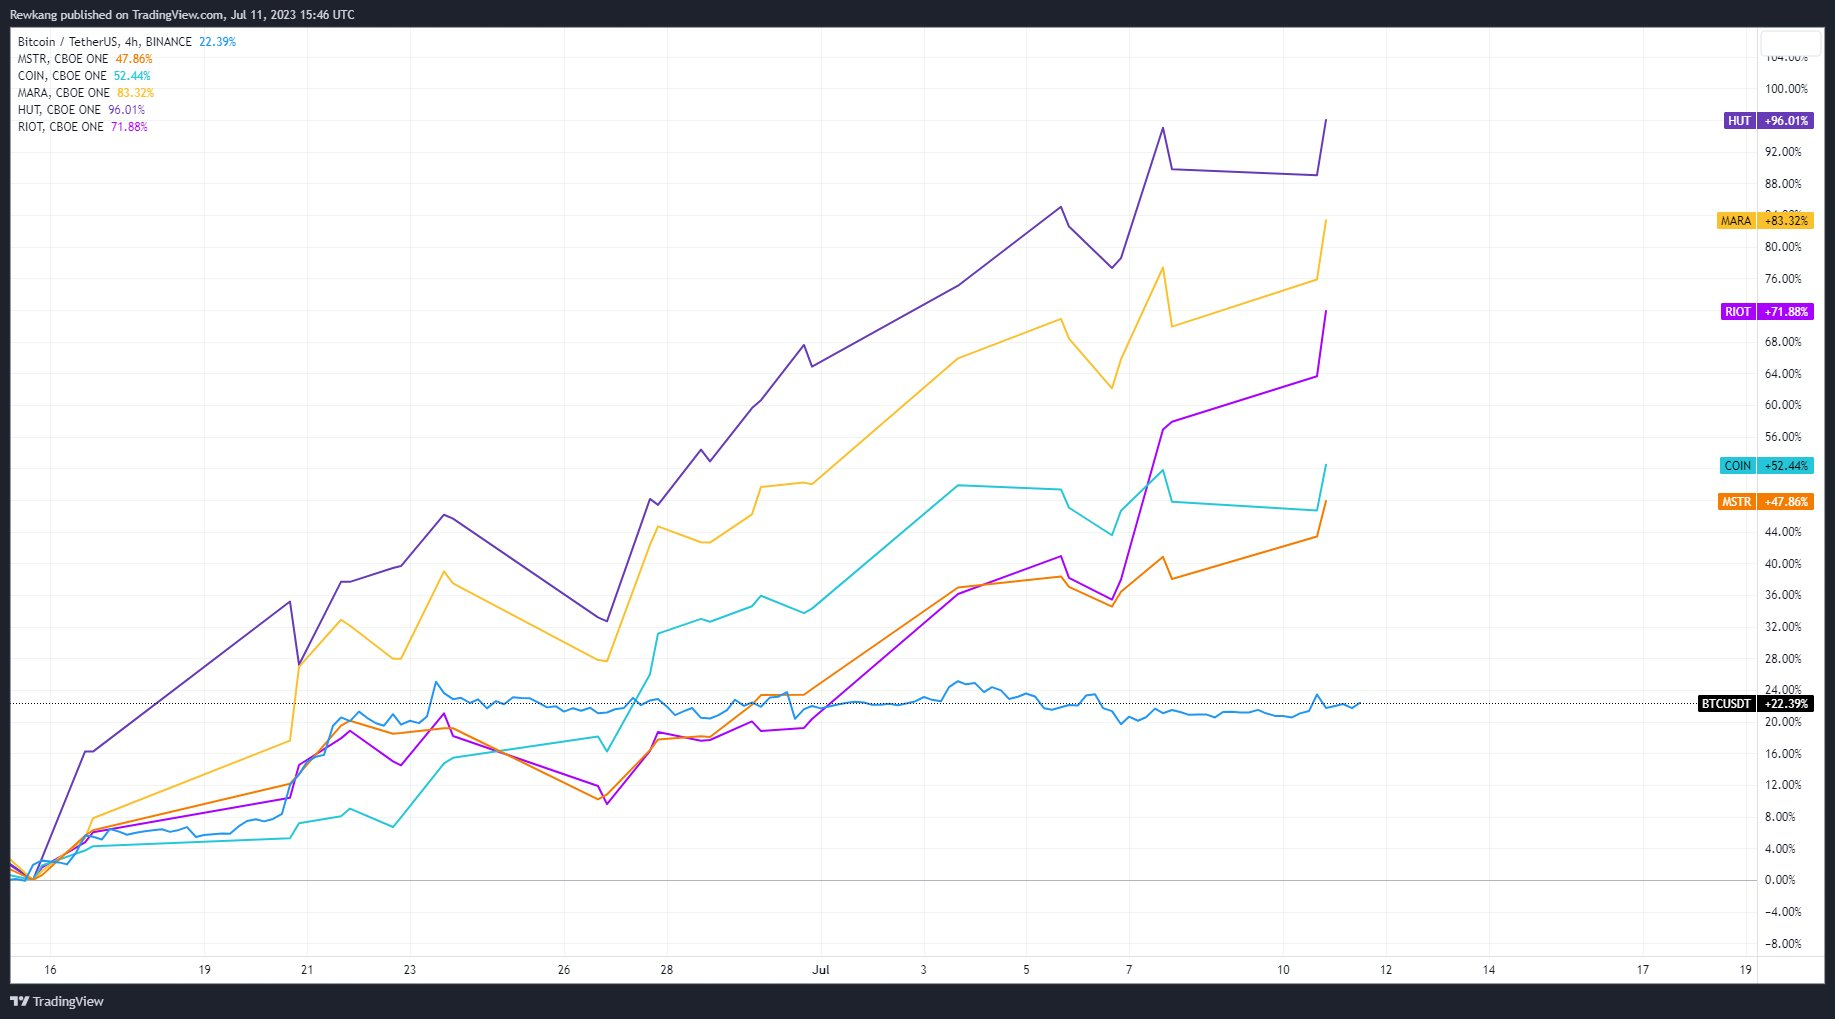
Bitcoin related equity outperformance vs BTC is an indication of big equity funds placing high expectations on $BTC ETF approval
These guys have seen dozens of ETFs approved during their careers
Seems as if crypto natives are underpricing approval likelihood and timeline
Expect that this trade becomes more and more crowded among HFs and HFs that aren't limited only to equities see $BTC as lagging with better value and tradfi flows start skewing there vs the equities
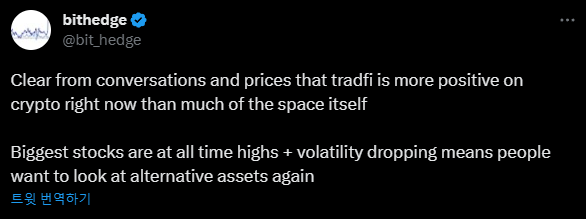
Alternative Assets
Comment
"Tech is now trading at a 54% premium to the market, its highest level in 45 years other than the dot com bubble, and well above its historical average premium of 26%. $QQQ
Moreover, while tech earnings growth is expected to be higher than the market's in 2024 (expectations may be too high), earnings growth is lower this year, and tech's five-year expected growth premium is inline with historical average levels. While earnings have declined for this year for tech and have increased for FY 24, the same has been the case for the broader market."
Bernstein