
PYUSD

Liquidity Regime Shifted?
It seems that the liquidity regime may have shifted here.
Since January, liquidity has been supportive of higher #BTC + risk assets generally.
However, last week, the US Treasury mentioned that it will expand it's debt issuance into the second half of the year --> sucking even more liquidity out of the market than previously anticipated.
While fresh issuance has not really been liquidity negative thus far, it has more potential to be so, now.
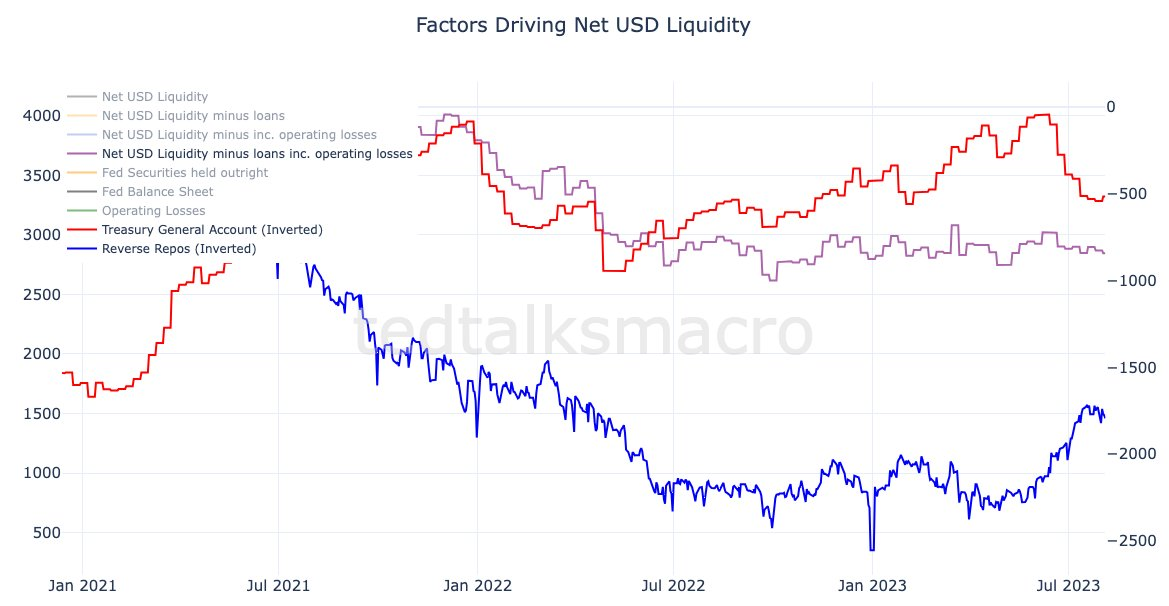
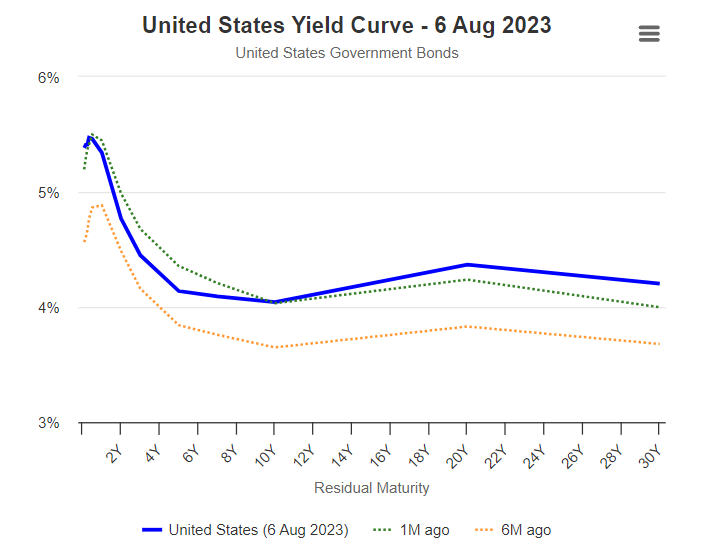
Since the debt ceiling jitters, and resulting approval to issue fresh debt. The Treasury's issuance has been short-dated and the balance sitting with the Fed in reverse-repo has been happy to absorb any negative liquidity impact from new issuance (see the blue line below) 👇
But the upcoming expanded issuance, is much longer-dated than the issuance thus far --> hence the move in the back end of the curve last week.
As the new issuance is longer dated AND the Fed have continued to raise rates, the balance sitting in reverse-repos will be harder to move... thus the ability of the market to absorb this fresh issuance from the treasury will become less-so --> potentially adding strains on the liquidity situation in the US.
Where previously, balance in RR were absorbed + padded liquidity sideways / higher, the new environment potentially sees liquidity sideways / lower as the Fed continue raising rates and conducting QT.
What does that mean?
More chop, and potentially lower for #BTC + equities into the second half of the year, all else remaining equal.
Weekly Crypto Asset Flows
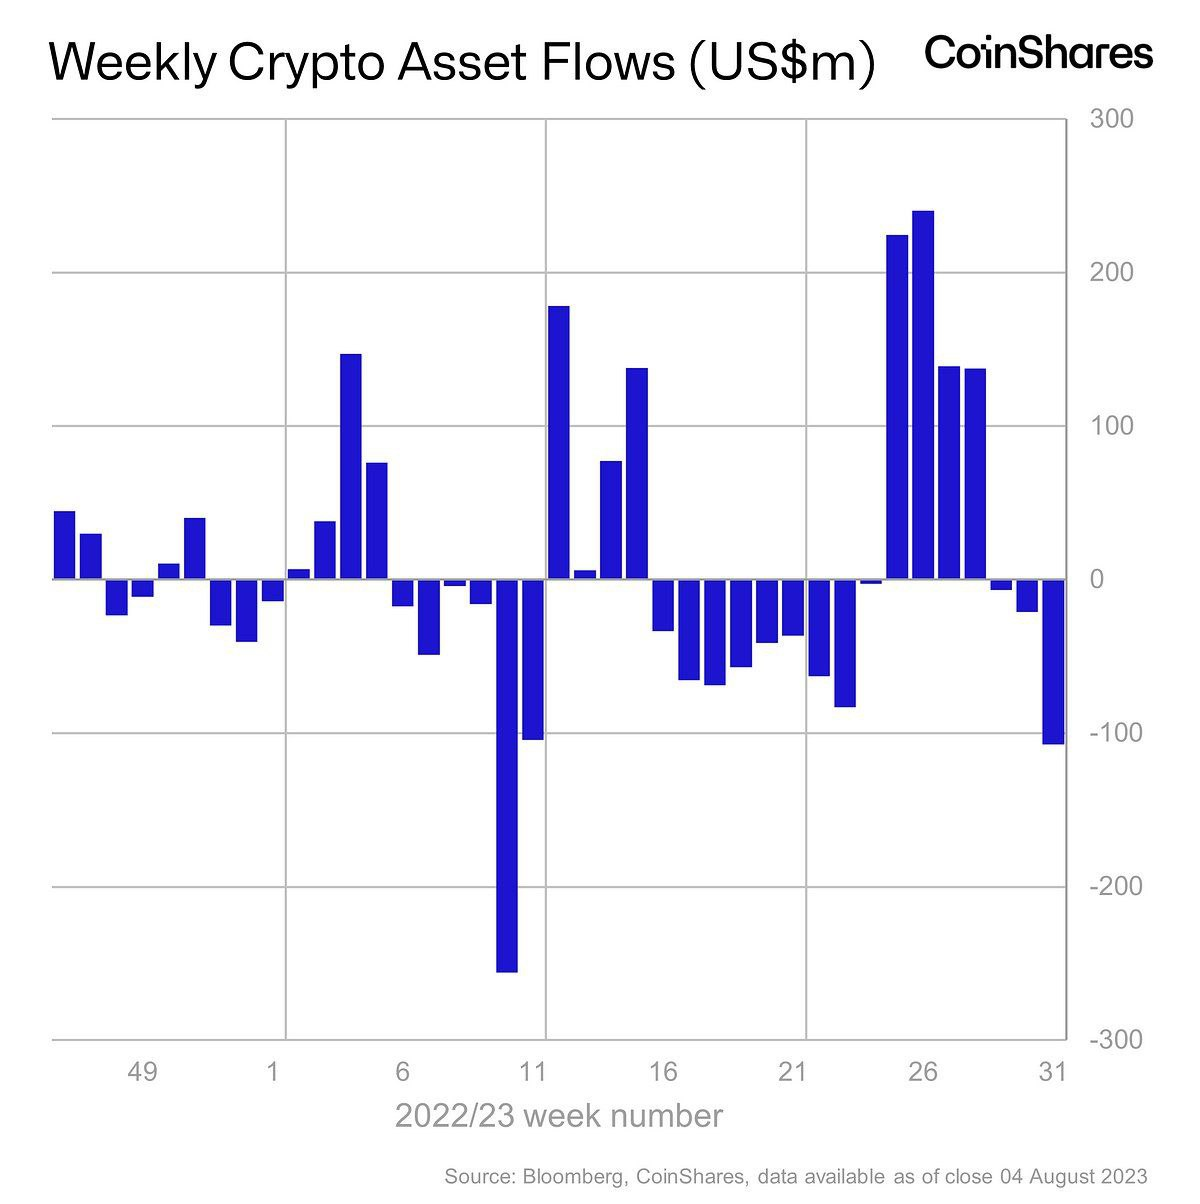
Volume 143: Digital Asset Fund Flows Weekly Report
Open Interest

For those who are misinformed, Open interest reflects market activity and capital inflow/outflow, but it doesn’t depend on spot Market cap.
Education is power
Theta
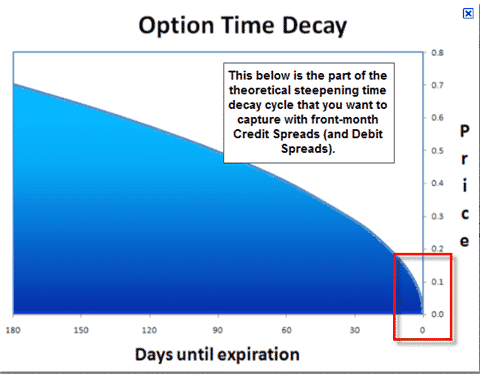
Theta is one of the most important tools for predicting how the price of options may change over time.
The Theta value of an option serves to indicate how the price of an option will change as the expiration date approaches.
It is important to note that Theta is not always accurate, nor does it have a linear relationship.
The Theta value of an option is expressed as a negative number and indicates the amount by which the price of an option will fall by each day.
For example, say you had a call option with a current price of $4 and a Theta of -0.10 and you wanted to predict the price in five days.
A Theta of -0.10 means that every day the option will experience a price drop of $0.10.
So after five days, the price of the option should fall to $3.50, all else being equal.
Note that while this simple example uses a linear relationship, in reality, the effect of Theta on an option’s price is non-linear.
As an option’s time to expiration nears, Theta begins to increase exponentially.
This is because as the expiration date gets closer, an option has less and less time to make a move, resulting in a decrease in the value of that option.
With markets closed over the weekend, at first glance, it would seem that there is an opportunity to profit from weekend time decay.
In practice, however, market makers prepare for this scenario by either adjusting the volatility or time to expiration.
This can occur as early as Thursday. It could be argued that it's better to sell options on Monday and buy them back on Friday.
Short-term options offer the highest theta decay, but there is always a trade-off and that comes in the form of higher gamma.
A lot of traders are lured into selling short-term options without understanding the risks they are taking.
Stable Coin Market
What is happening with the stablecoin landscape and why is $usdc losing the competition?
First of all, you need to understand how stablecoin issuers make money:
• Users deposit cash
• Get stablecoins in return
• Stablecoin issuer invests cash and earns interest on it
With the high "risk-free" US Treasuries bonds yield (5.3%-4.1%), this business became profitable as never before.
If a company issues $100b stablecoins and invests $80b in short-term bonds for a 5% yield, it will be making $4b annually.
Pretty decent revenue for such a simple service.
Now back to the stablecoin landscape. There are two main centralized stablecoin issuers - Circle (USDT).
Circle launched USDC 4 years after USDT and it picked an aggressive strategy to capture its market share - 0% minting and redemption fees, while Tether was charging 0.1%.
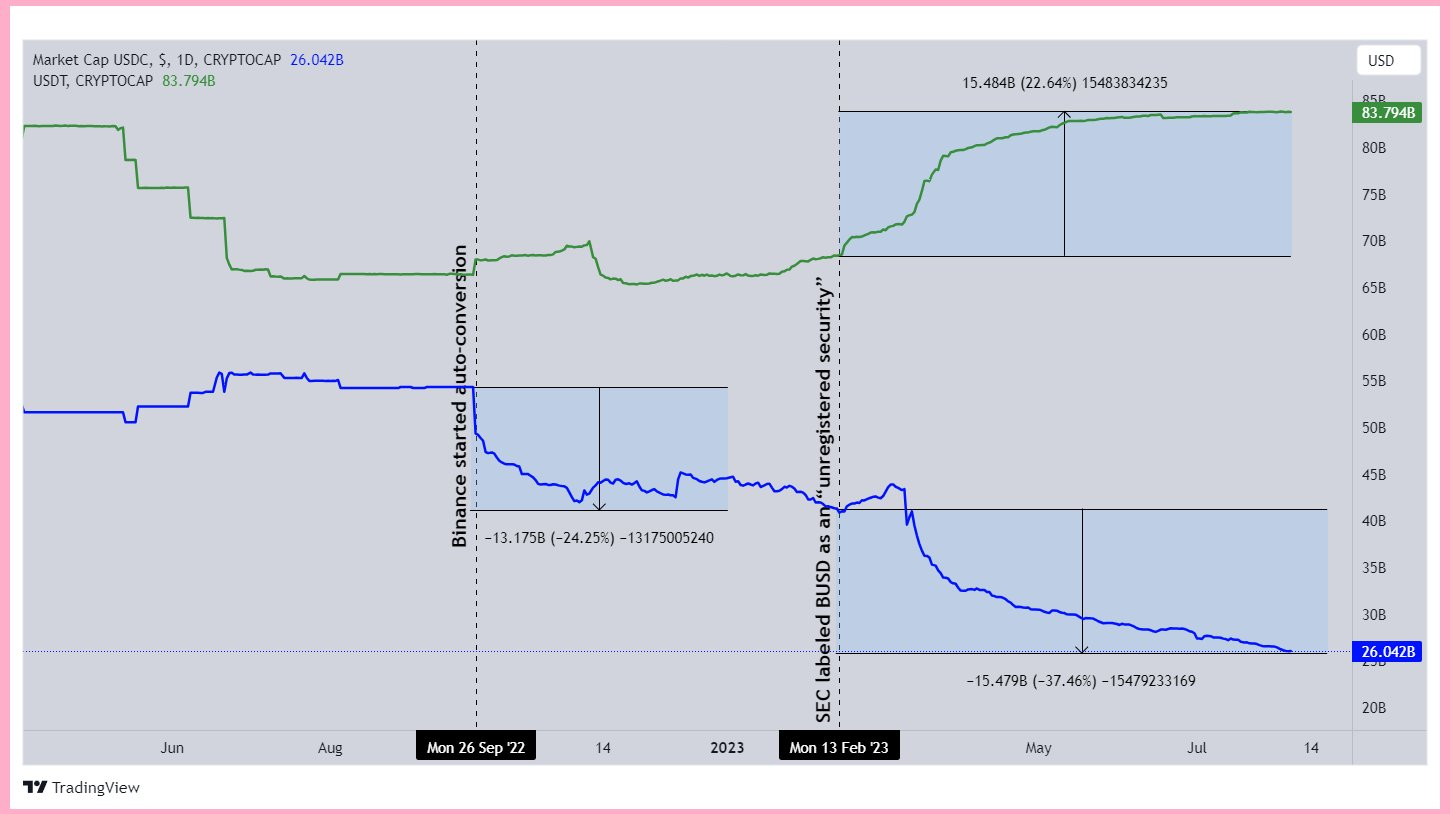
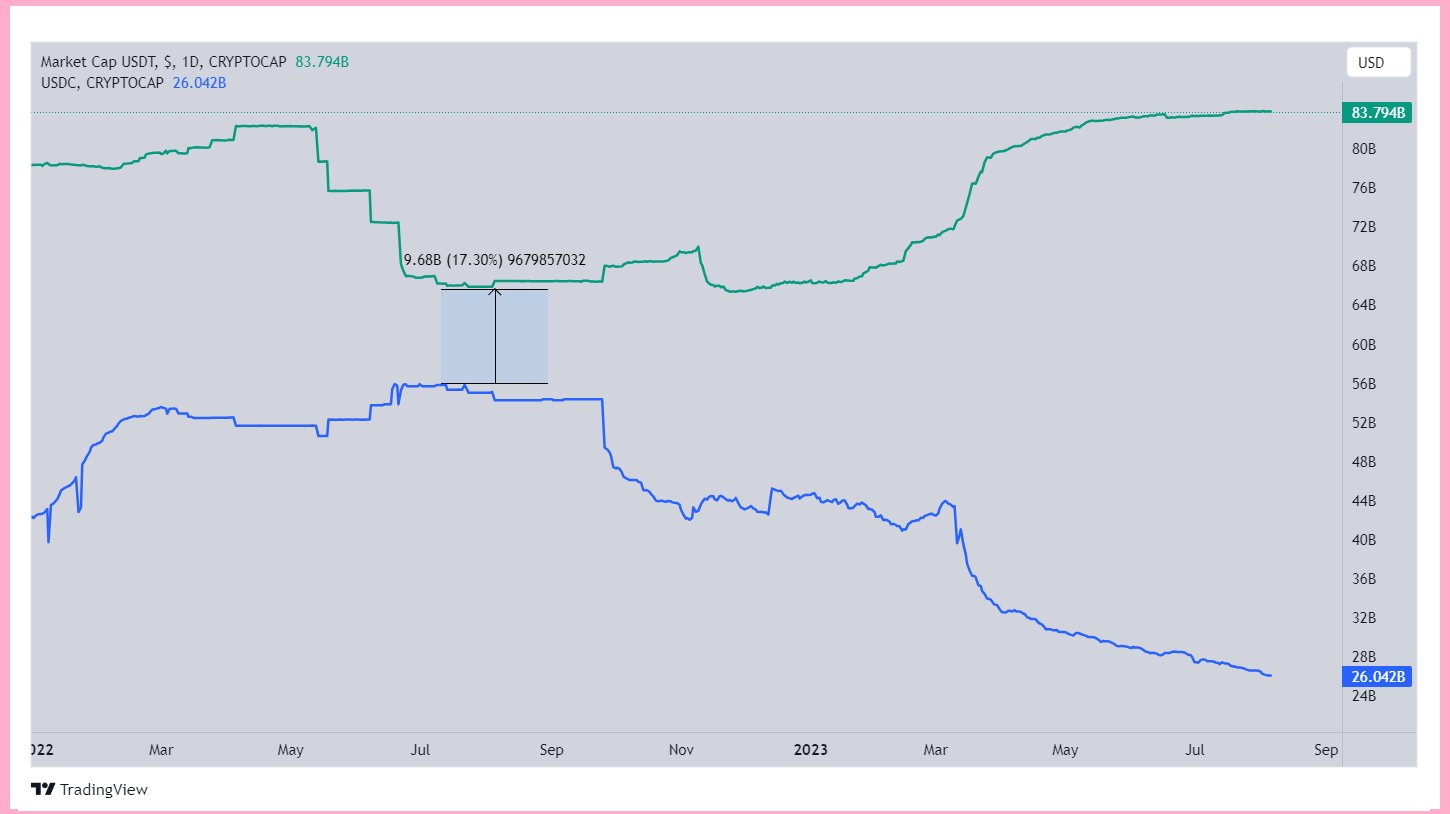
This resulted in only a $9b difference in Market Cap between $usdt ($65b) and $usdc ($56b) in July 2022.
At that moment there was one more player on the stablecoin market - #binance BUSD.
@cz_binance wanted to consolidate dollar liquidity with cash equivalent stables and realized that 0% minting/redemption fees are not only an advantage but also a weakness of $usdc.

Binance announced the auto-conversion of $USDC into $BUSD and delisted all USDC trading pairs.
It was a zero-cost decision that had to increase revenue and later decrease dependency on $USDT at Circle's cost. But guess what?
5 months later BUSD, a fully compliant stablecoin registered in New York, was labeled as an “unregistered security” by the SEC.
But what is not allowed for registered stablecoins is allowed for Tether.
Since February Tether started vamping Circle's cash reserves in a predatory way:
- Mint USDT
- Swap USDT for USDC
- Cash out USDC
- Deposit cash to back printed USDT
- Print more USDT with new cash
- Repeat
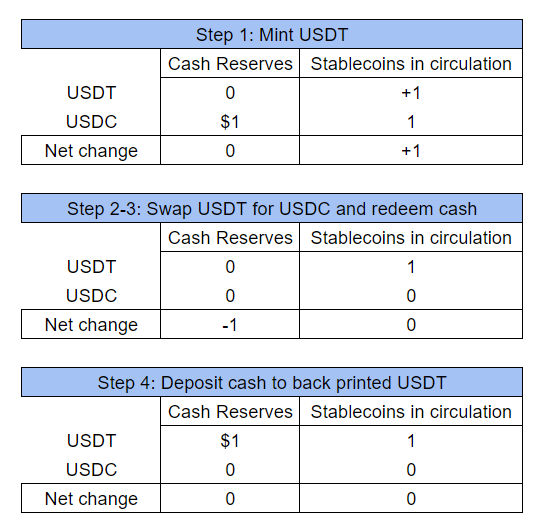
Here is a simple table that helps you to visualize the process:
From the above, we can see that there has been exactly $0 in net value creation.
Except Circle lost its cash reserves to Tether.
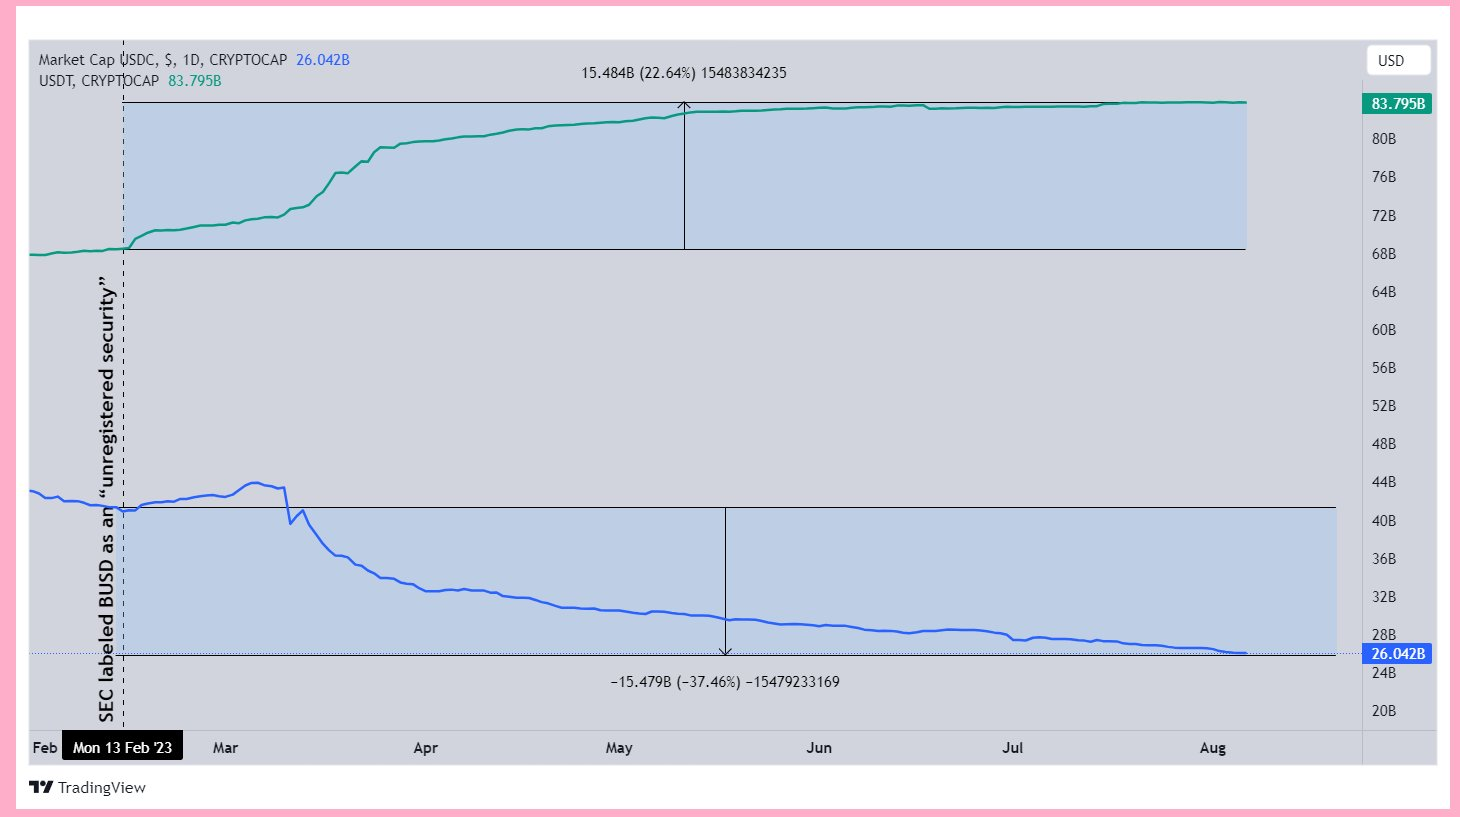
Since February Tether gained $15b MC while Circle has lost the same amount.
There is no proof that this is the exact same money leaving Circle and entering Tether but it makes the most sense for me.
It has a certain cost for Tether to swap USDT for USDC but with the present high yields they are covering their costs within a month.
Can two play this game? Theoretically - yes, in practice
Circle will need to buy $usdt. Then they will need to pass KYC/AMLwith Tether, then request, then Tether can review the KYC forever and then they can even increase the redemption fees.
The situation is not in the Circle's hands.
What would I expect next?
Firstly, I think that @circle has to find a way to protect reserves from Tether, for example, to introduce a redemption fee.
Secondly, I don't think CZ will leave the situation as it is and will stay in the hands of Tether.
He openly told that he has never seen a reserve audit from Tether and that Binance is working with/on other stablecoins.
For example, they recently listed $fdUSD, 1:1 USD-backed stablecoin issued in Hong Kong, from @FDLabsHQ.

Stablecoin market environment is very predatory and players won't leave a chance to the competitors no matter what.
Tether positioned itself in a favorable position when nobody knows where are the reserves and how to reach them.
Quod licet Iovi, non licet bovi
Winto Group
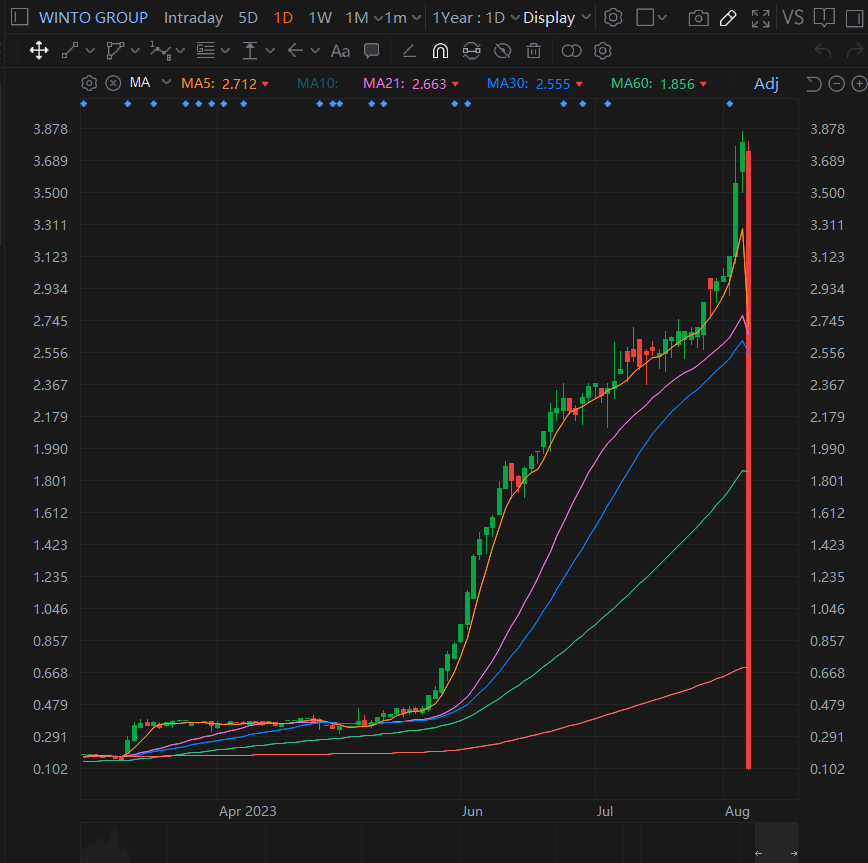
HK advertisement company Winto Group fell by 97.36% on Monday.The share price of the group has been rose by 35x YTD before the crash. The company has only a small amount of shares outstanding, so a small volume of trading can lead to huge fluctuations.
China Unemployment
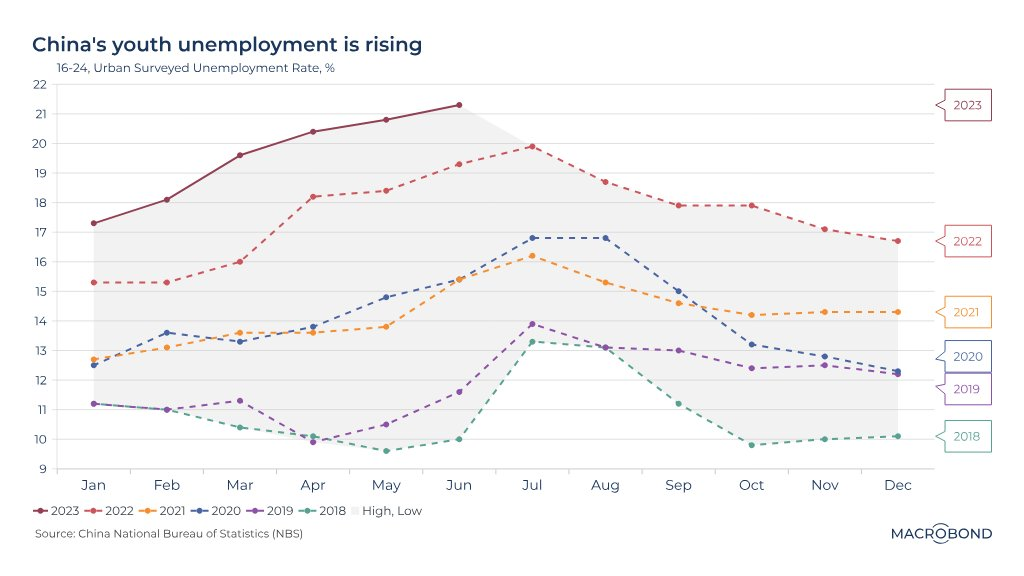
Youth unemployment in China continues to make record highs 👀
-
The jobless rate of 16 to 24 year olds in urban areas rose to 21.3% last month
-
While the government discusses stimulus measures, very little is being done to support the economy
Source Tweet - Markets & Mayhem
EU-China
It took a while, but it seems like the Commission has finally taken note of the EU's “staggering” deficit in its trade with China ...
EU trade chief to push China on barriers to exports
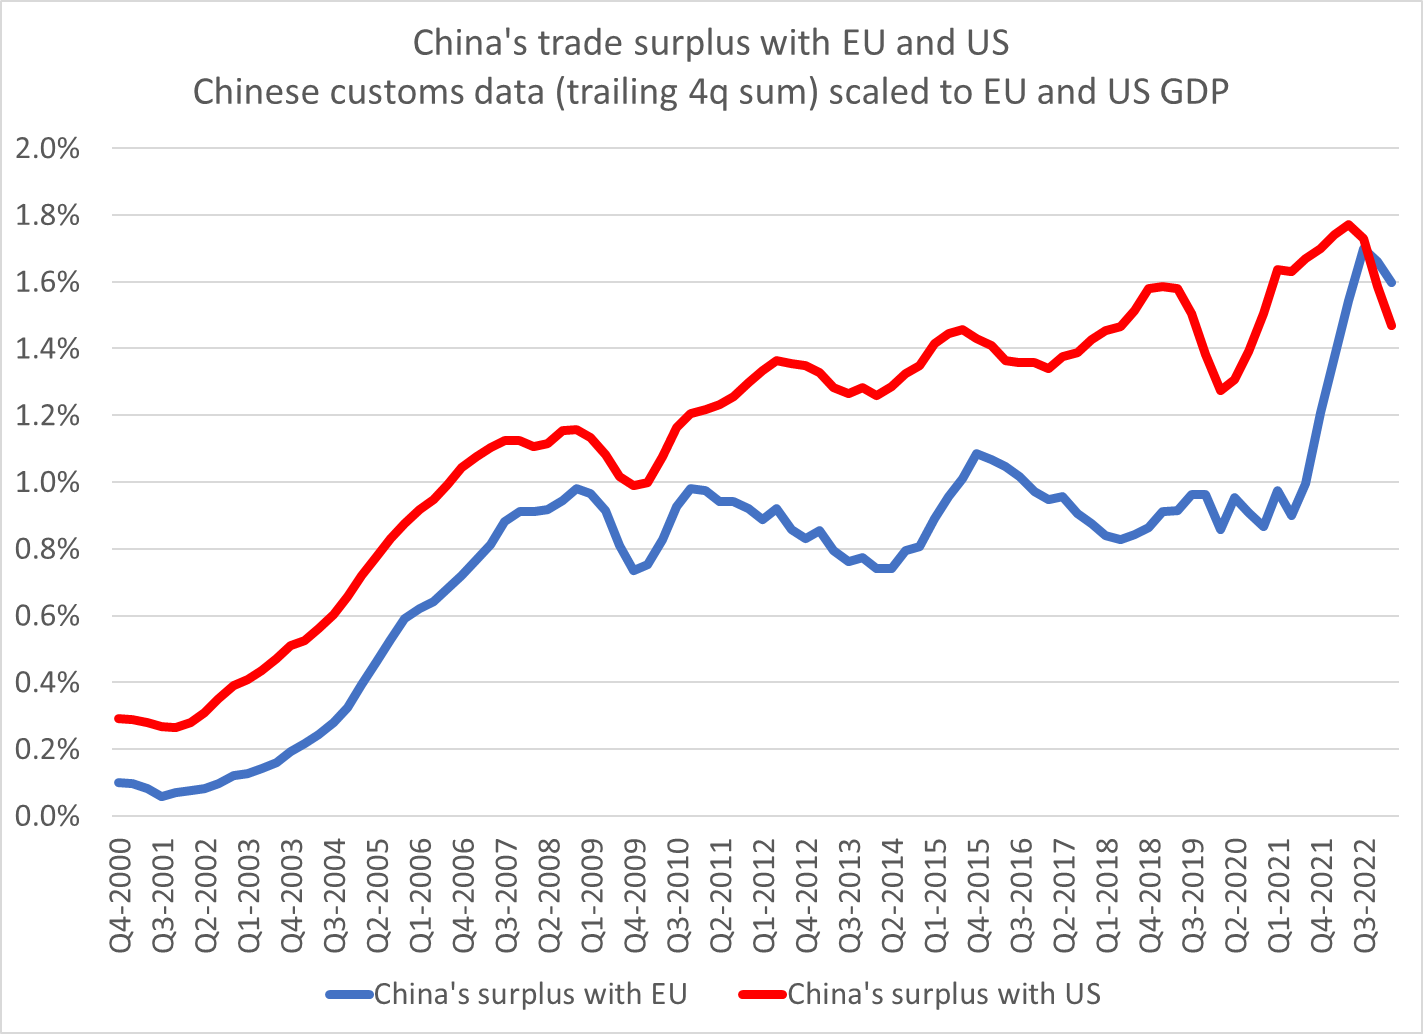
The EU now runs a bigger (goods) deficit with China than the US -- and that deficit surged in the last few years.
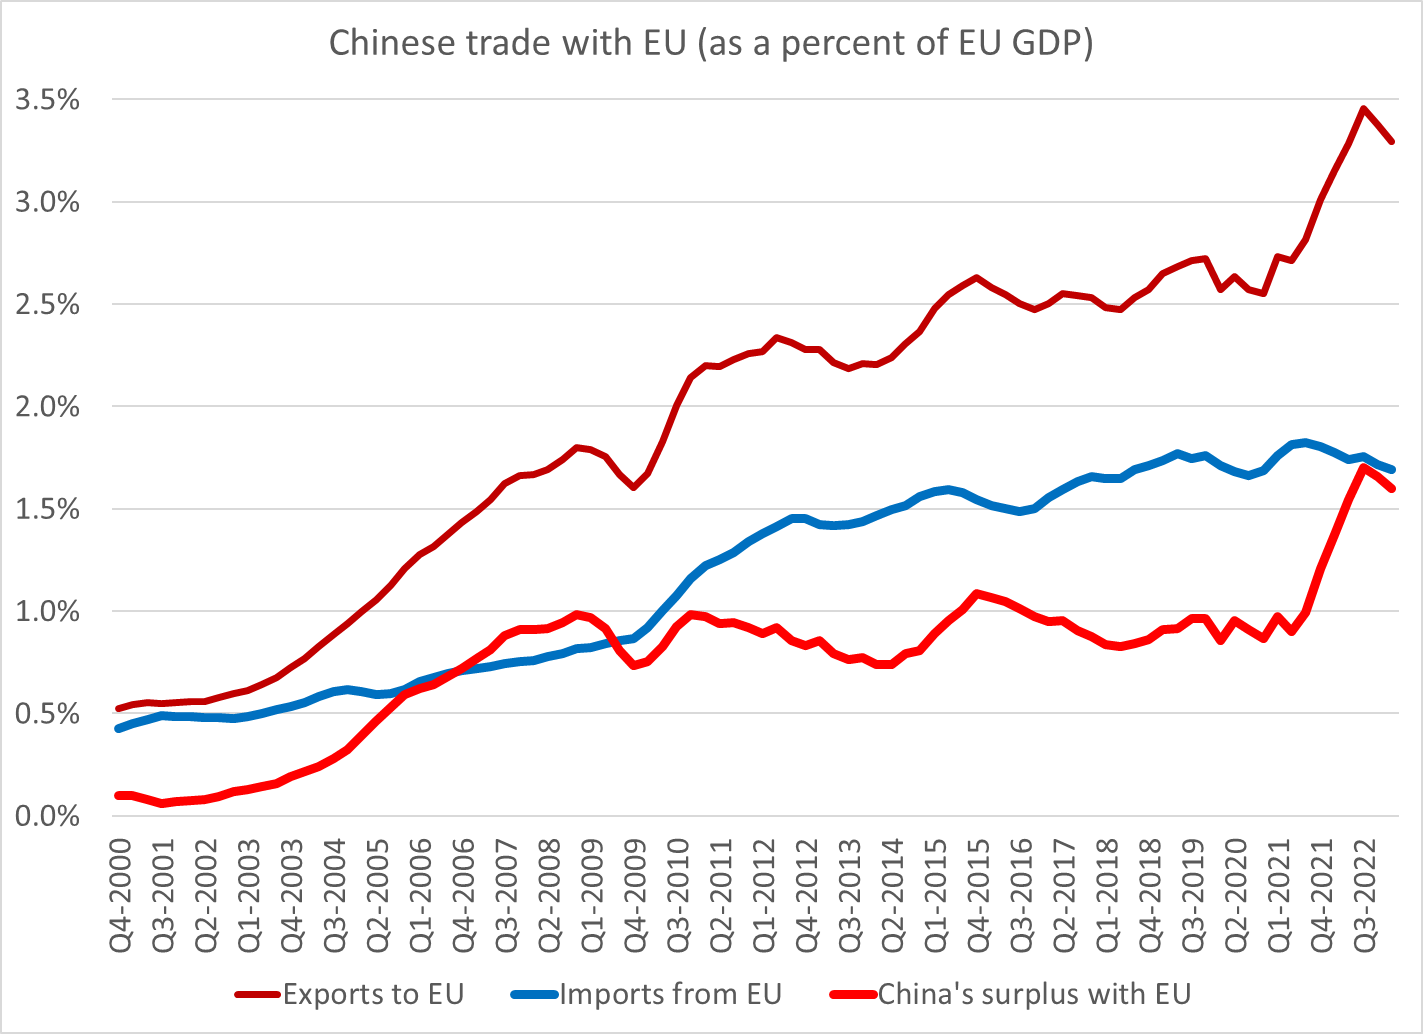
The EU's imports from China surged over the course of 2021 and 2022, and the EU now imports about 2 euros of goods for every euro it exports ...
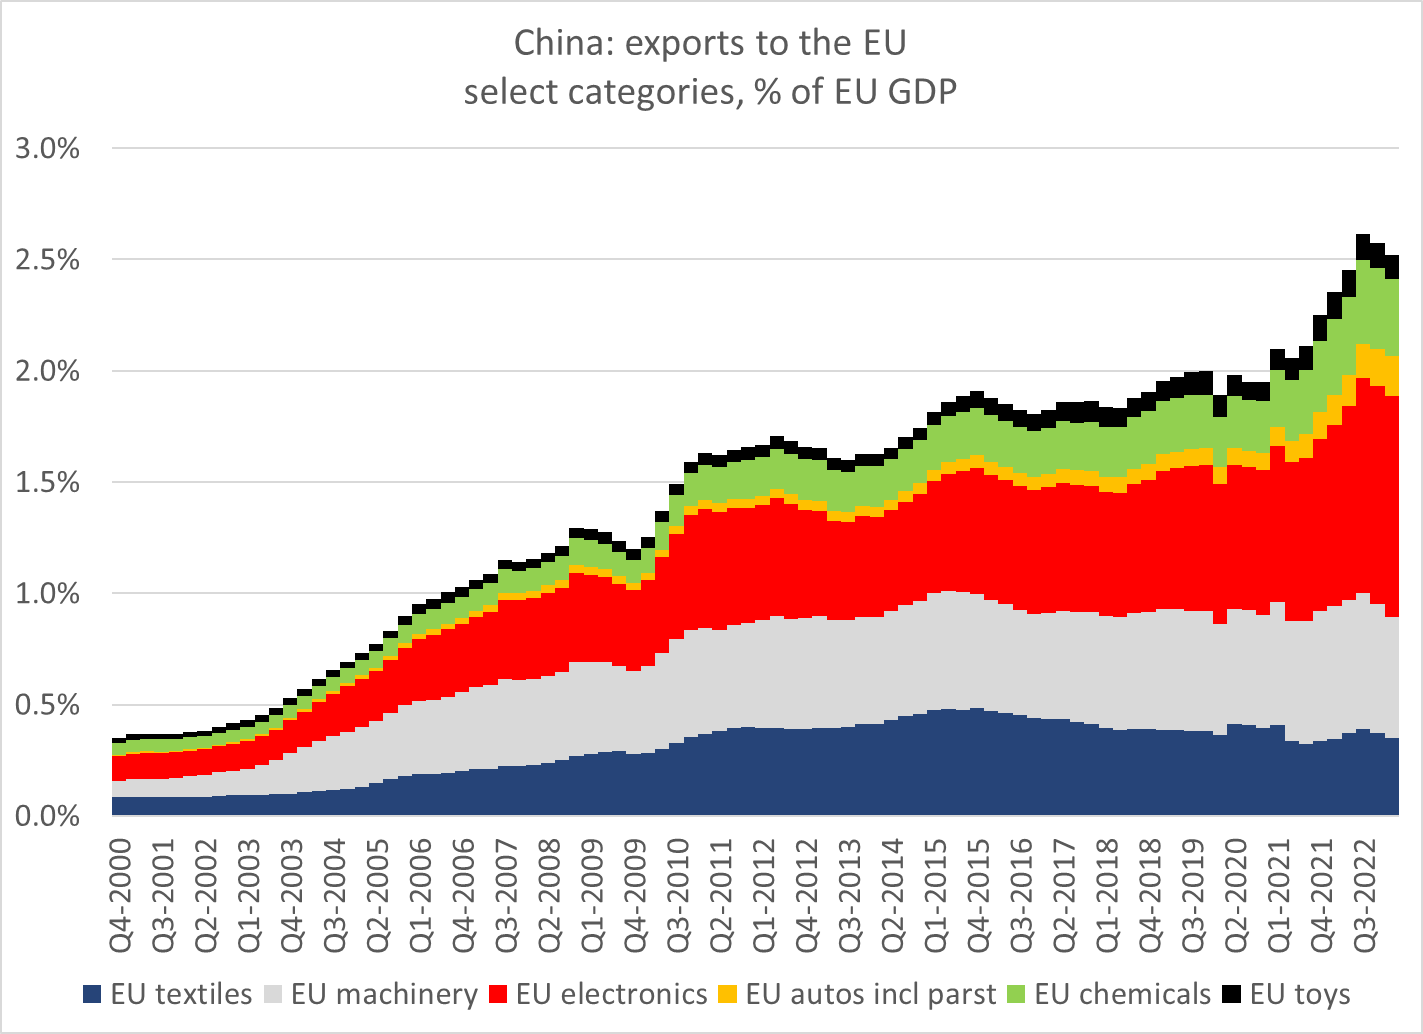
European auto imports from China have surged -- and the swing in trade there is significant. But the bulk of the rise in EU imports (measured using China's export data) has come from electronics. No sign of deglobalization there -- and no sign of any derisking either.
It isn't clear what exactly the Commission plans to try to do to address this obvious imbalance.
But it is constructive for the EU to look Chinese barriers to imports & not just stick to its traditional focus on making it easier for EU firms to invest in China.
Of course, as @michaelxpettis observed, changing overall trade patterns requires changes that go beyond the normal remit of trade policy. The rise in the EU's deficit for example reflects China's limited consumption -- and producer rather than household focused stimulus.
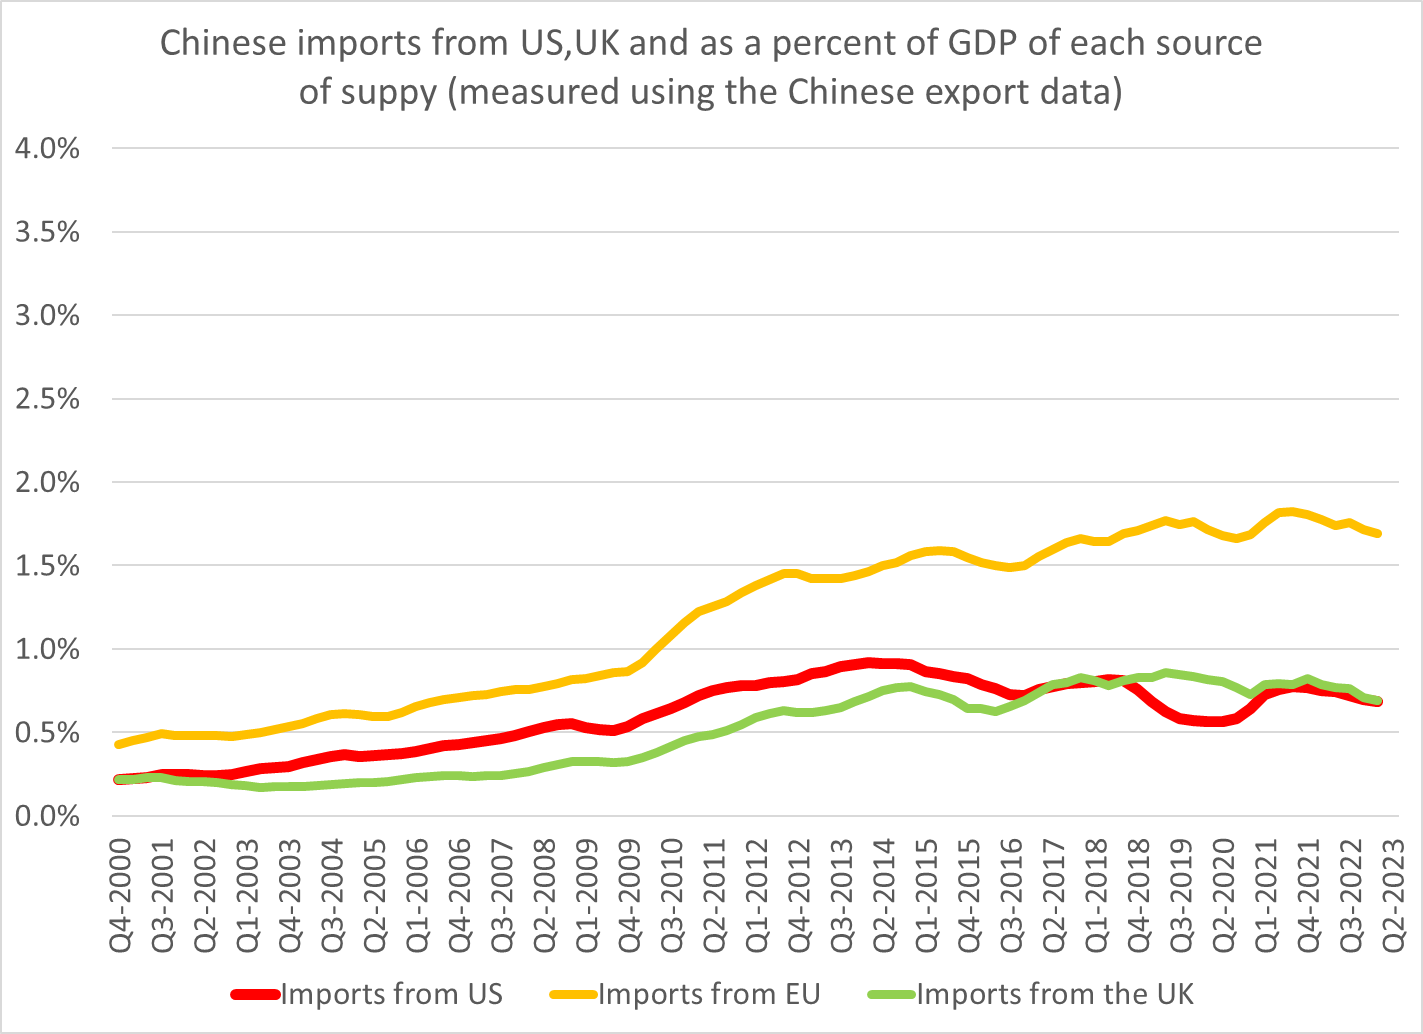
Back in 2021, the EU was very concerned that Trump's phase one deal would lead China to discriminate in favor of US exports (to meet the purchase targets) at the expense of European exports ...
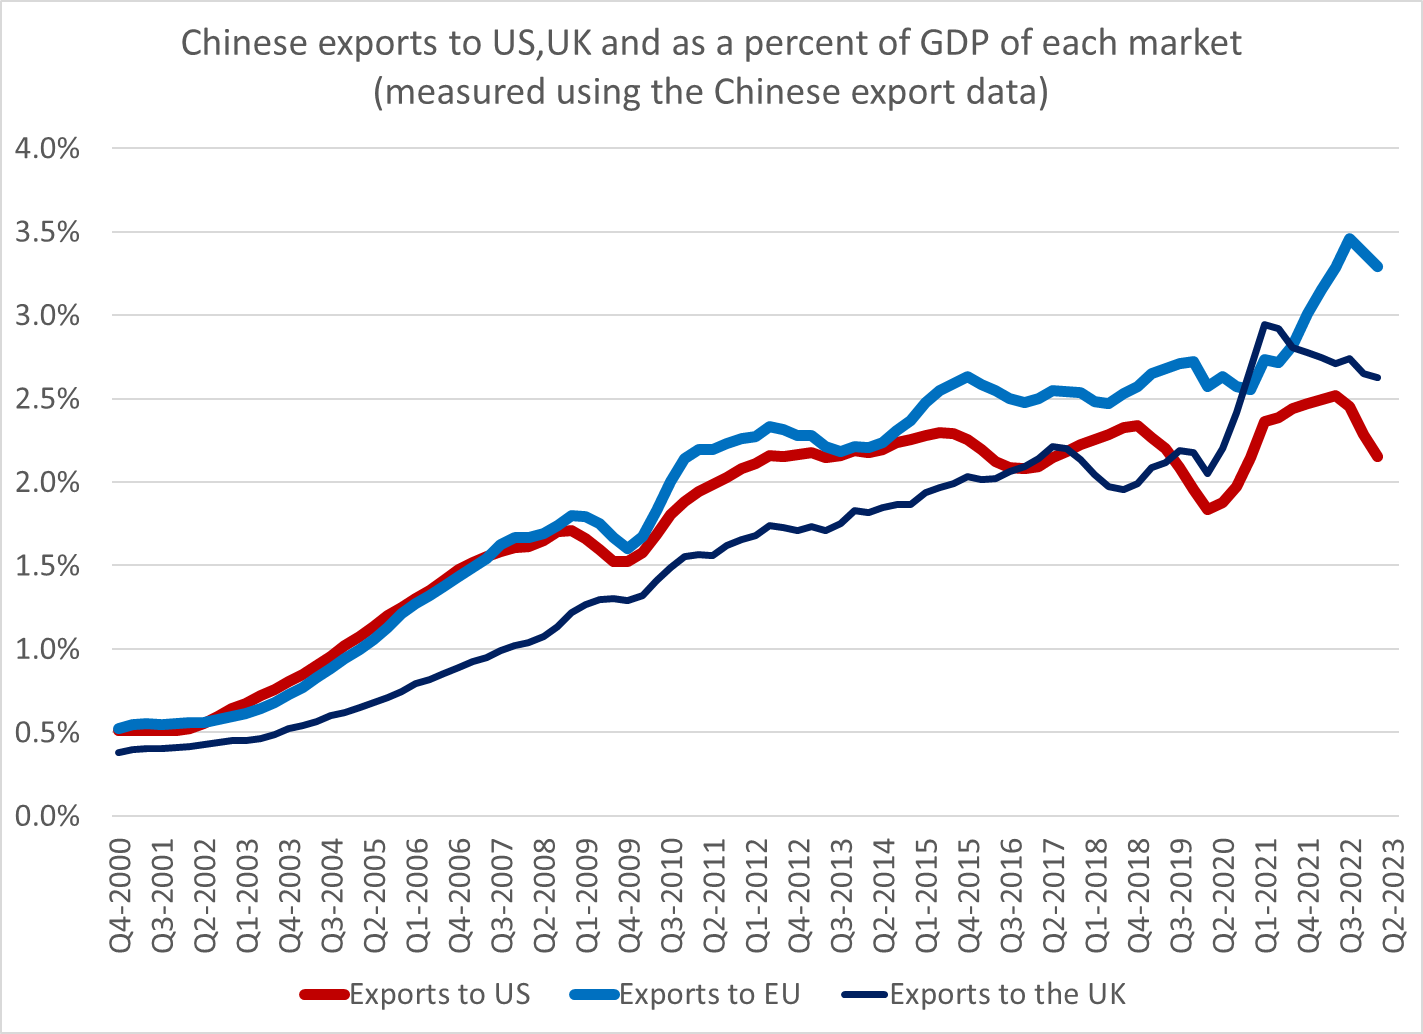
that was the easy complaint for Europe to make -- as it fits easily into a WTO centric and trade policy centric narrative. Of course, US exports haven't surged -- and what actually happened was EU imports for China surged.
There are lots of reasons for this (comparative fiscal policy, increased goods demand in the pandemic, etc). But part of it is that the US tariffs pushed China's XR down and that encouraged China to export more to all countries w-o comparable tariffs ...
That though was not an argument that the EU ever made (to my knowledge).
Now though it is hard to see how balance is restored to the EU-Chinese trade relationship without some macroeconomic shifts ... and that hasn't generally been a focus of the EU's dialogue with China
China Local Government
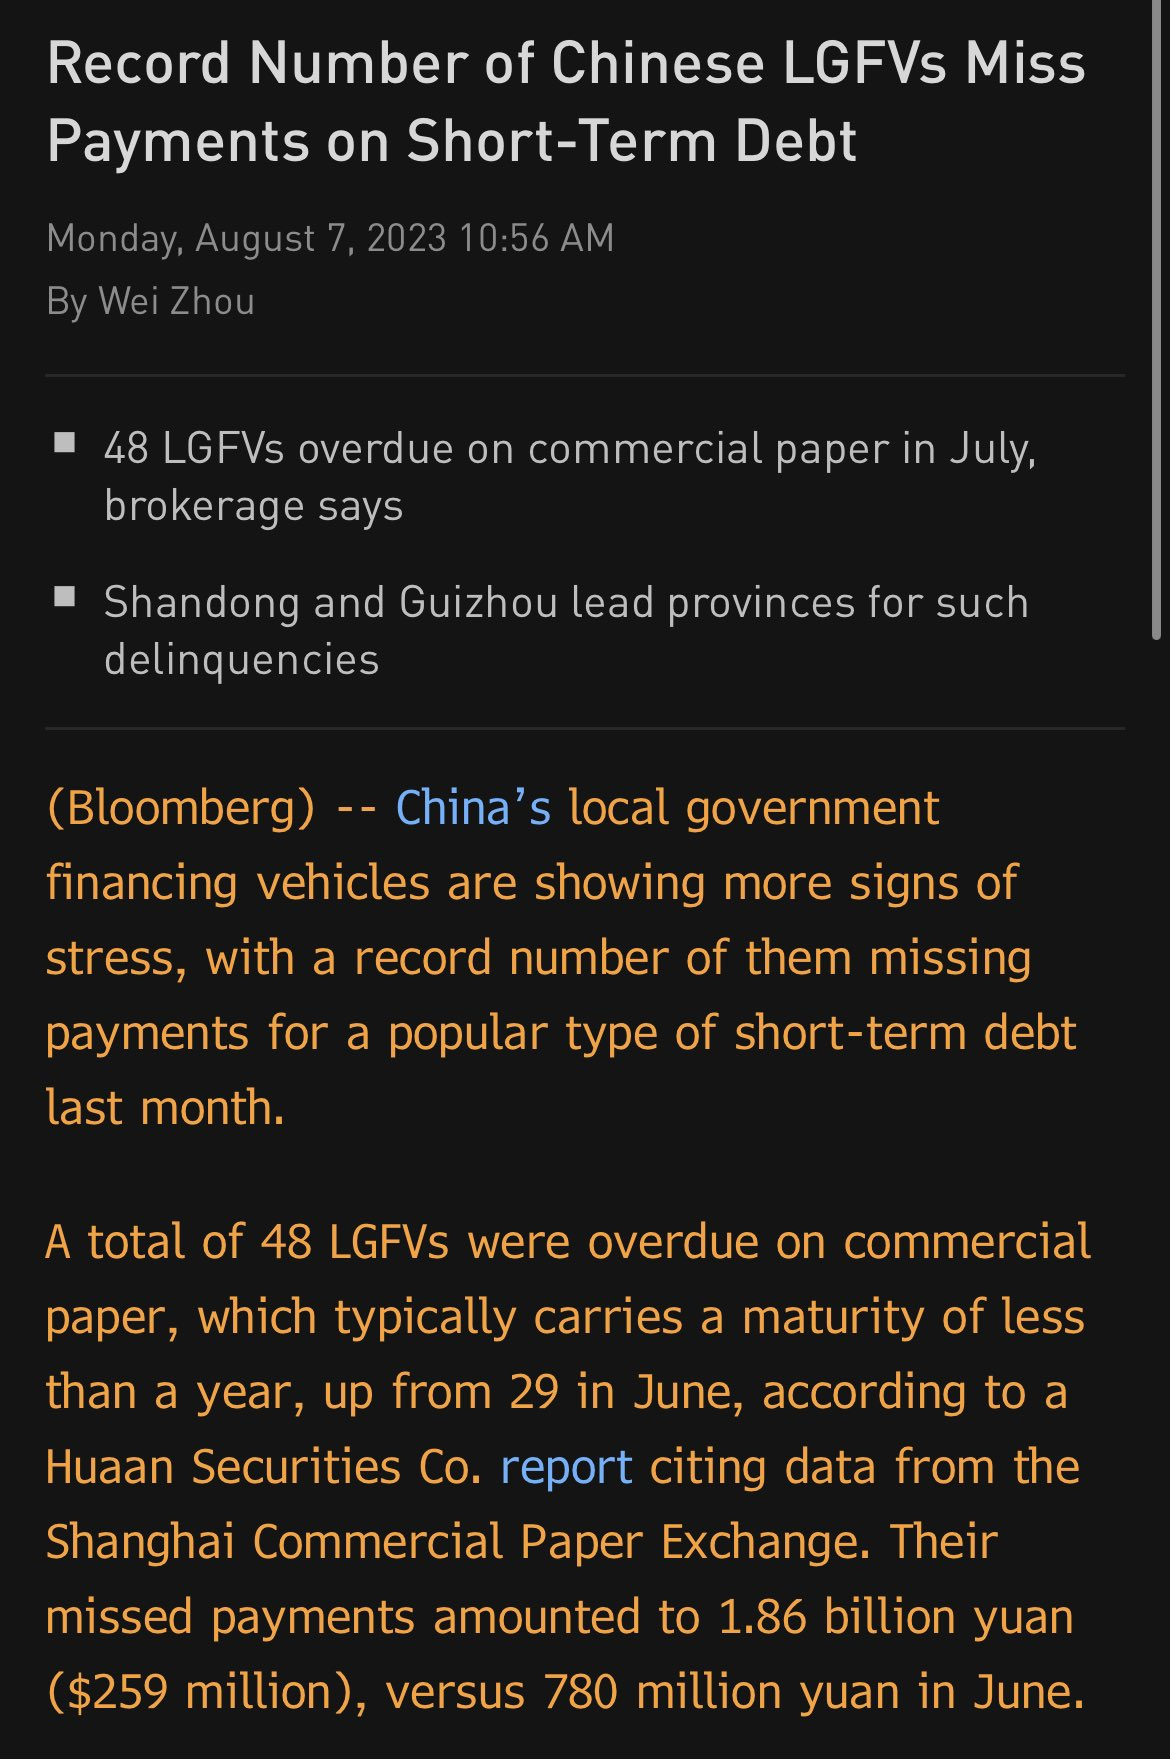
China's local government financing vehicles -- responsible for a hefty chunk of hidden debt -- are showing (more) signs of stress.
A record 48 were overdue on commercial paper in July, up from 29 the previous month.
Plus, a rare instance of bankruptcy claims against LGFVs that signal investors may be losing patience.
Zhongtai Trust filed court applications for bankruptcy liquidation on two LGFVs in Guizhou. Earlier, they LGFVs failed to repay matured shadow banking products.
The fate LGFVs has riveted investors.
None have defaulted on a public bond, but recent payment scares have raised fresh worries.
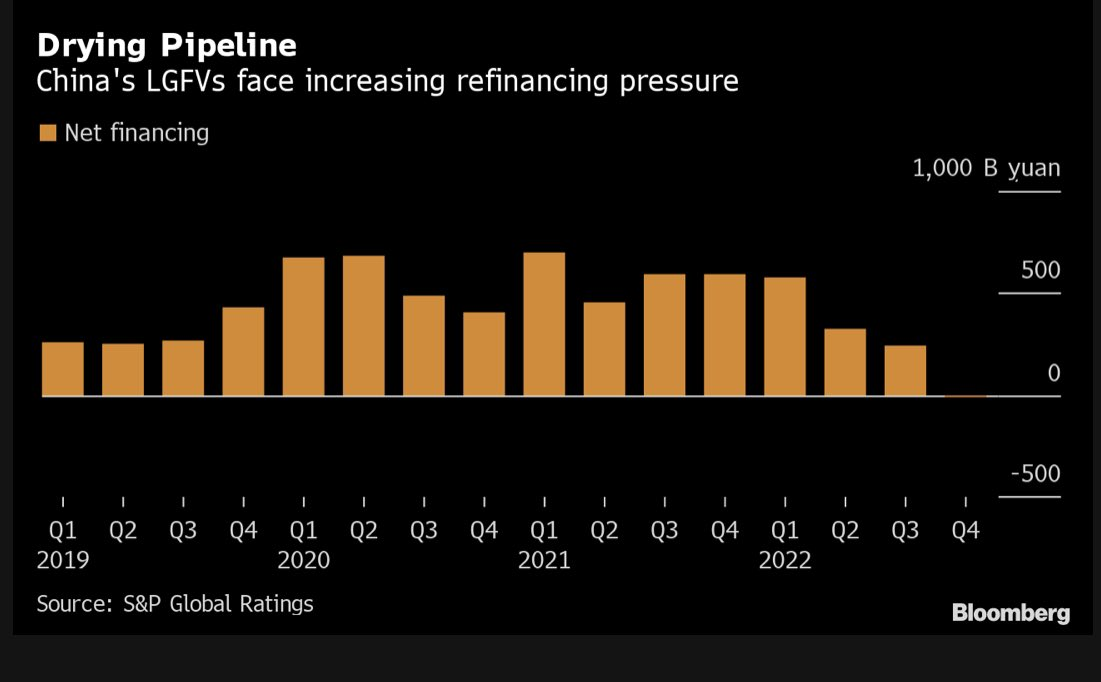
Local governments are walking a tightrope: they need to boost a sluggish economy while juggling reduced incomes and mammoth debt loads.
LGFVs — investment companies tasked with funding government infrastructure projects — historically played a crucial role in boosting GDP and cushioning the impact of previous global slowdowns.
The worry is they now risk becoming more of a hindrance than a help.
For scale: LGFVs have about ~$2 trillion bonds. The IMF estimated in Feb there was ~66 trillion yuan of LGFV hidden debt at the end of 2022, up from 40 trillion yuan in 2019. That jump indicates how local governments ramped up off-book borrowing and spending during Covid.
CPI 1
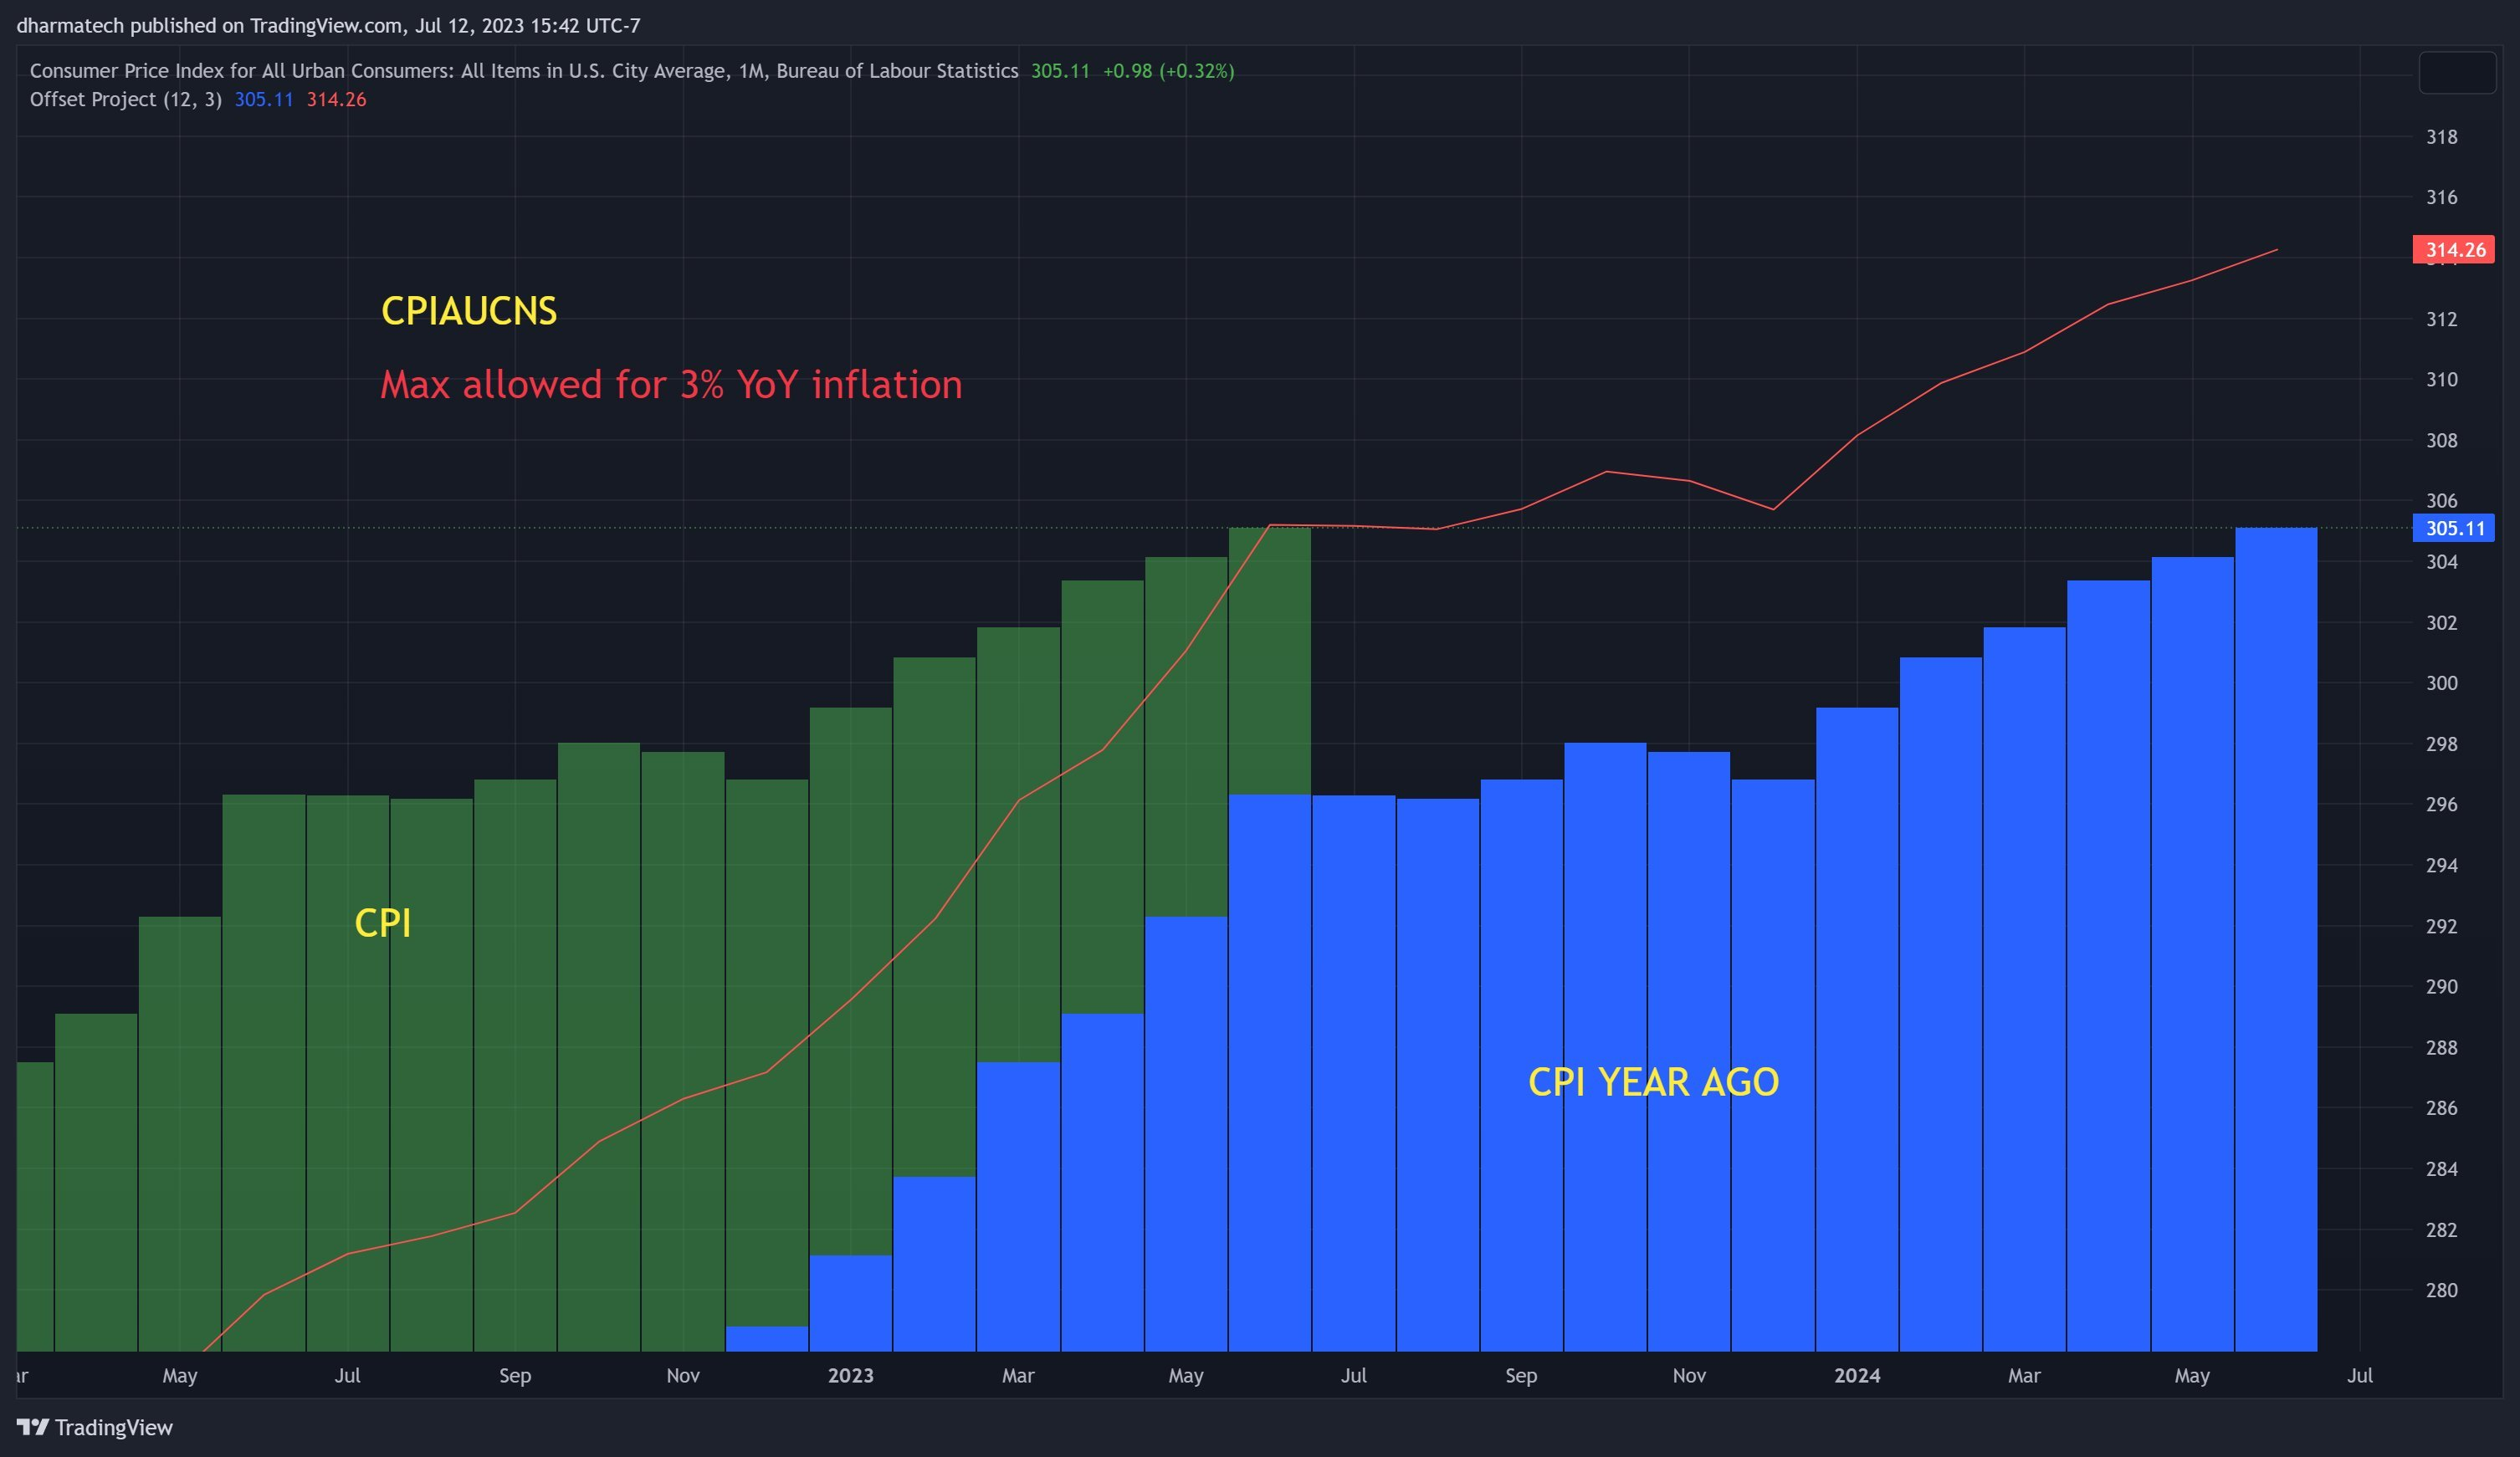
CPI report to be released this Thursday.
CPI has to stay below the red line for YoY inflation to be at 3% or less.
Due to base-effects, this is going to be very challenging.
As you can see, there's no wiggle room.
Most estimates are saying it will come in higher than 3%.
The Fed is playing YoY Inflation Game on hard-mode now and for the next six reports.
MARKET EFFECTS
If Jerome and other members of the Fed point out the hot print is "just base effects" and that MoM is heading in the right direction, that might help to dampen negative market impact. So look out for comments along these lines.
Regarding MoM, I've seen analysts on both sides of the fence. Some say energy and wealth effects are going to boost CPI. Others say shelter is going to weaken it.
Any way you slice it, if MoM comes in hot... wow.
I'd be prepared for that outcome as a possibility.
And just to balance out the views, @CalebFranzen, who has navigated this year's rally well, is optimistic about CPI. @JesseLeeDow1 is on board with this take.
Good to keep all views in mind. 👍
CPI 2
Over the past 12 reports for the Consumer Price Index (CPI), the YoY inflation rate has fallen from +9.1% to +3.0%.
Prices are still rising, but at a slower pace. That's disinflation.
Here are the key charts I'm using to understand where inflation data will be for July 2023
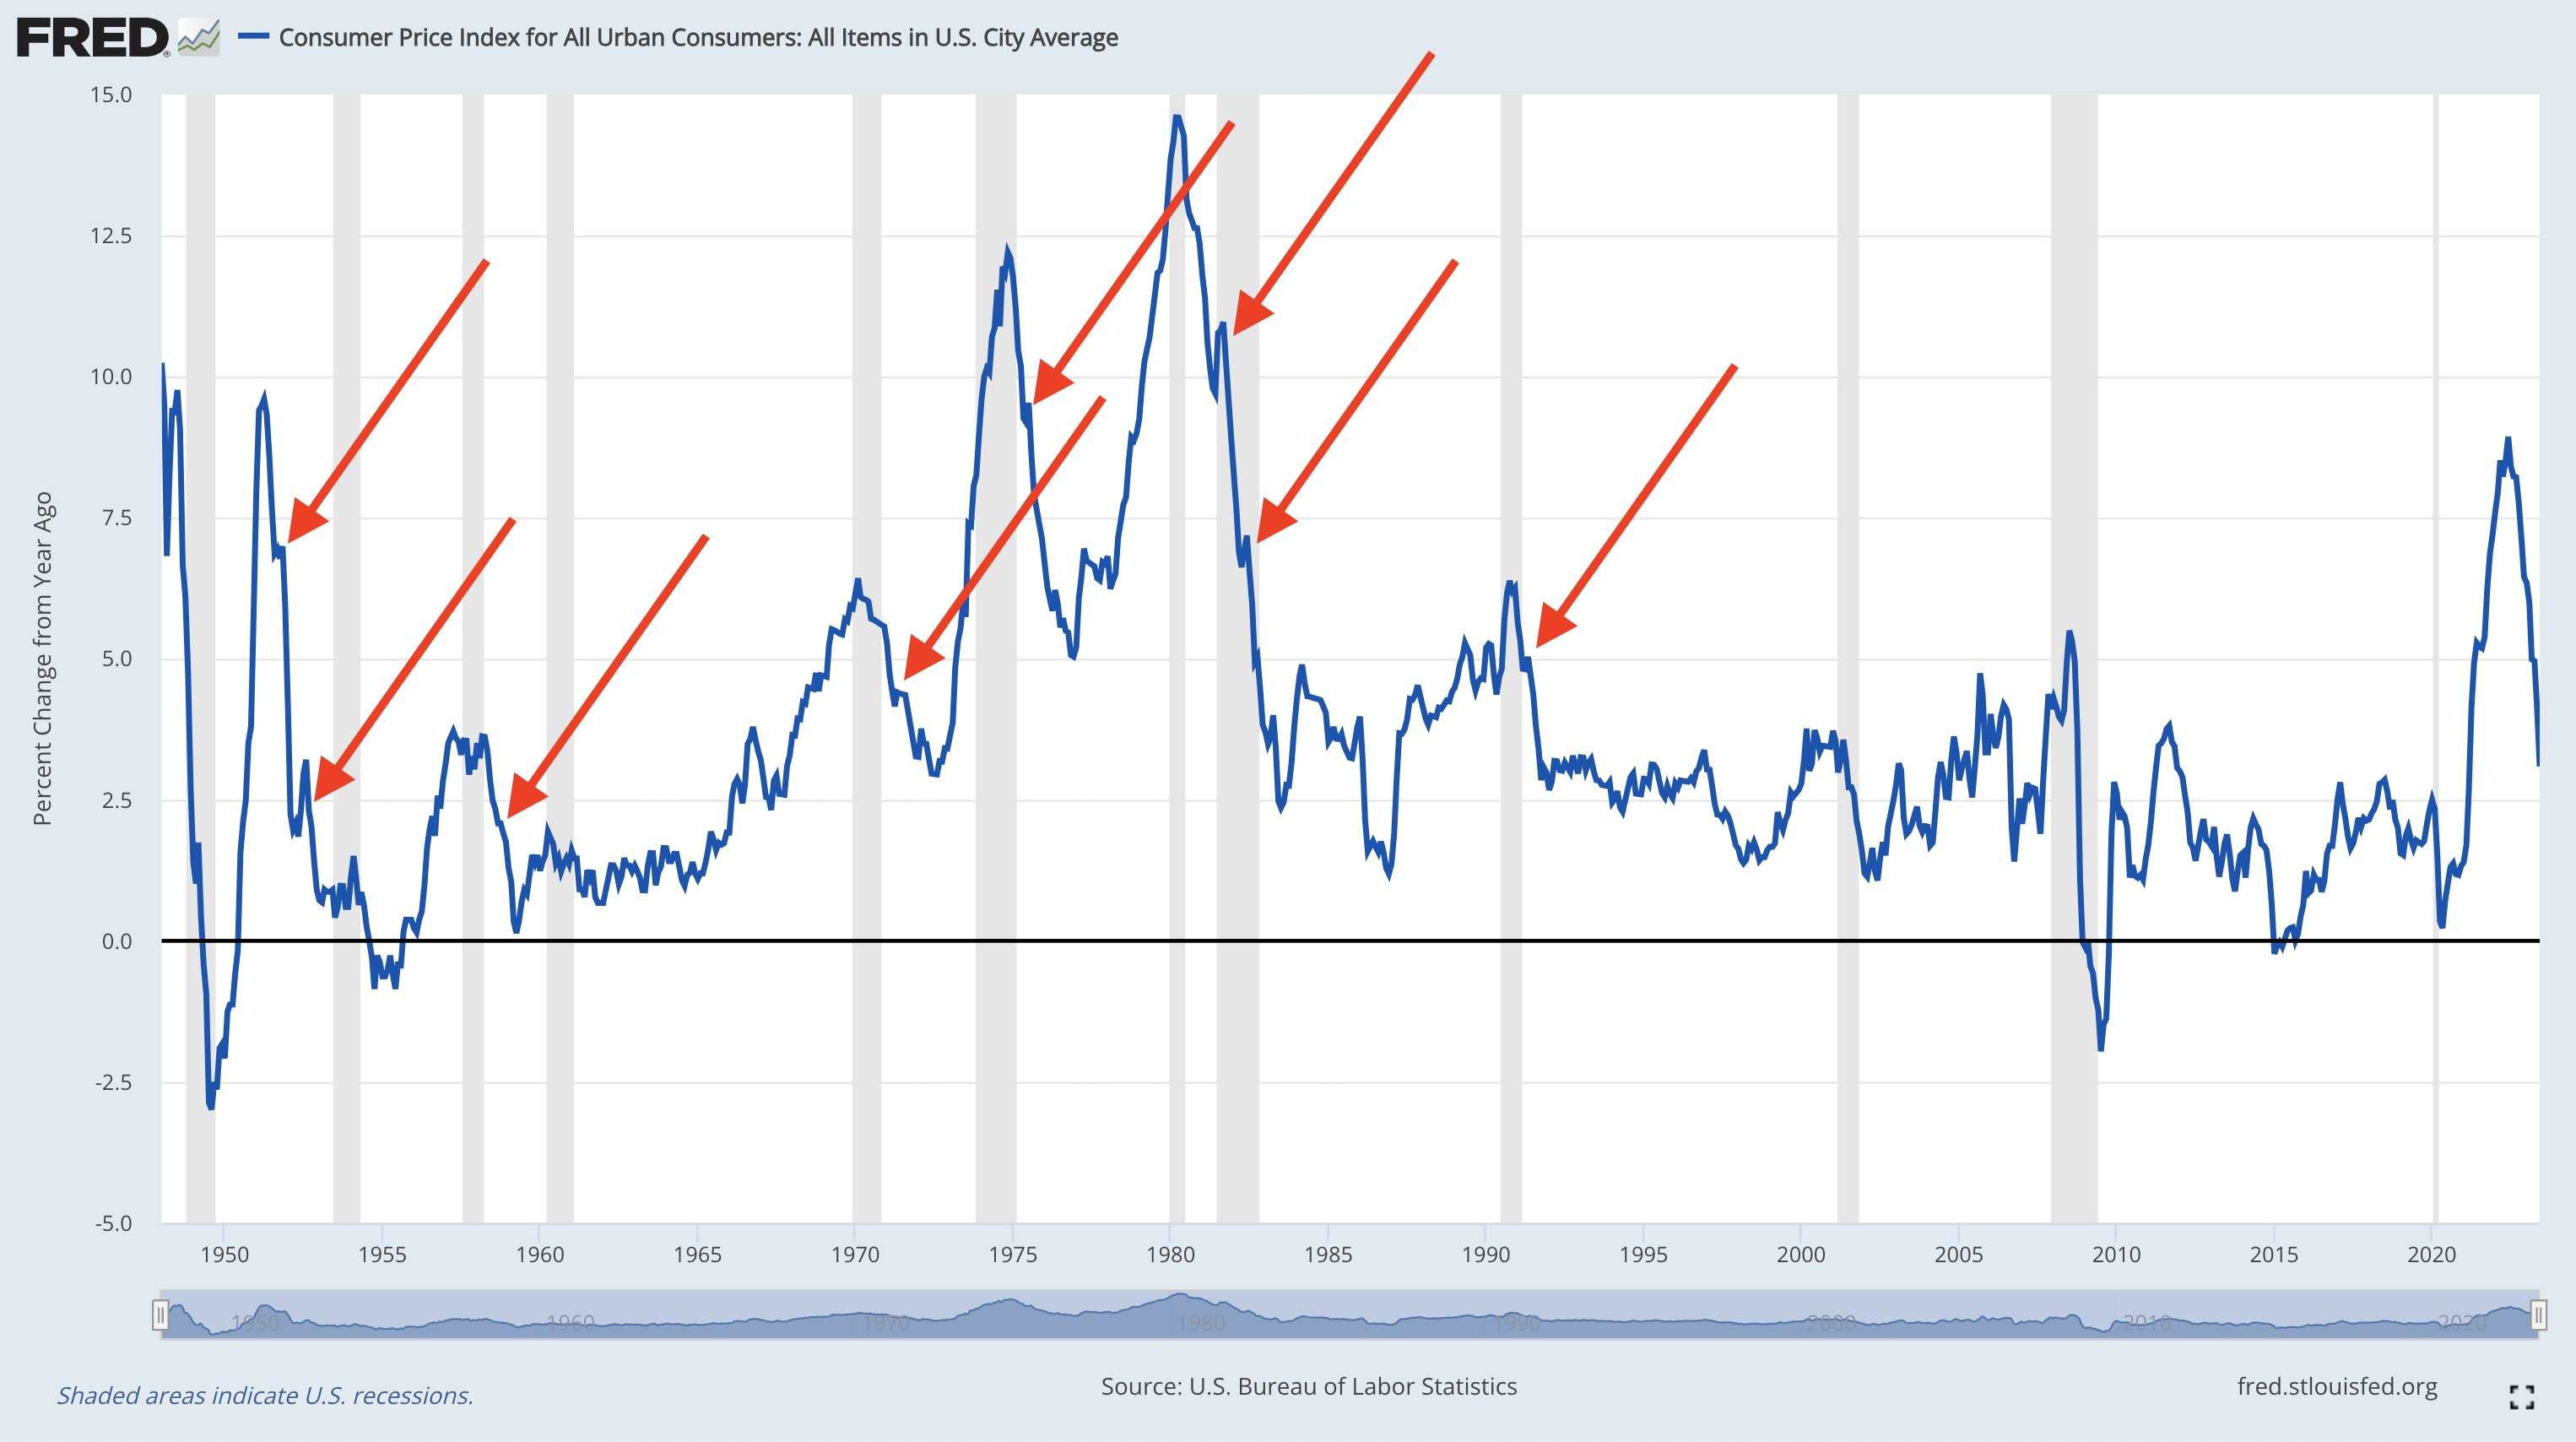
Median estimates are projecting for the headline CPI to rise at a pace of +3.3% YoY, up from +3.0% YoY in June'23.
This could be the first YoY increase since June'22.
History shows that brief YoY accelerations can occur within a broader disinflationary environment (red arrows).
I think it's important to have this context in mind.
One month doesn't make a trend and we must recognize that the data has developed for 12 months in a disinflationary manner, fueled by a variety of components experiencing disinflation or even outright deflation.
There are 4 components that I really pay attention to on a monthly basis to monitor inflation dynamics:
- Commodities
- Supply chains
- Wages
- Credit creation
Aside from massive fiscal & monetary stimulus in 2020 & 2021, these were the 4 drivers of inflation in '21 & '22.
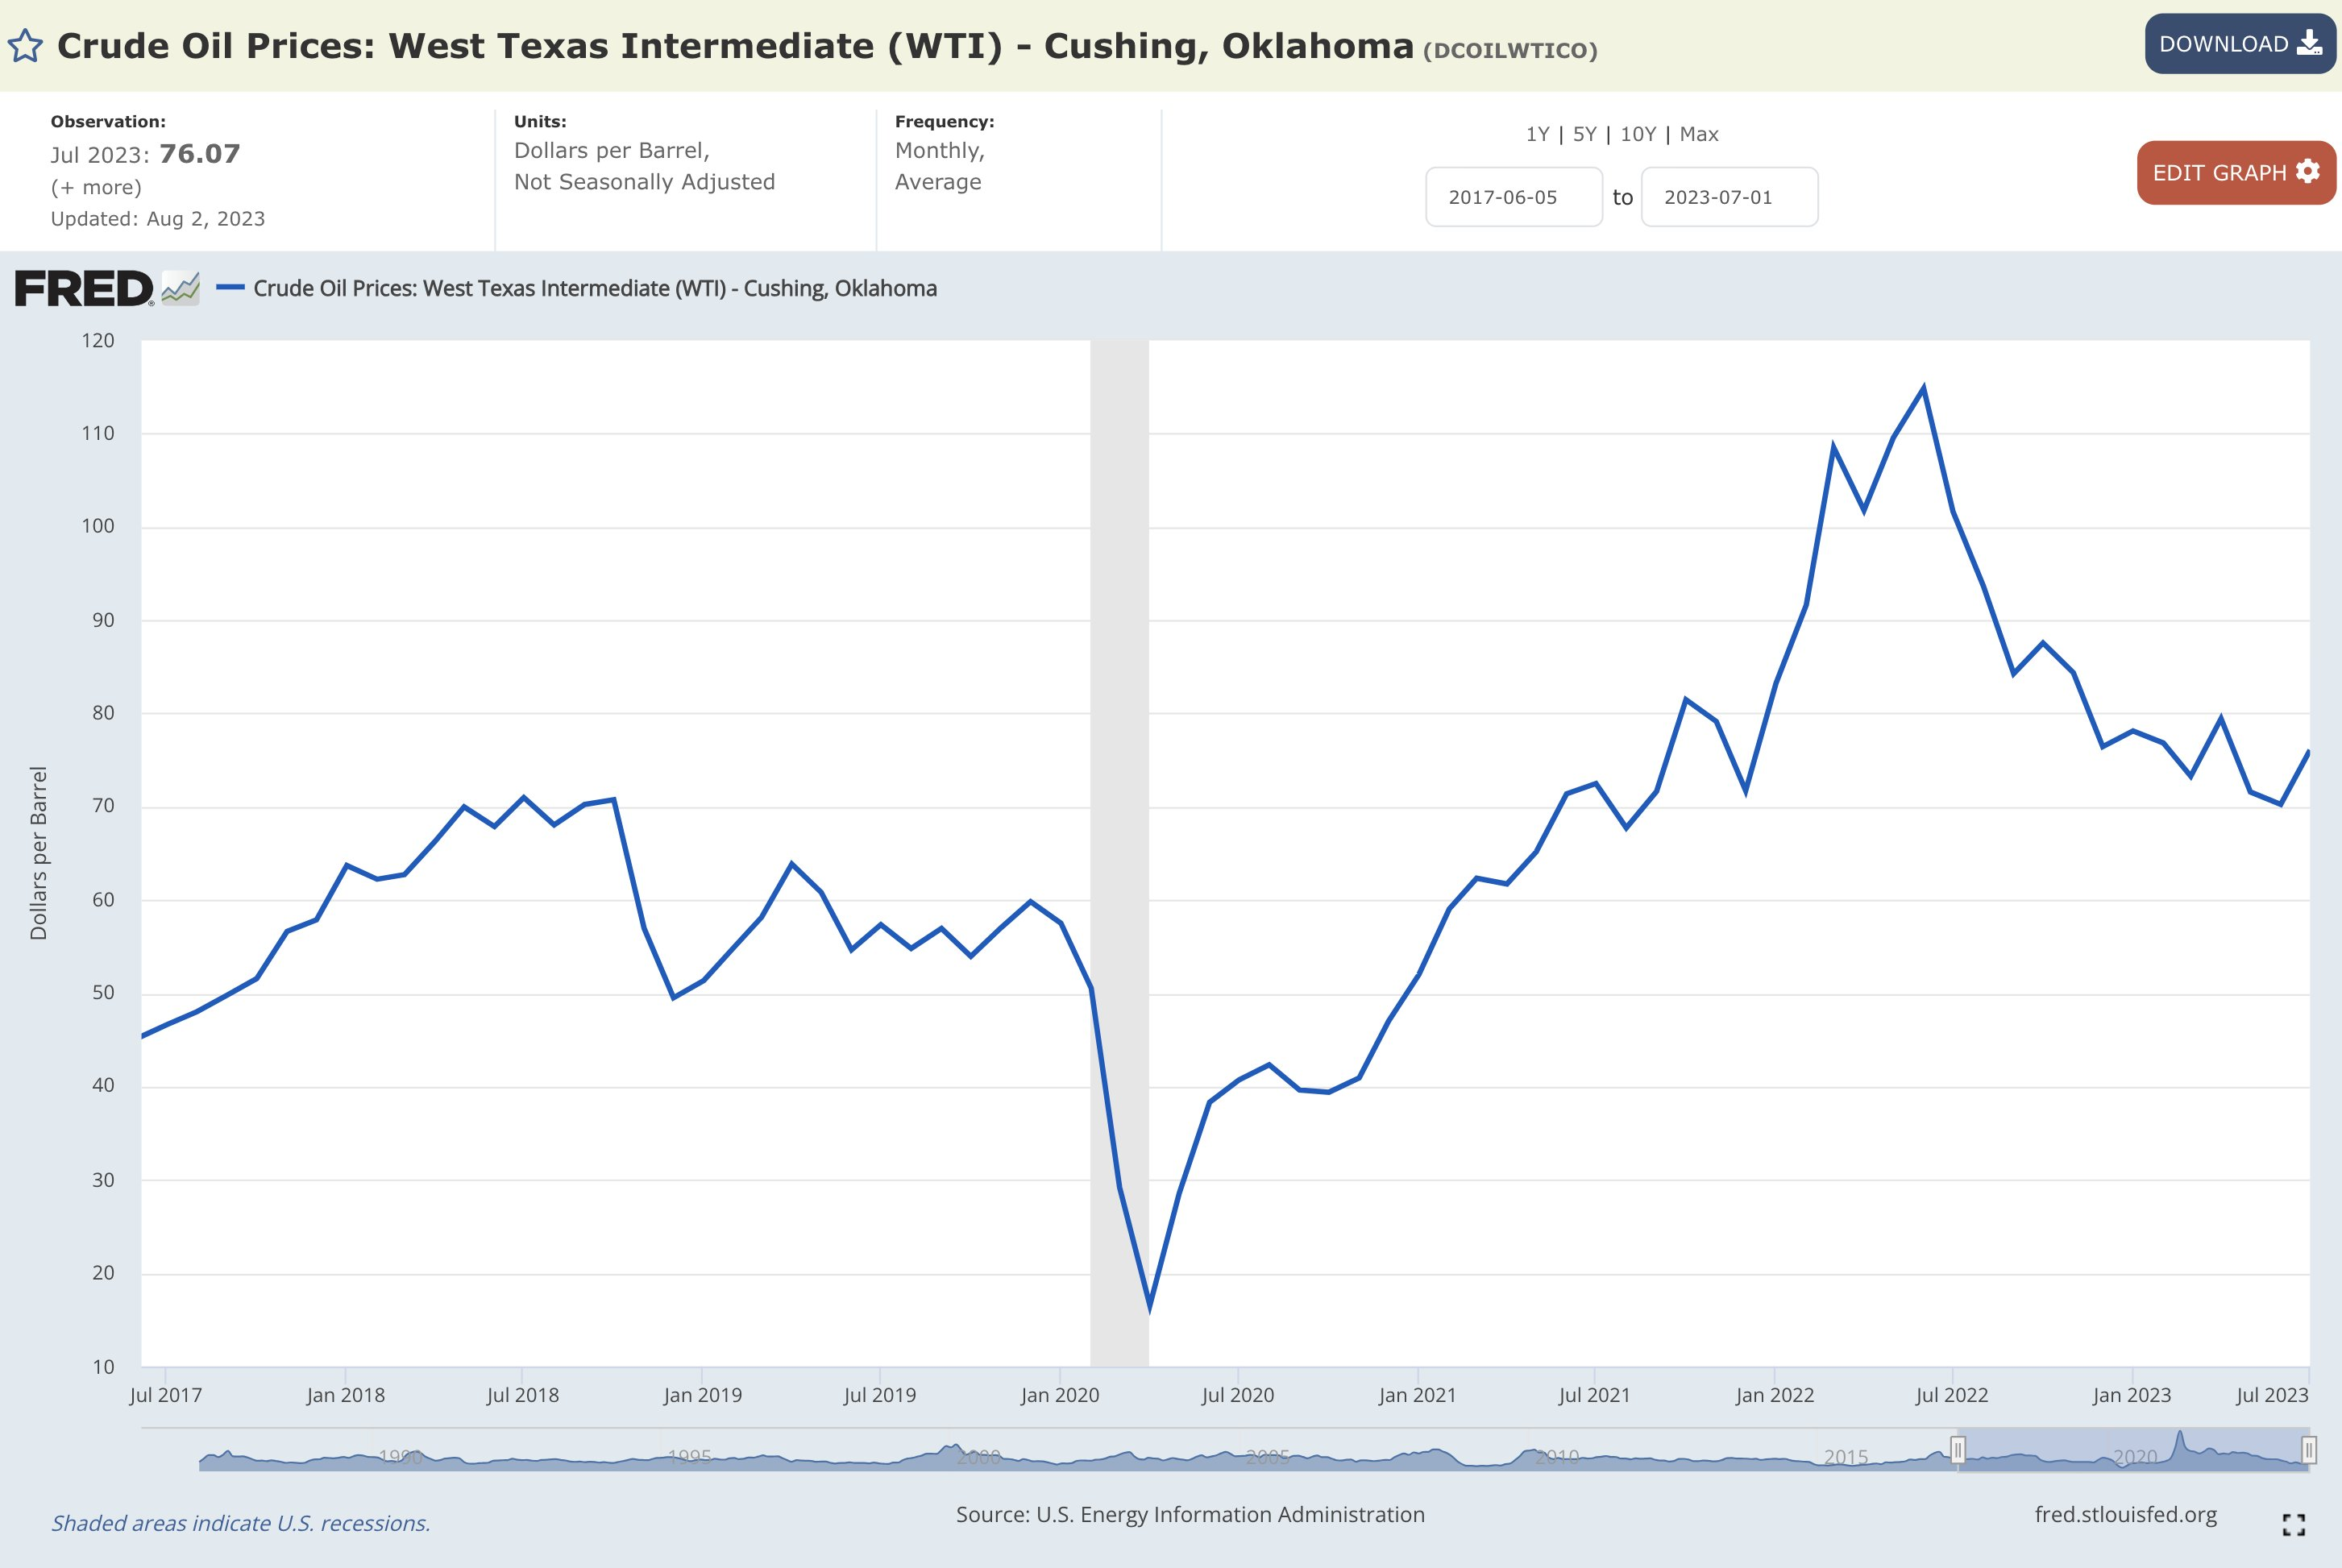
Everyone is scared about crude oil prices re-accelerating.
I'm not.
Why?
The average monthly price of crude oil in July 2023 was $76.06, down -25.1% YoY.
Yes, down -25.1% YoY.
That's strong deflation, which will create widespread YoY disinflation in the other CPI components.
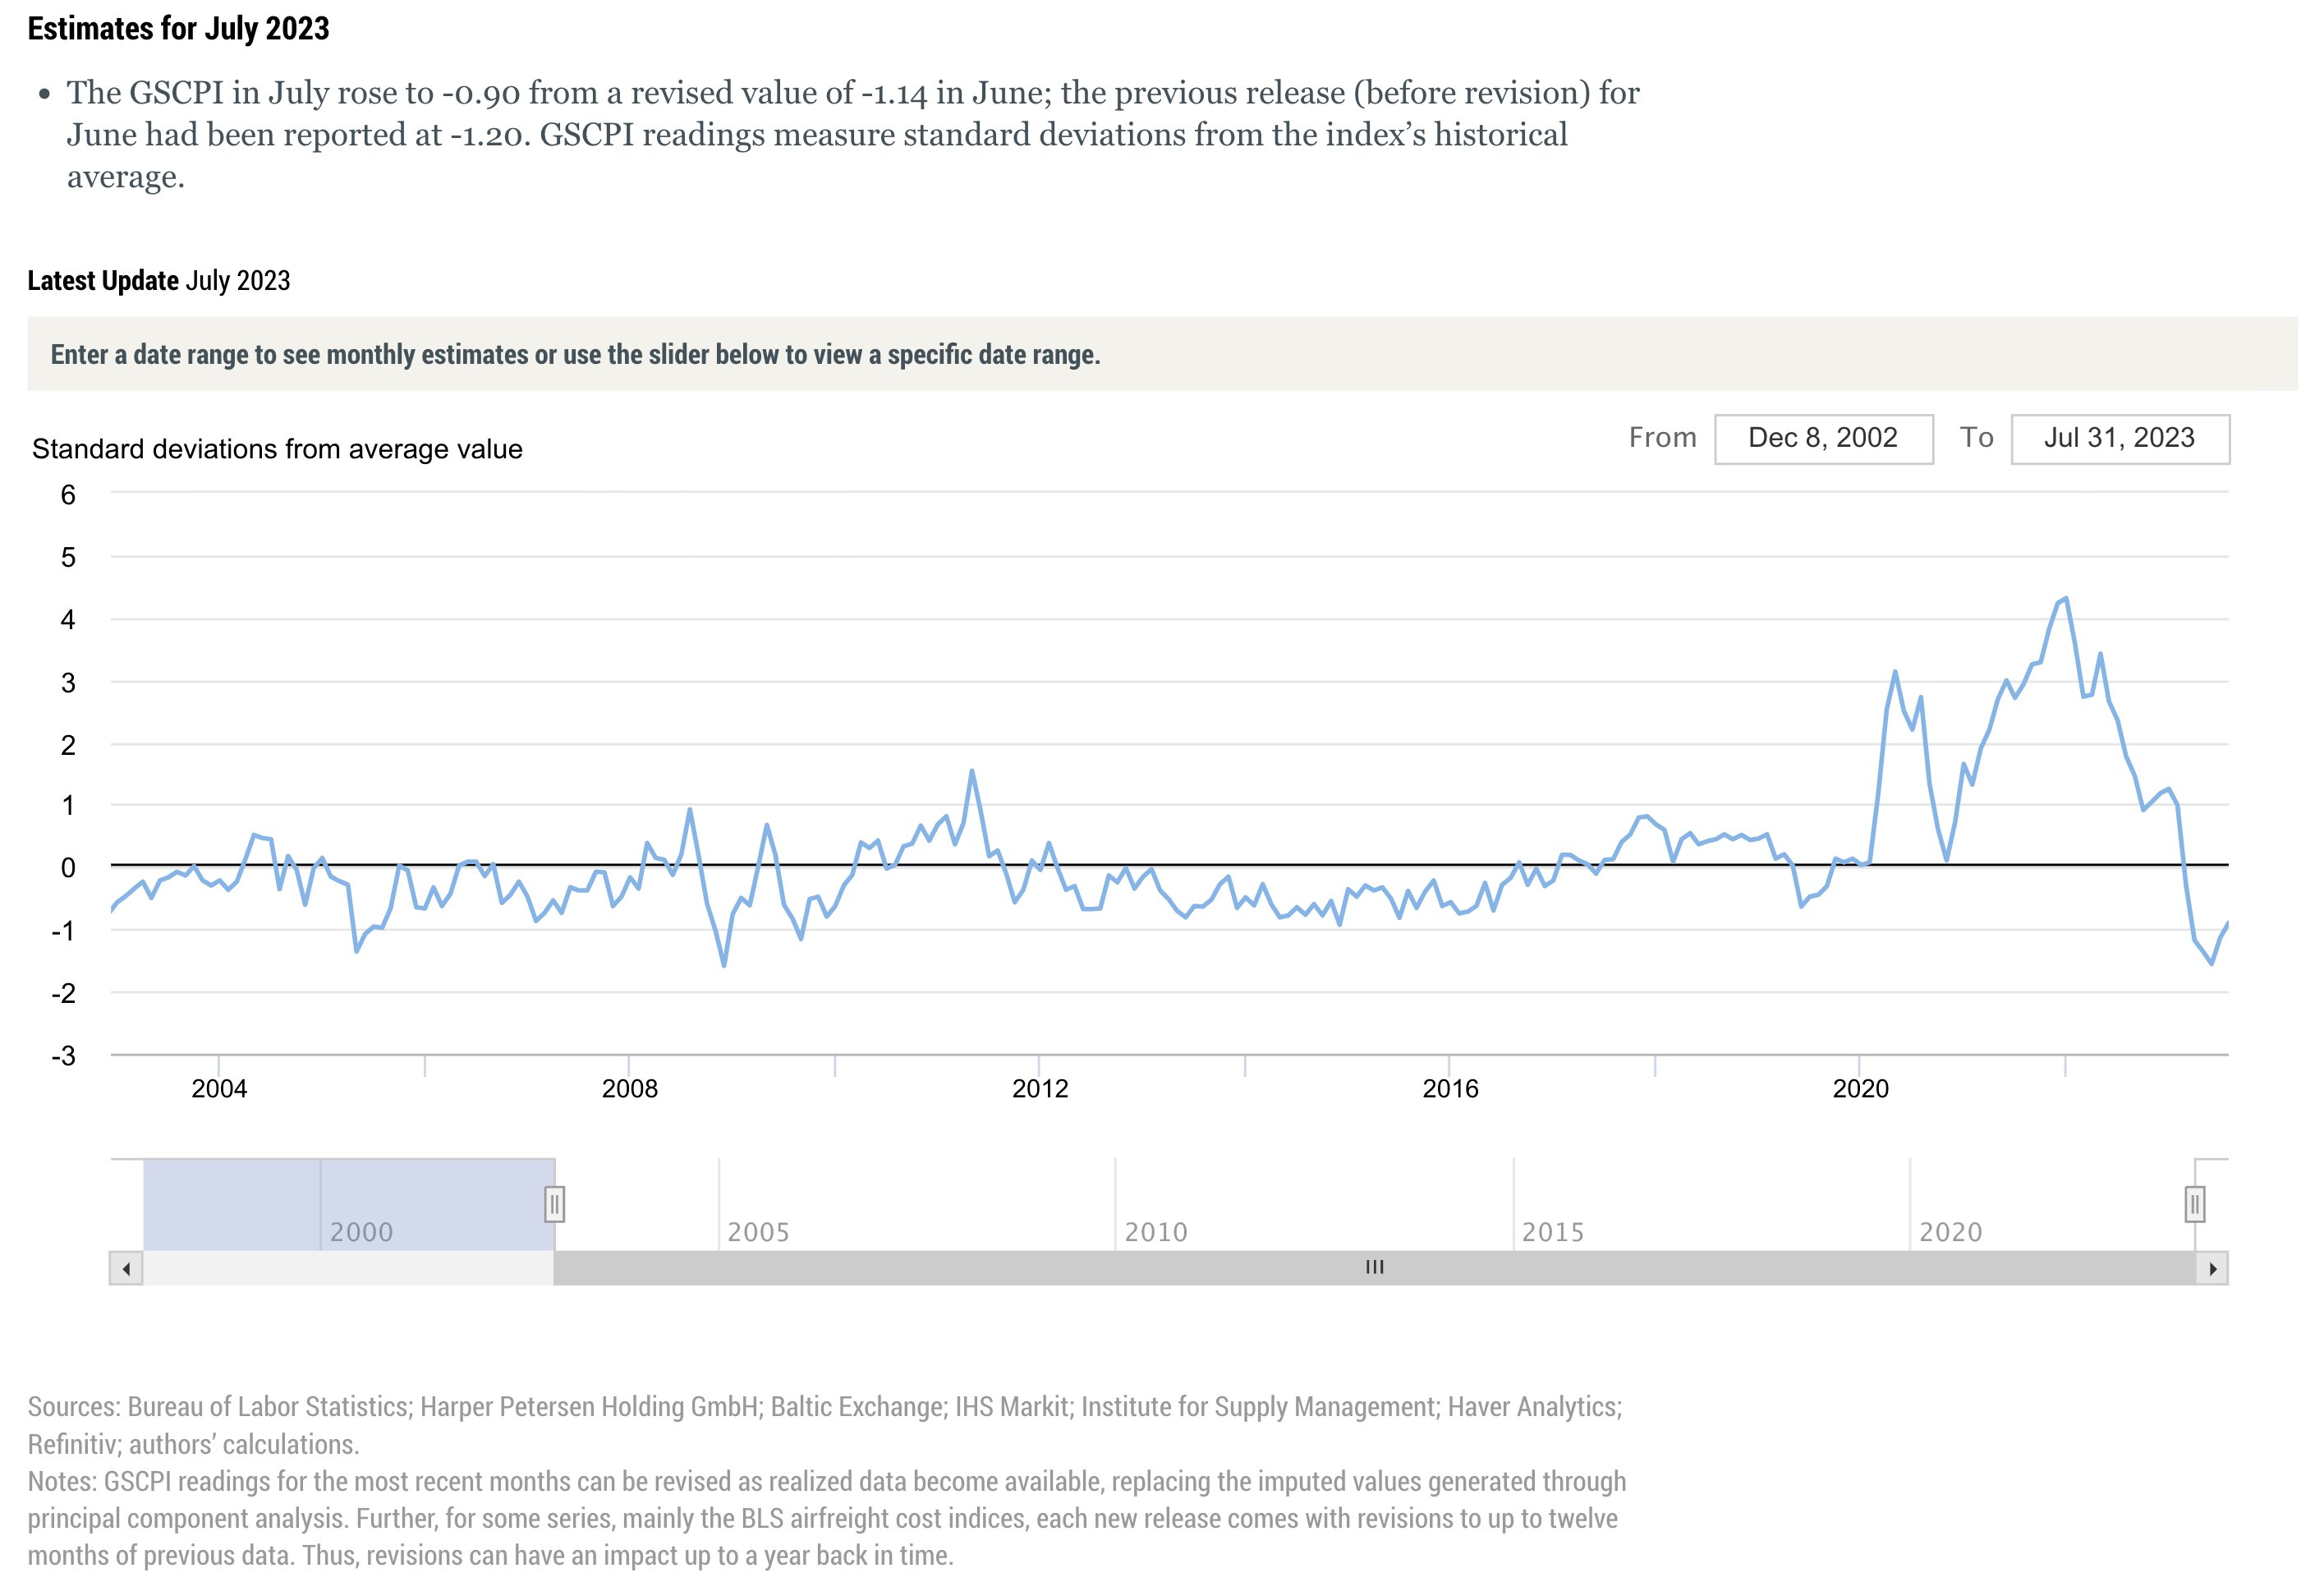
Regarding supply chains, the New York Fed publishes their Global Supply Chain Pressures Index every month.
The GSCPI "tightened" in July relative to June, but it's still at -0.9 standard deviations. This means that supply chains aren't tight and bottlenecks aren't a concern.
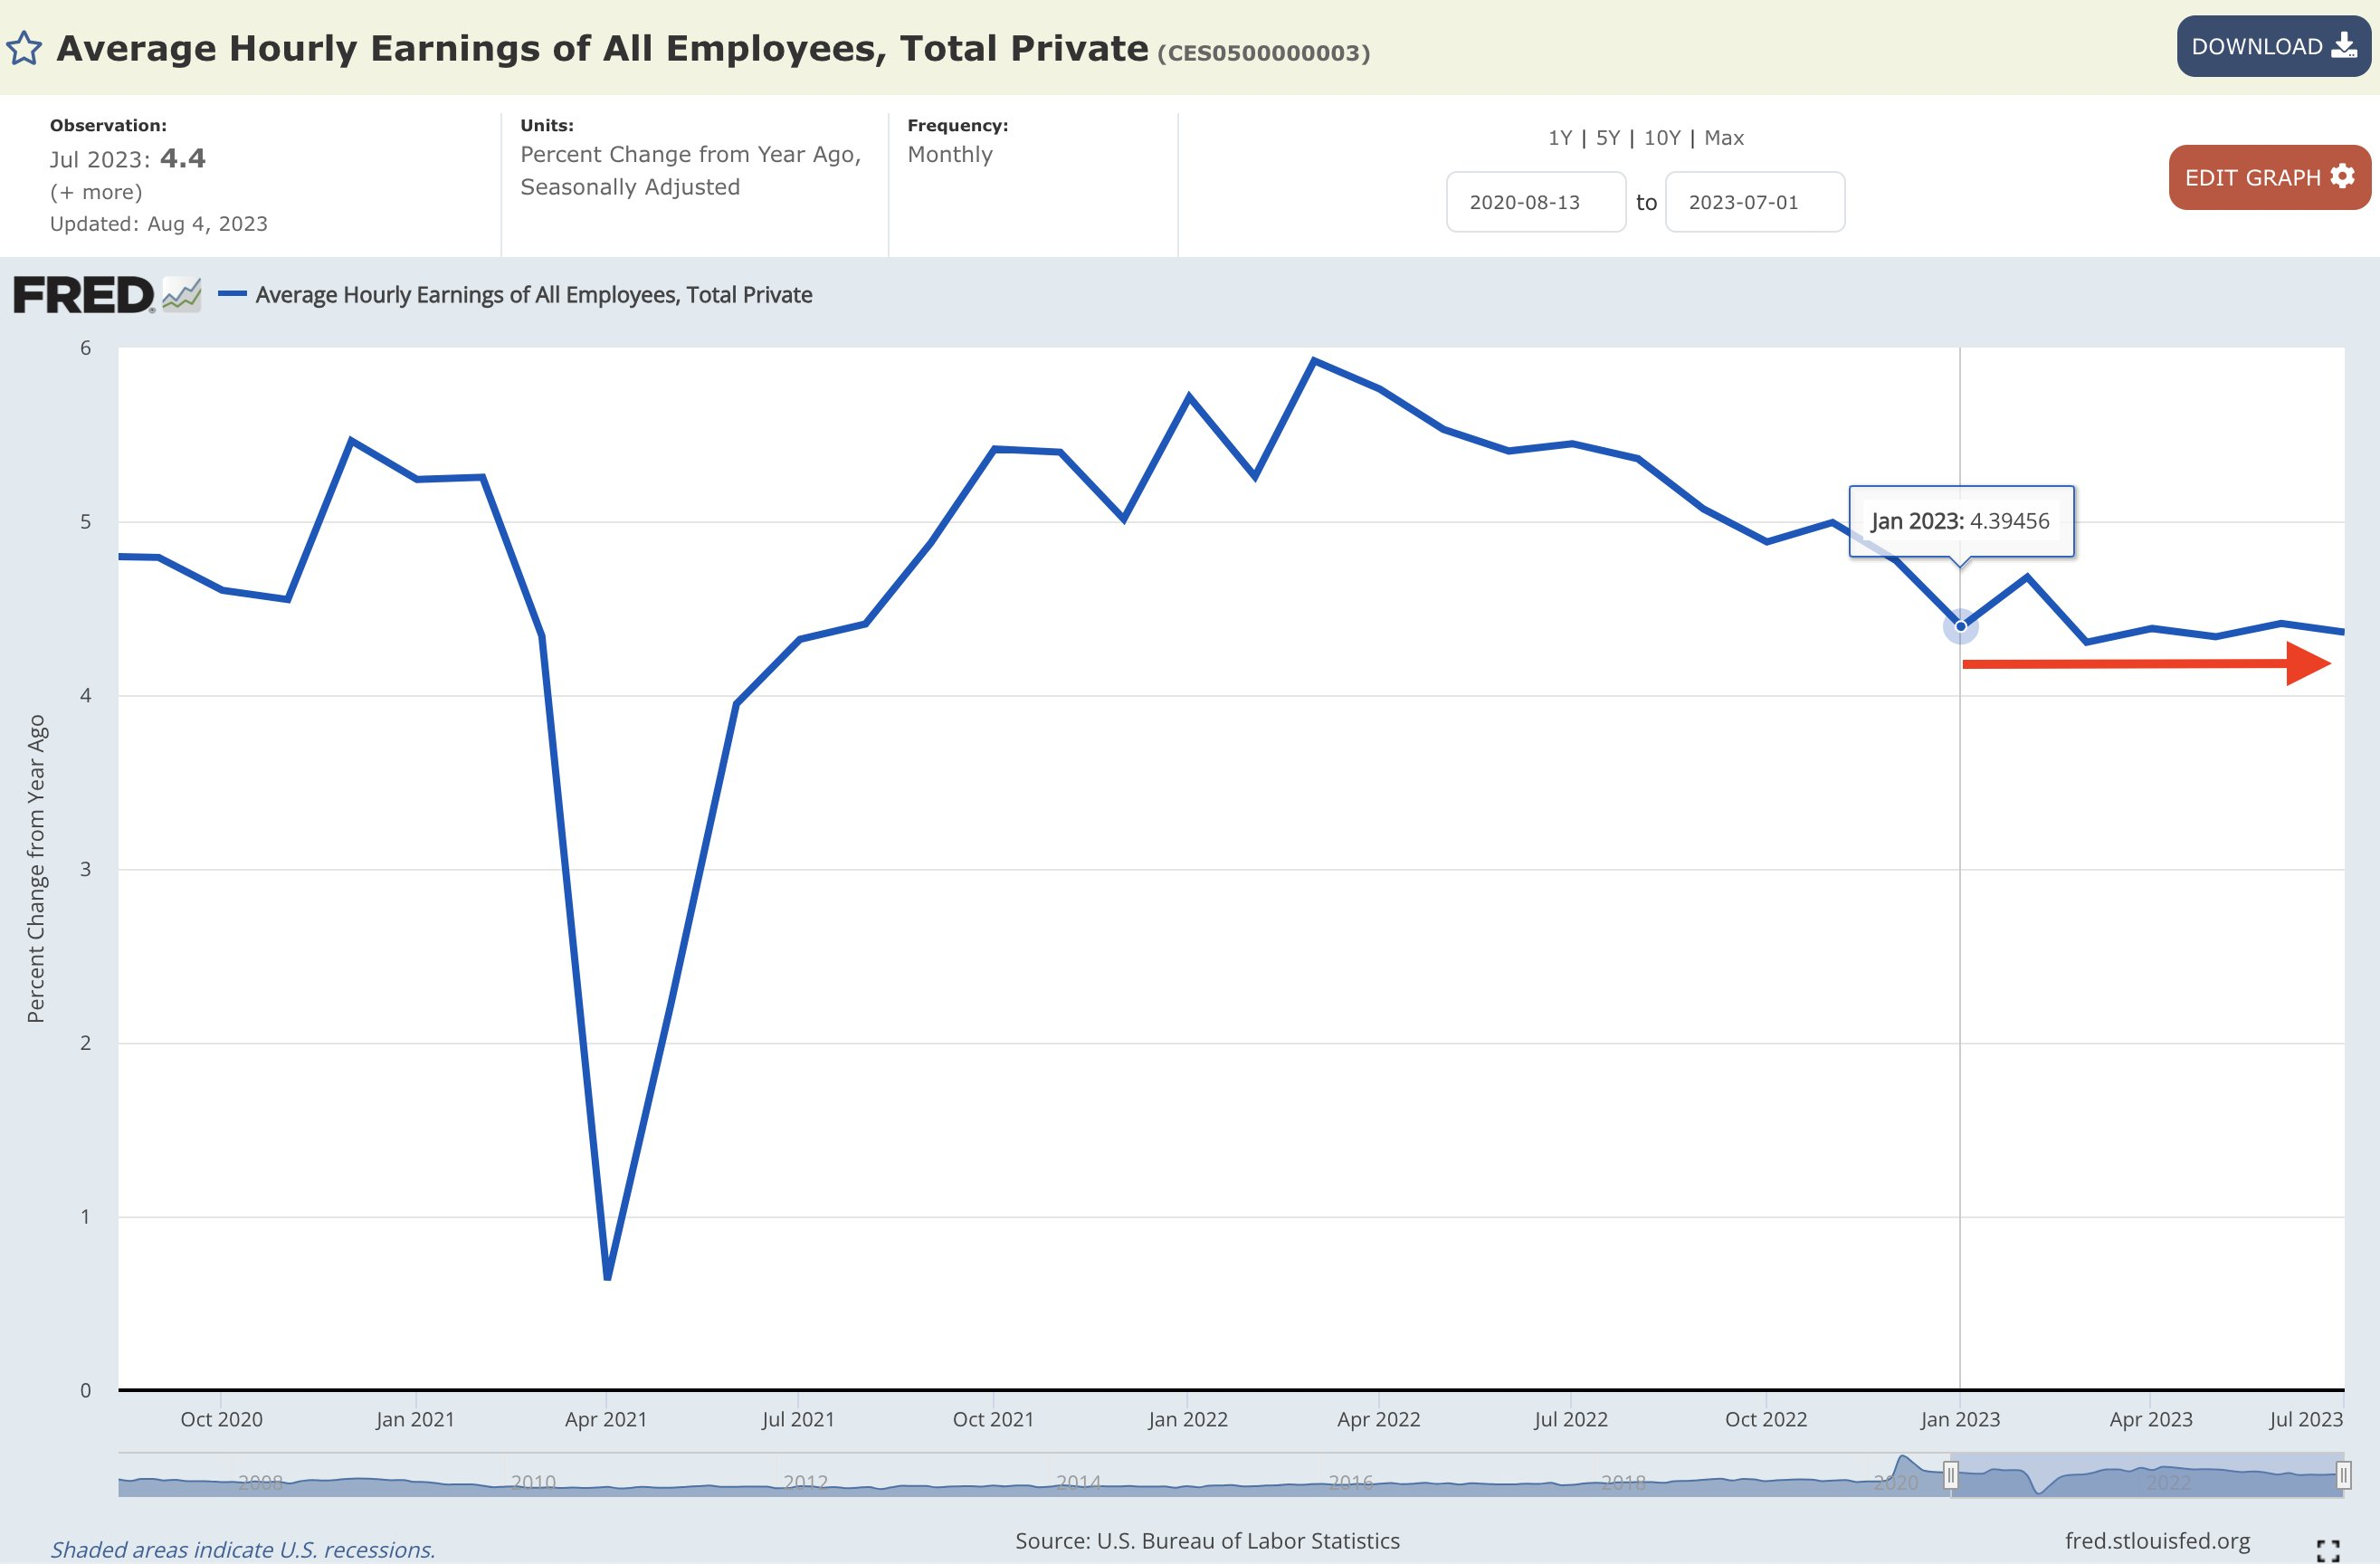
Regarding wages, the latest NFP data showed that wages increased at a pace of +4.4% YoY in July 2023.
But guess what?
Average hourly earnings have been growing at a pace of +4.4% YoY for every single month of 2023! During that time, CPI inflation has fallen from 6.3% to +3.0%.
That's important because it provides evidence that we have experienced disinflation while wages have been growing at a steady & consistent pace.
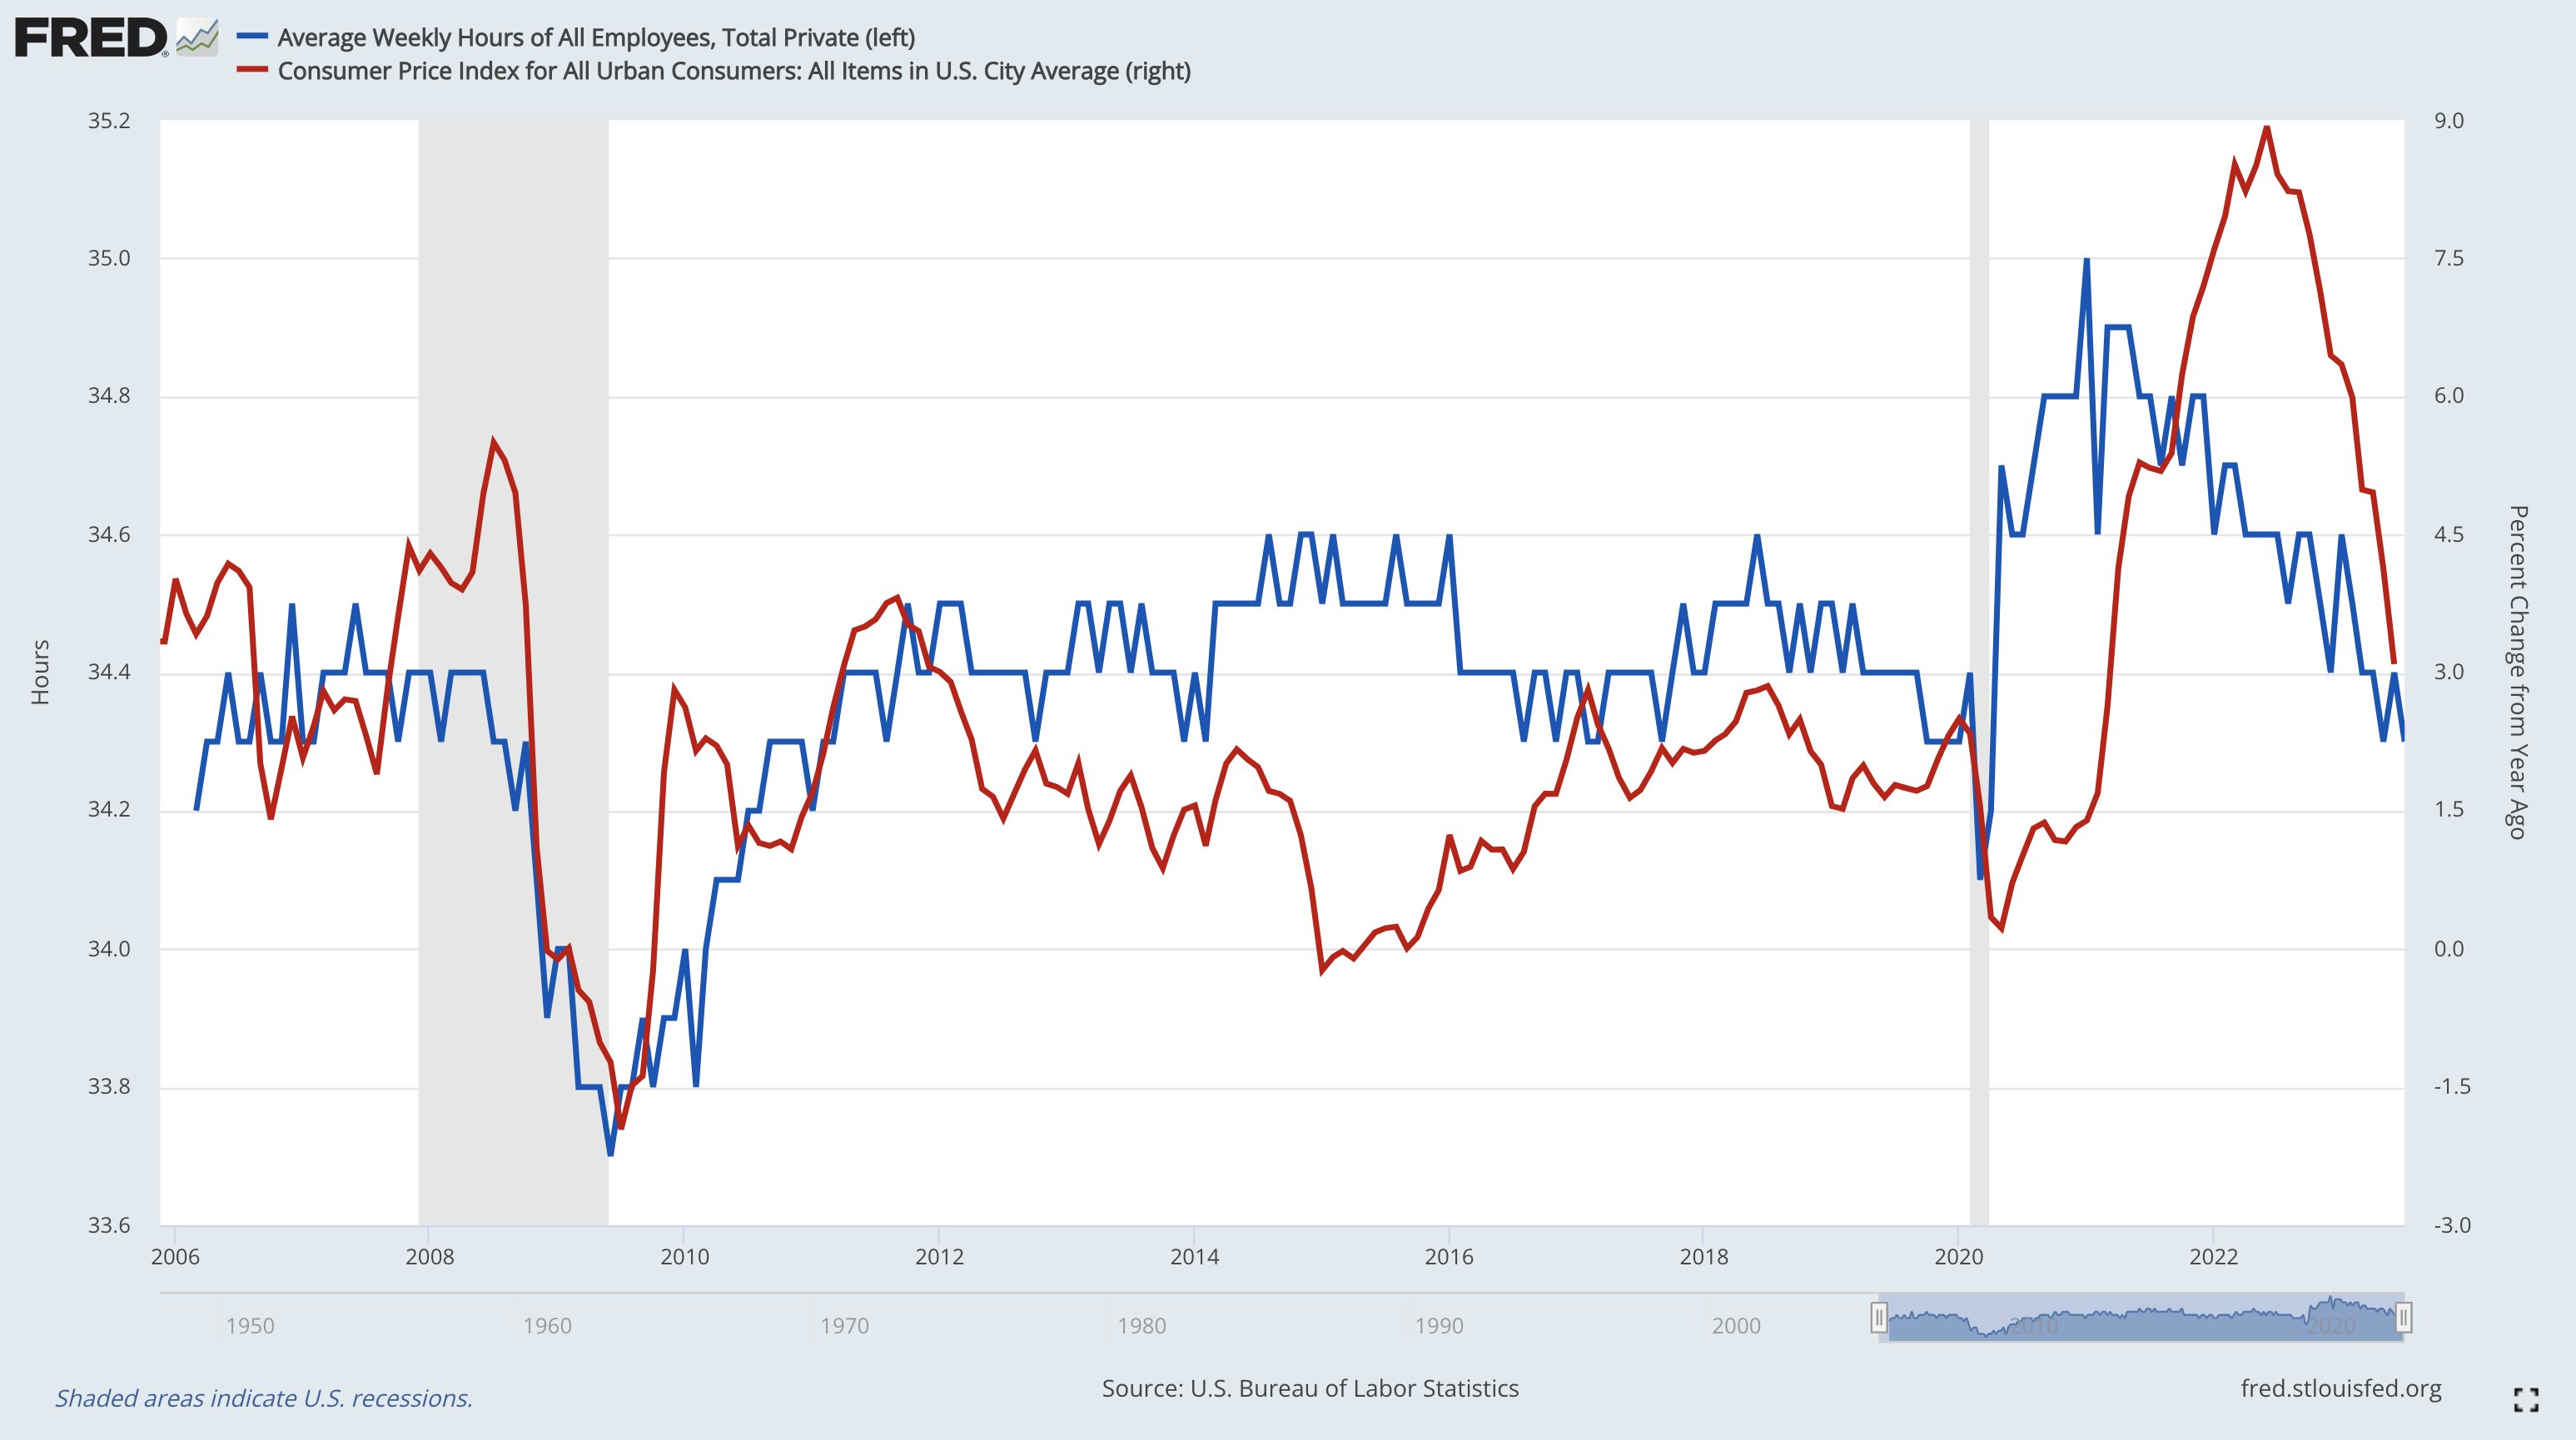
However, income is a function of wages * hours worked!
Hours worked is falling, which has a clear correlation with CPI inflation!
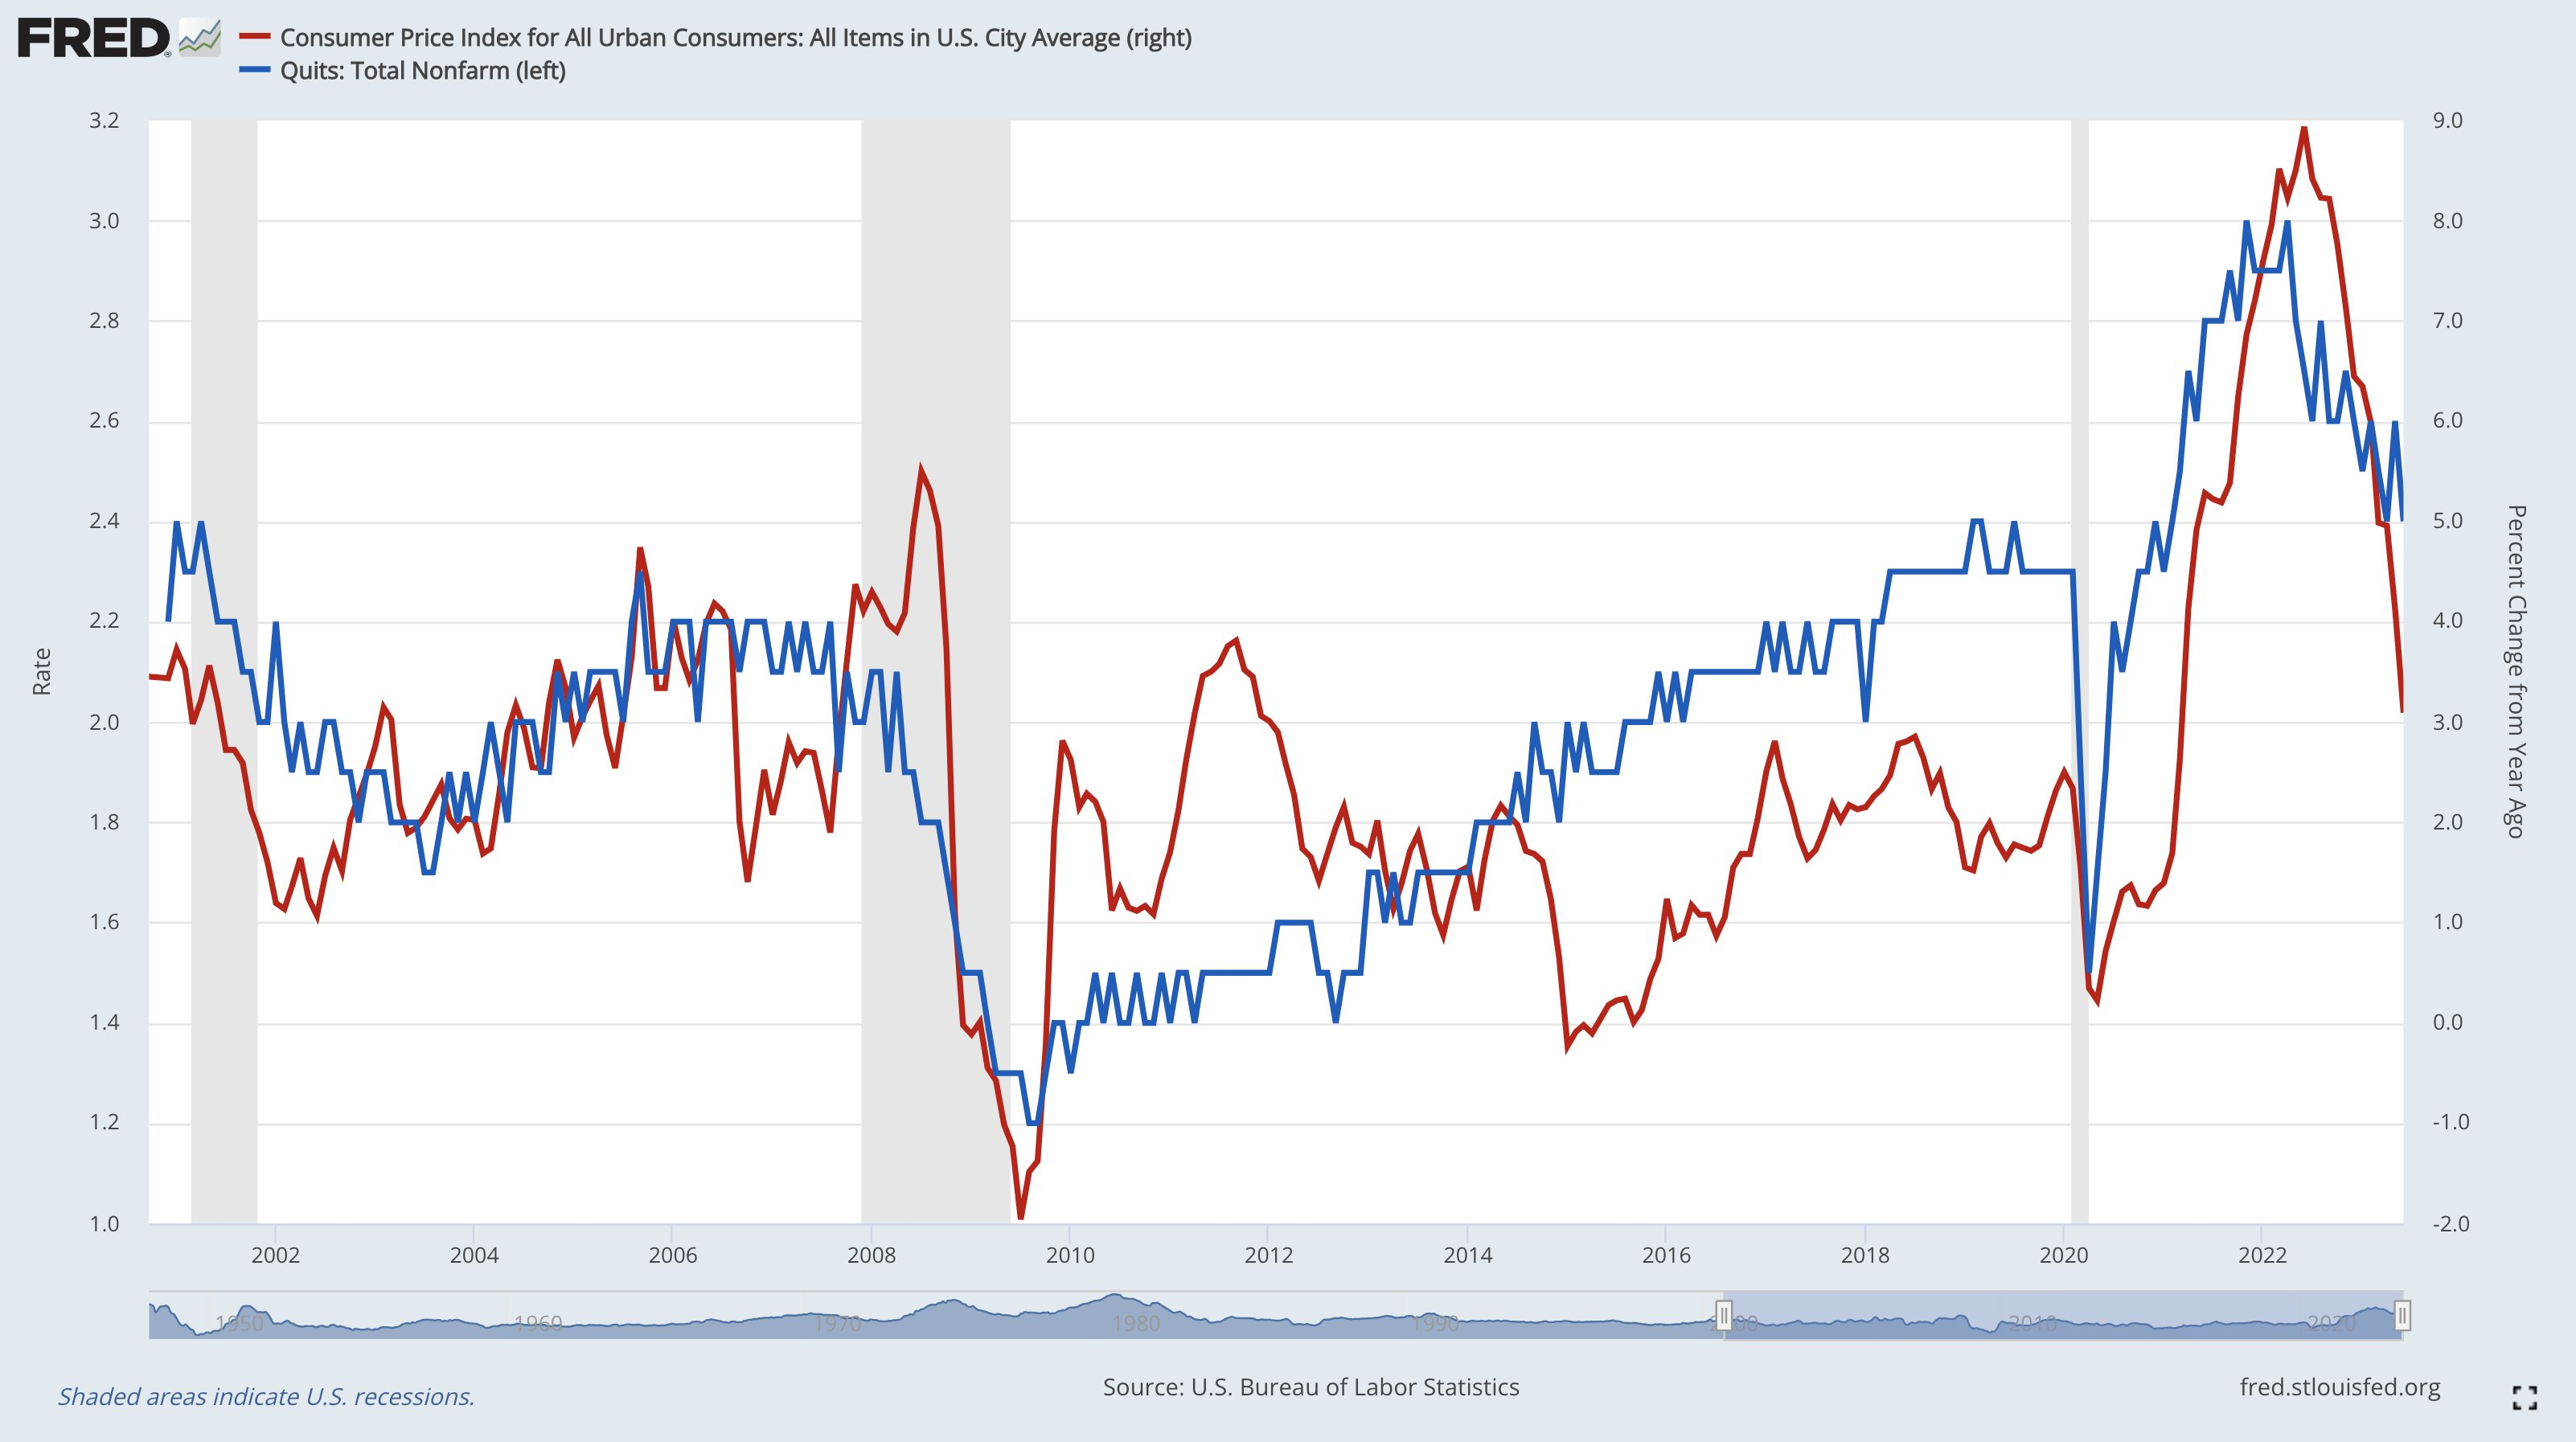
As a final thought on wages, the quits rate is showing the same thing as the average weekly hours of all employees.
As the quits rate falls, the YoY rate of inflation seems to fall.
As the quits rate rises, the YoY rate of inflation seems to rise.
Quits fell in the latest data.
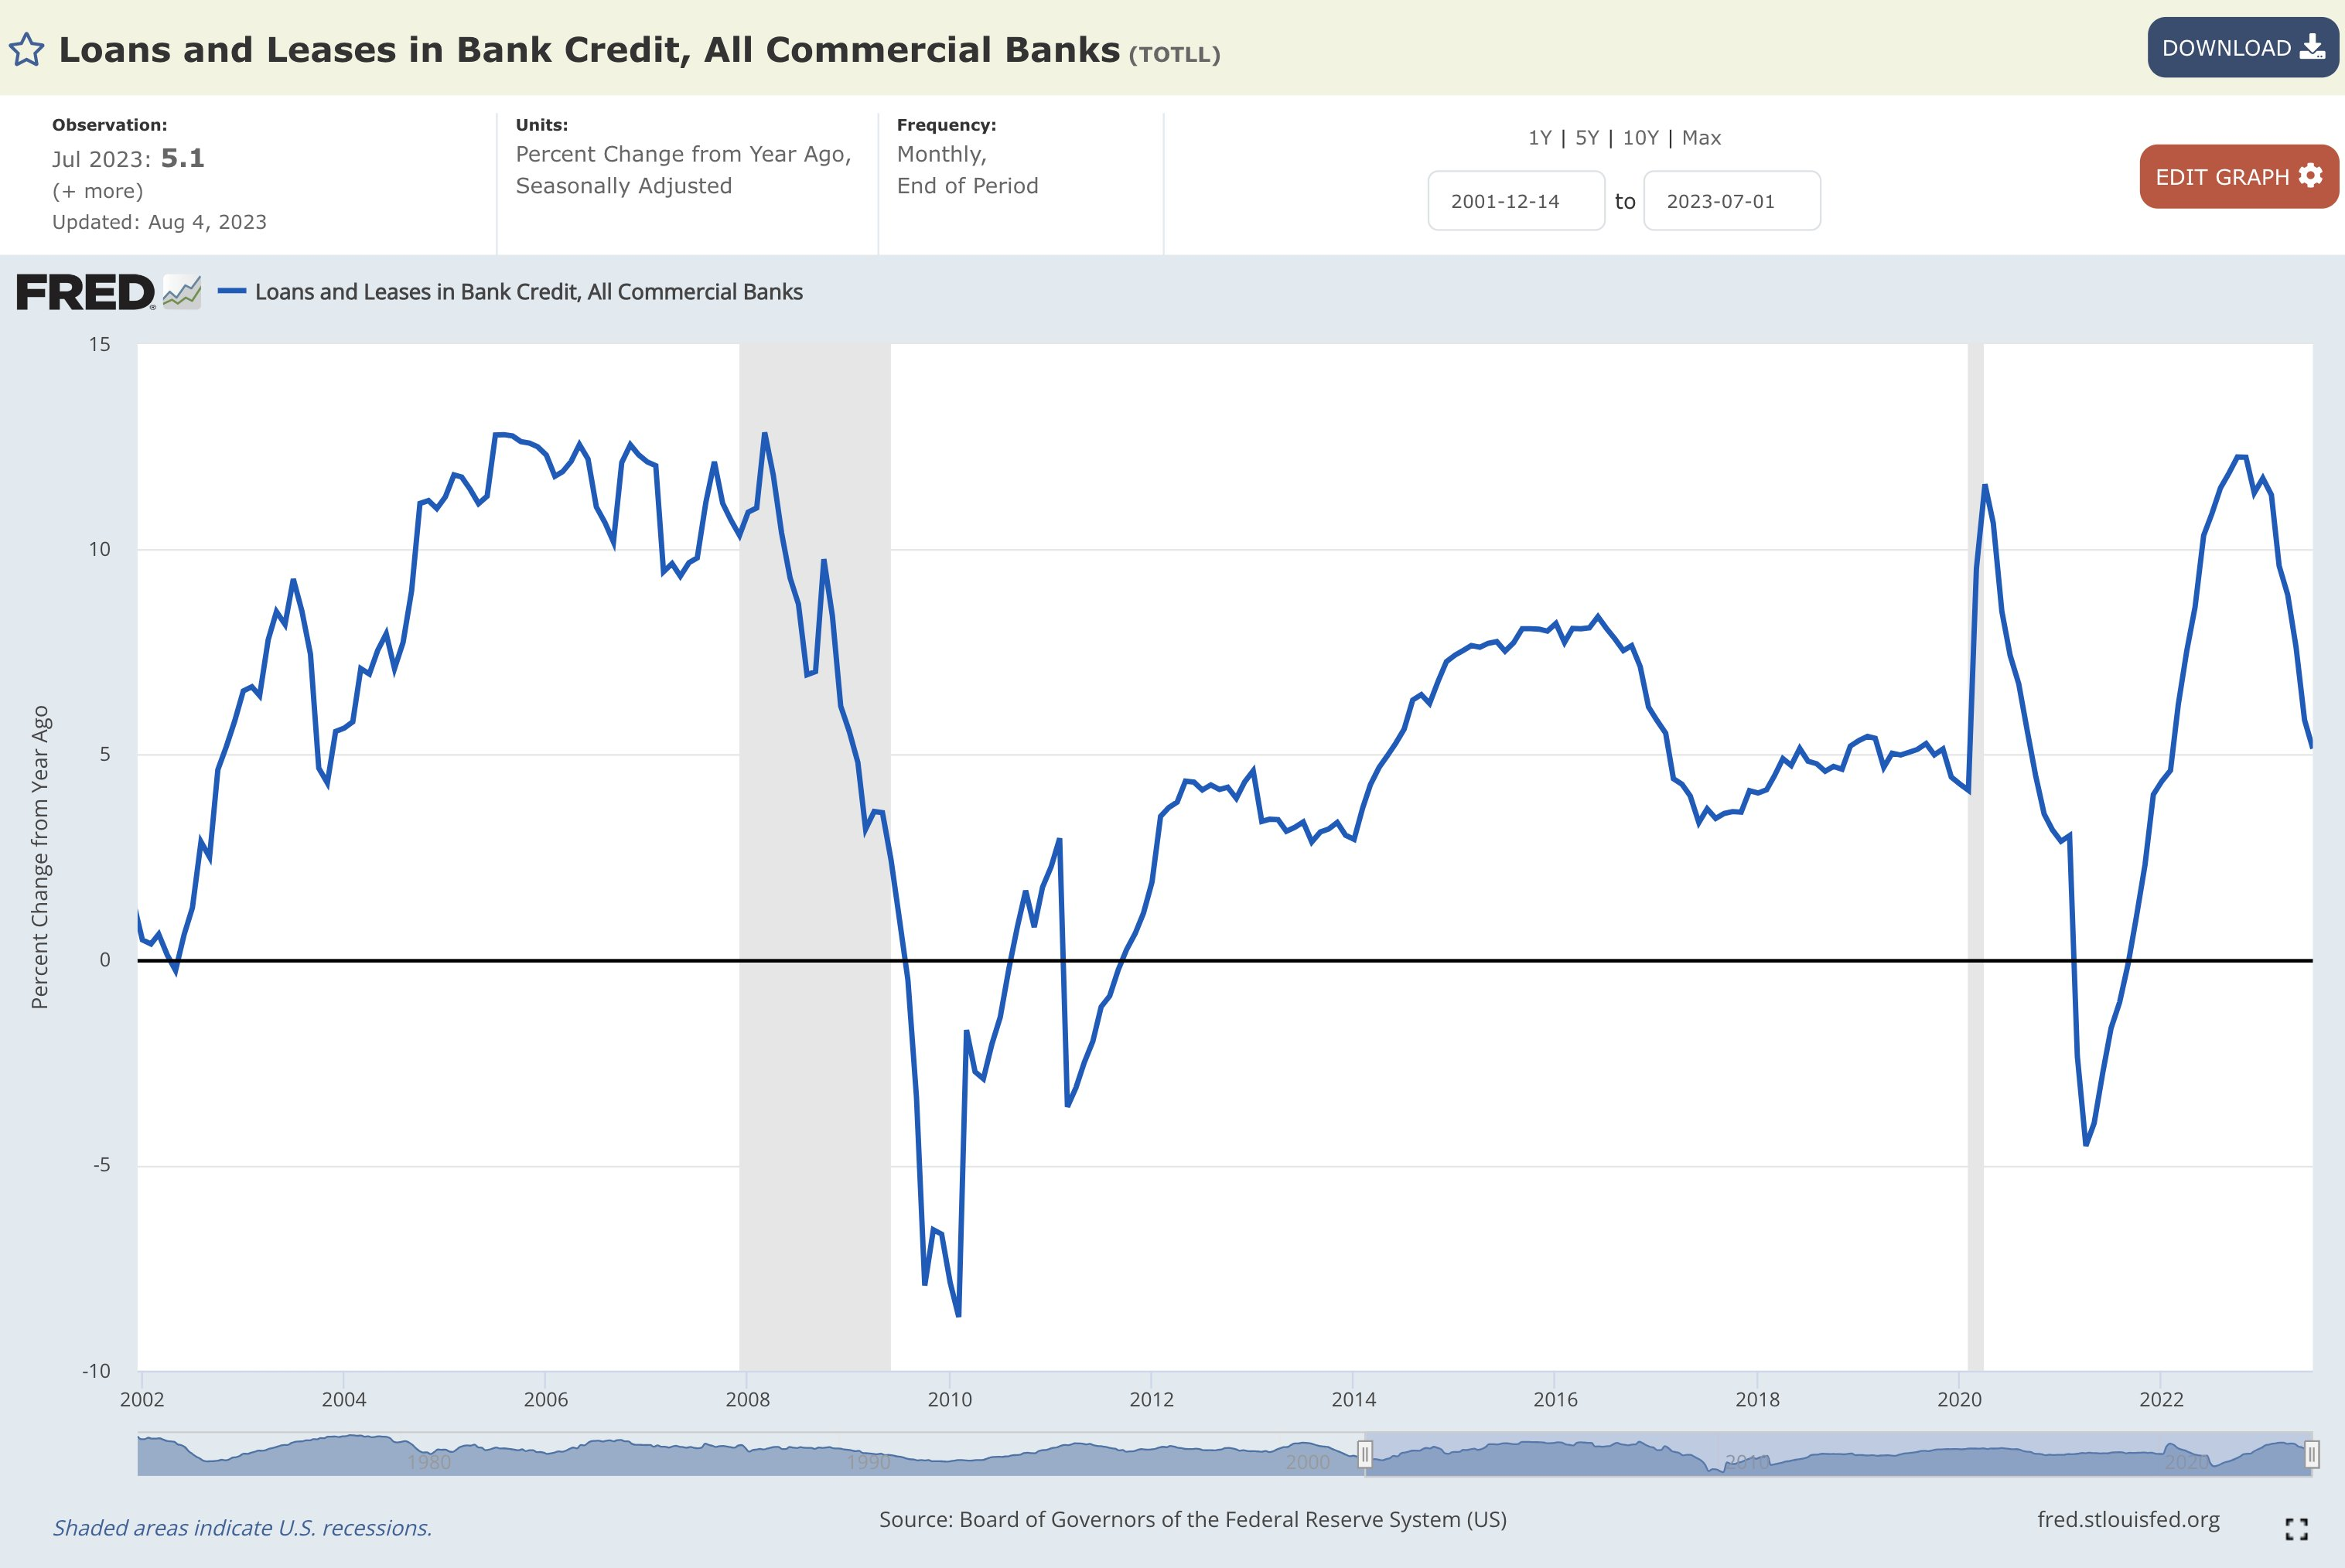
Finally, loan growth has been decelerating all year, particularly since the bank failures in Q1.
Loans & leases increased +5.1% YoY in July 2023, down from +5.85% in June'23 & +11.73% in Jan'23.
Slower loan growth = slower inflation.
M2, deposits, & reserves are contracting.
Putting all of this together, data shows us that we are still in a disinflationary environment where the rate of inflation is slowing down.
Prices are still rising, but at a slower pace.
Given the monthly acceleration in crude, it's likely that YoY inflation re-accelerates.
While the market expects to see YoY headline CPI at +3.3%, I think it will come in lower.
On a YoY basis, we're still seeing disinflation in all 4 of the components we discussed above (even energy).
I see a 20% chance that we come in lower than +3.0% & 90% chance below +3.3%.
As I showed earlier, it's common to see YoY accelerations in CPI inflation during a broader trend of disinflation.
I think we see that re-acceleration this month, but I stand behind my prediction of +2% or lower by year end.
All of the leading indicators reaffirm it. Cheers.
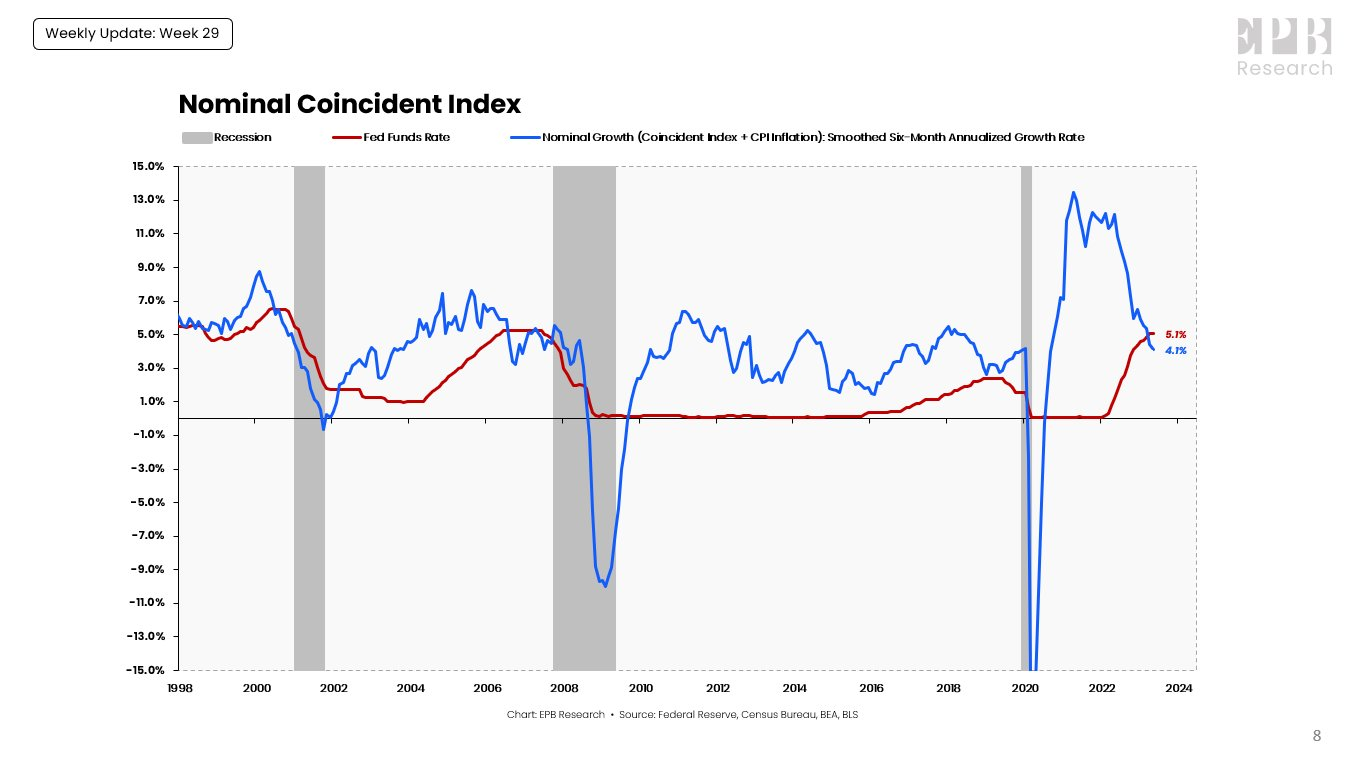
Nominal Growth
Bob is correct! Bob Elliott
The economy maintained positive nominal growth while money supply was contracting because velocity increased.
However, I don't think you should expect the same situation to continue going forward.
Here's why...
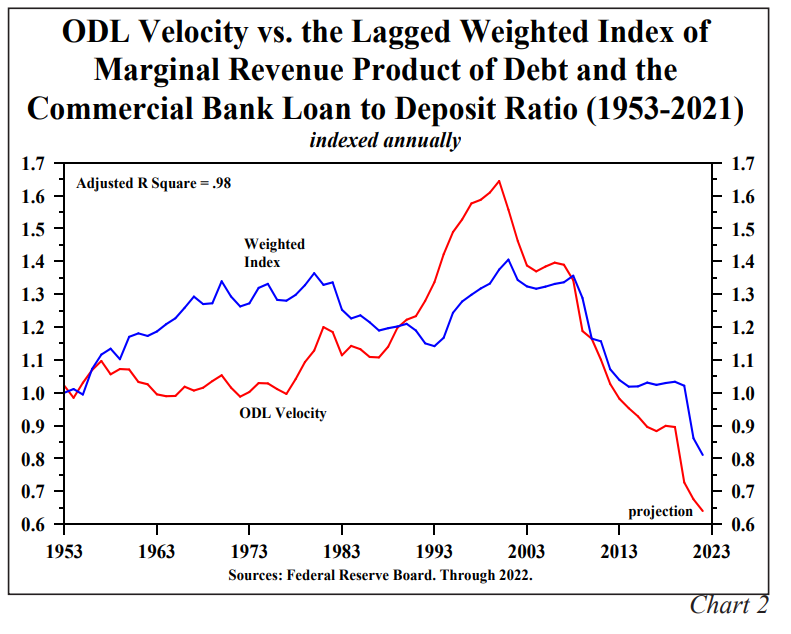
We know from the work of Dr. Lacy Hunt that velocity is heavily influenced by the Loan-To-Deposit ratio.
There are other factors, but the LD ratio is a huge driver.
So saying velocity has been increasing is like saying the Loan-to-Deposit ratio went up.
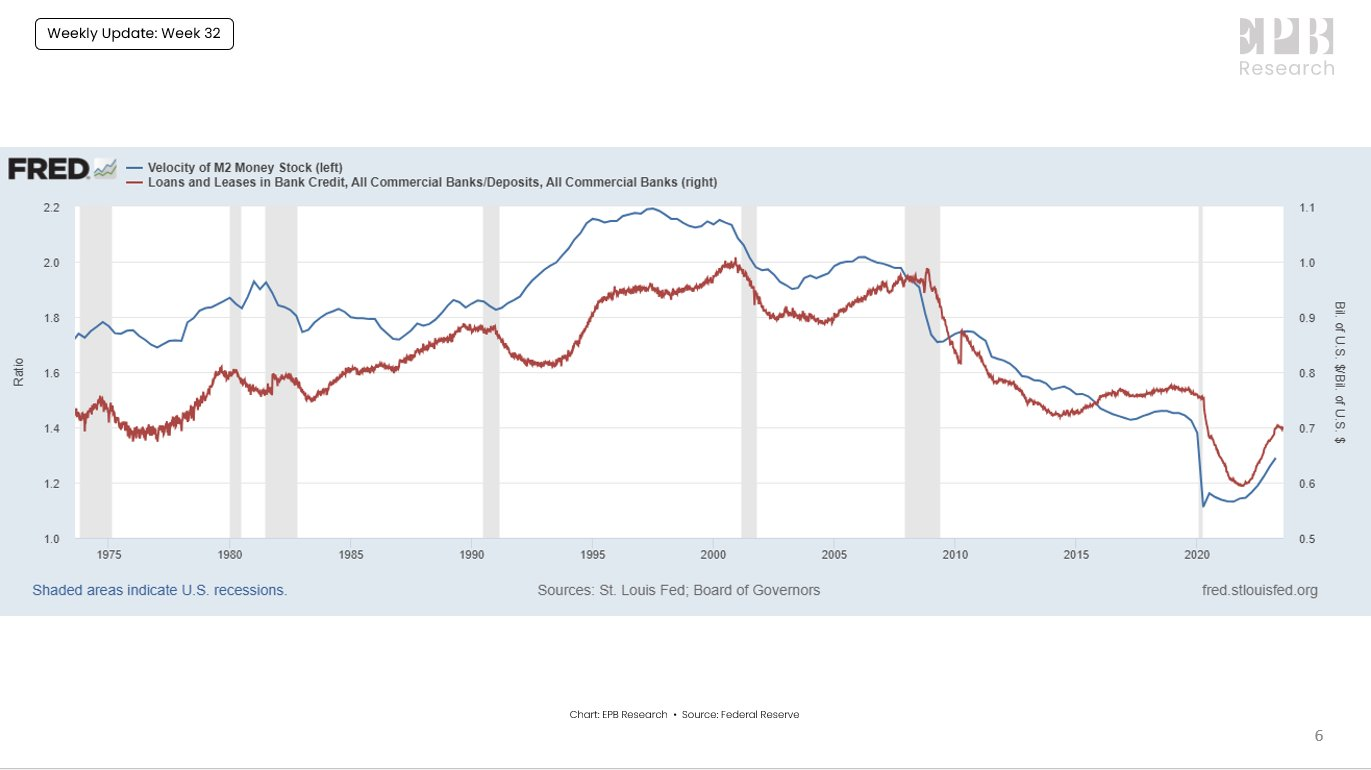
In this chart we can clearly see the relationship between the LD ratio and velocity.
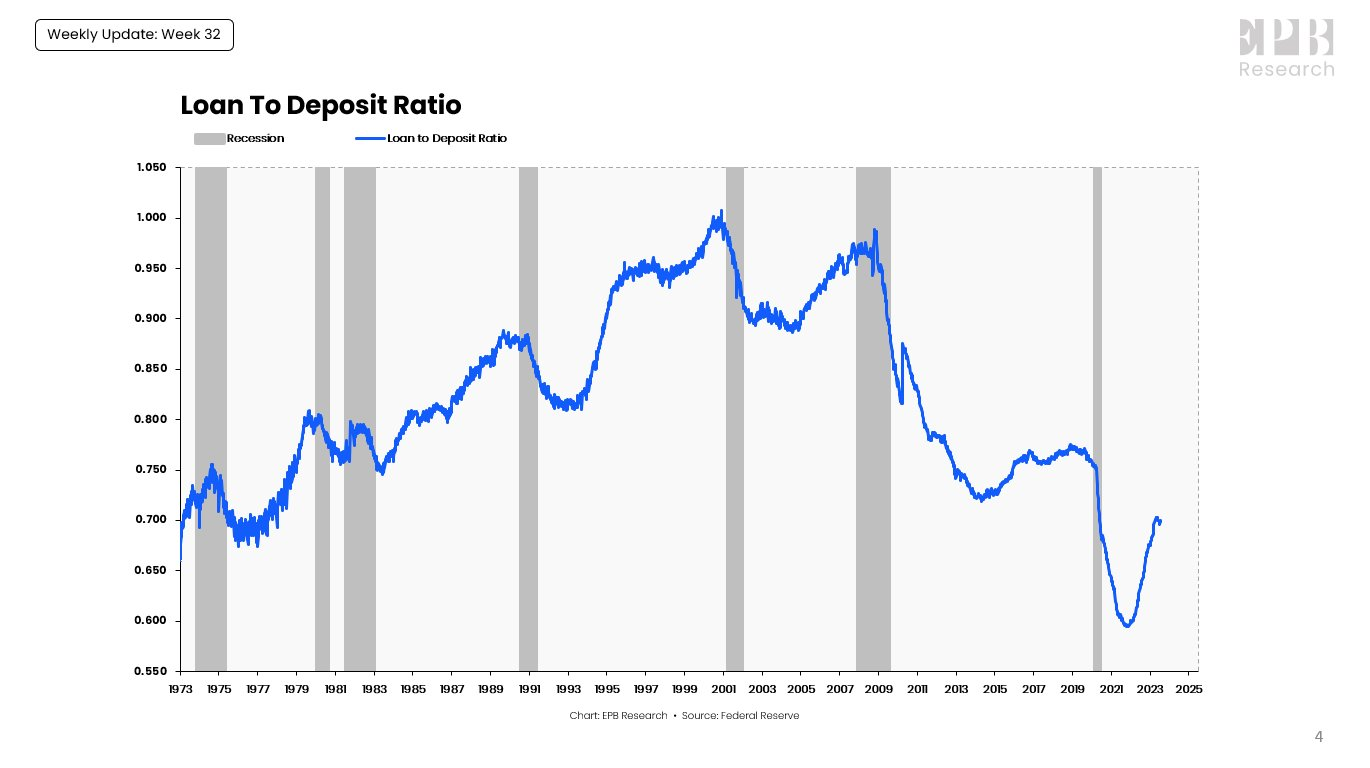
The Loan-To-Deposit ratio has increased sharply as the Fed started tightening policy.
This happens each tightening cycle because deposit growth shrinks while banks maintain lending.
(Loans are a lagging indicator).
So this pushes the loan-to-deposit ratio up initially.
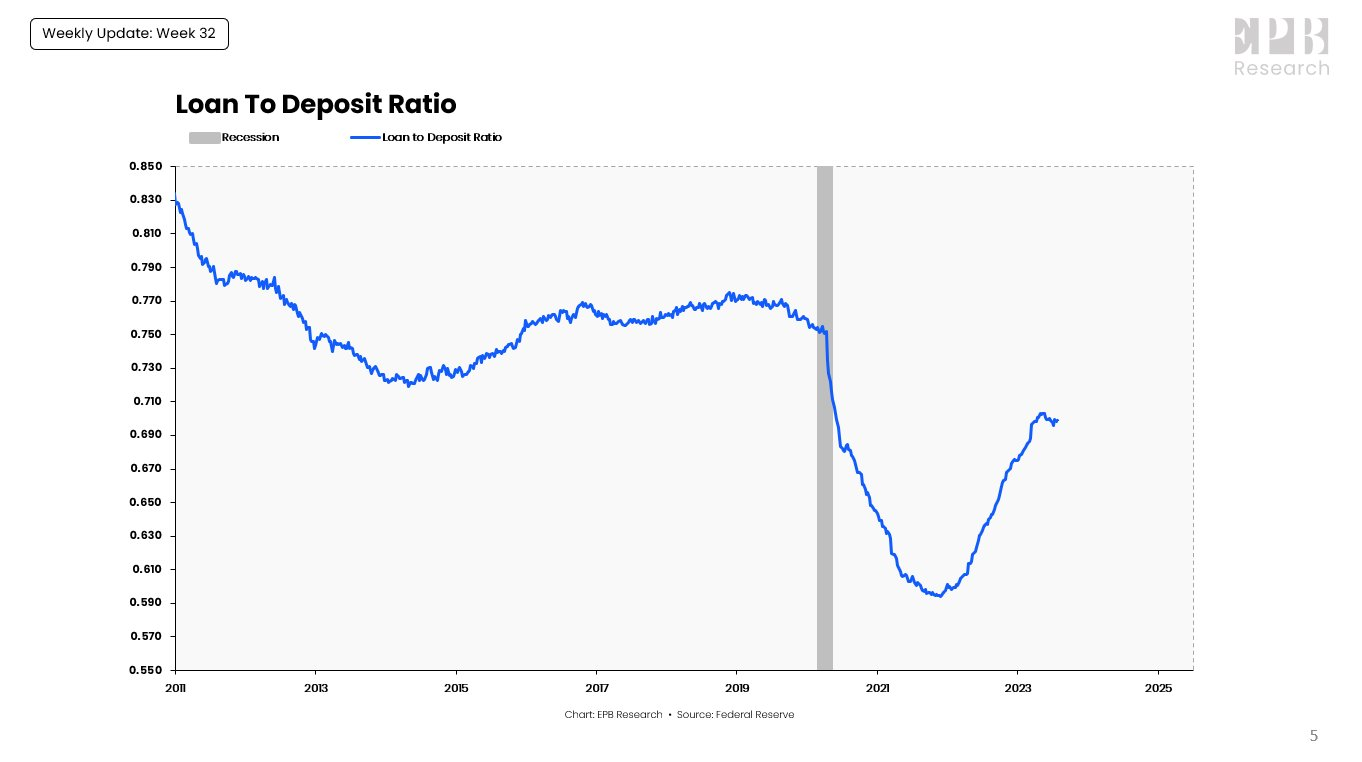
Eventually, the yield curve inverts, and problem credits emerge (CRE), so banks become less enthusiastic about a rising LD ratio.
We can see that in recent weeks, the loan-to-deposit ratio has been peaking...not immediately, but this means velocity will also flatten out.
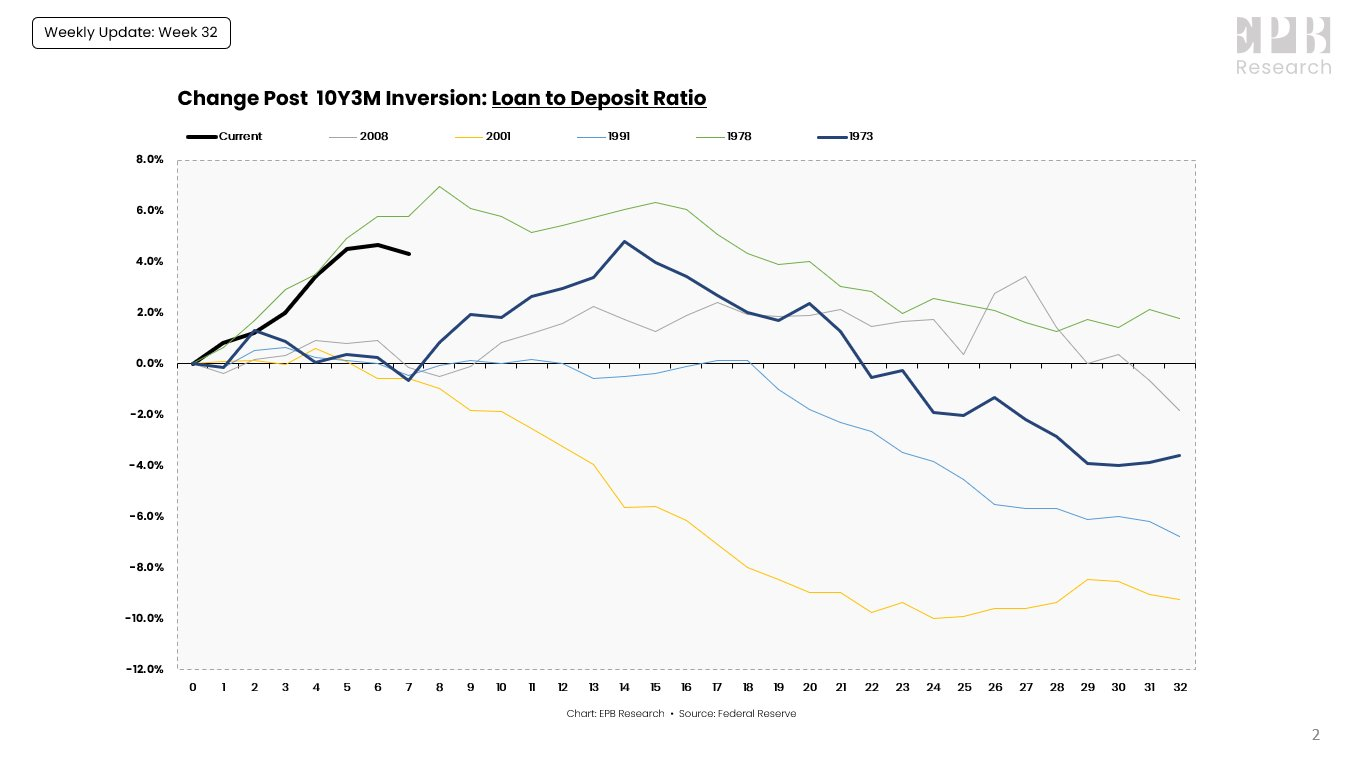
In fact, the loan-to-deposit ratio follows a relatively consistent path after the yield curve inverts.
Here's the change in the LD ratio post all yield curve inversions back to the 1970s.
The current path is in black.
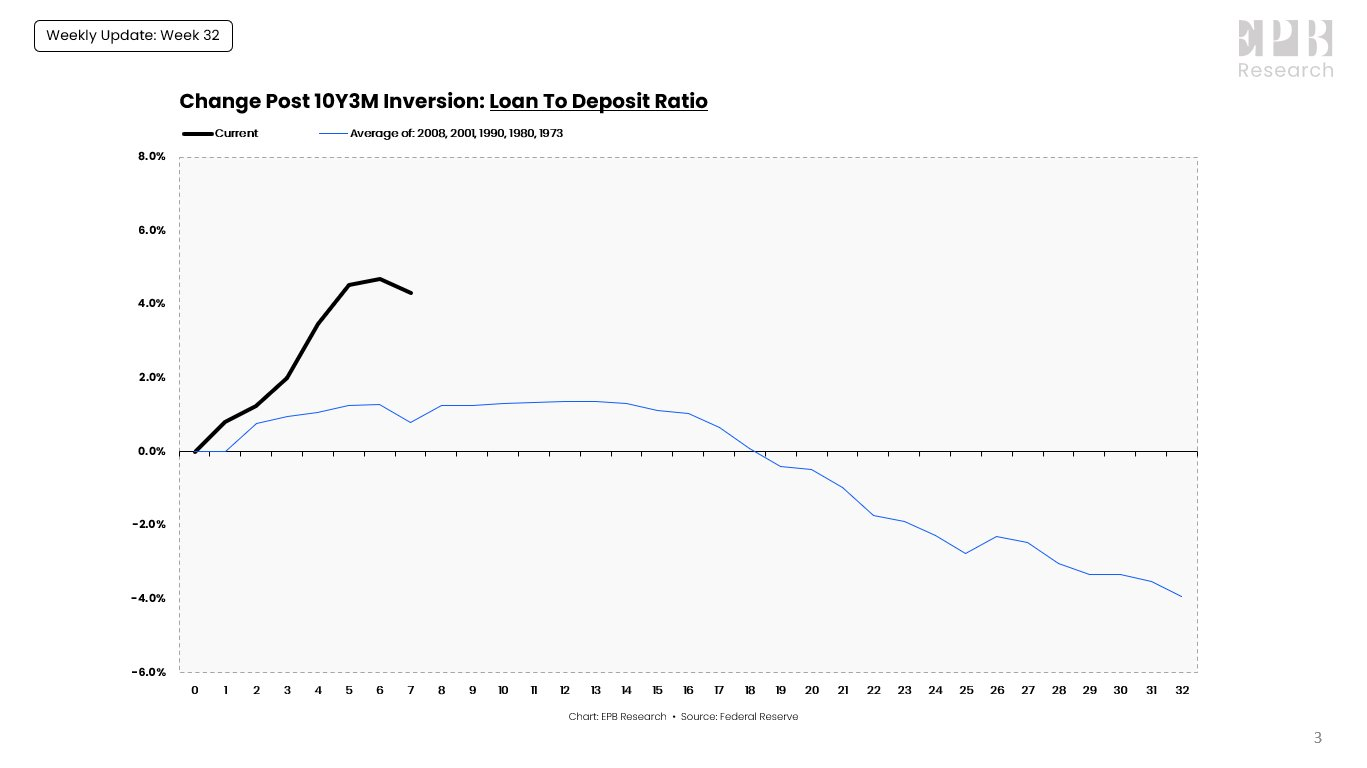
Here's today's path of the LD ratio compared to the average of all the post yield curve inversions.
The LD ratio has done a lot of heavy lifting in the last 8 months, rising somewhat in conjunction with the speed of monetary tightening (deposit contraction).
So it seems historically unlikely that we'll see a huge rise in the LD ratio from here.
The most likely outcome is that it actually trends lower as recessionary conditions bite post-yield curve inversion.
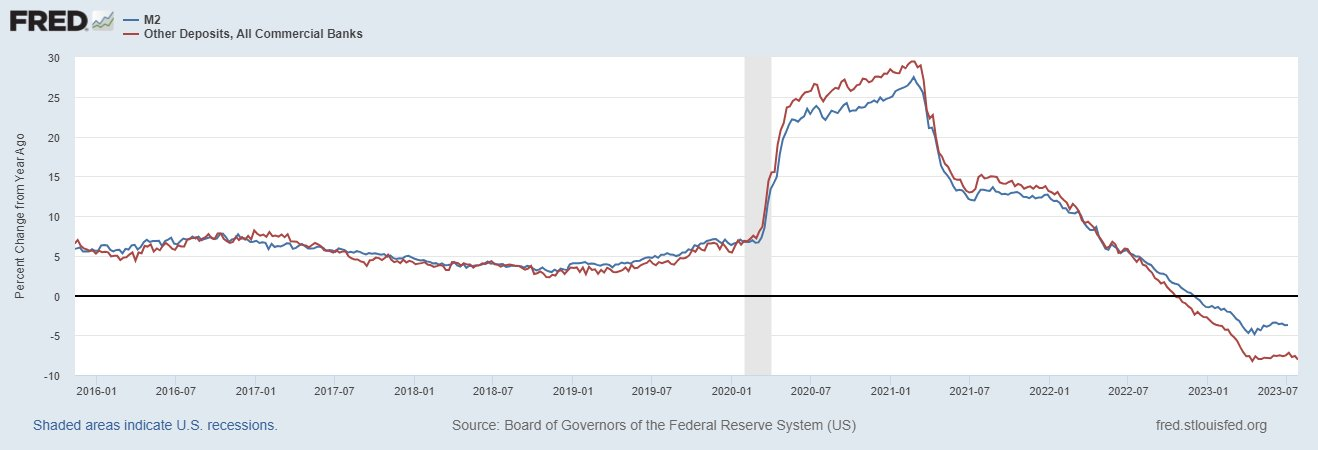
If the LD ratio won't rise much, then negative money growth does become a problem.
We can get an early look at money growth by using Other Deposits as a weekly proxy.
Money growth is likely to remain negative.
So if money growth is to remain negative, the LD ratio must continue to rise to put upward pressure on velocity and keep nominal growth from decelerating further.
The trending level of nominal growth is already falling below the overnight rate.
SF Fed - Inflation
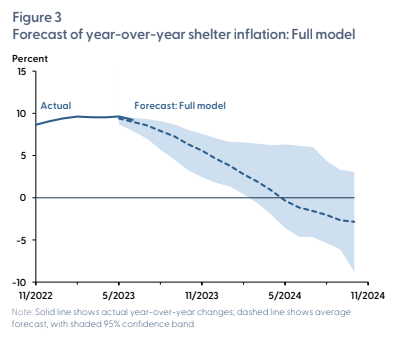
SF Fed researchers run a model showing "year-over-year shelter inflation will continue to slow through late 2024 and may even turn negative by mid-2024."
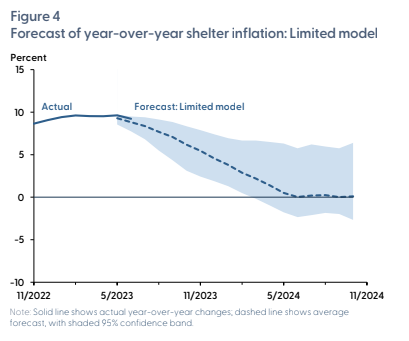
A different model shows no deflation, but still zero price growth in 2H 2024
Source Tweet - Nick Timiraos
Where Is Shelter Inflation Headed?
Reddit Message Boards > Fundamental Analysis

Analysis Articles