먼저,
ADHOC QUERY (애드혹 쿼리)란?
애드혹 쿼리(ad-hoc-query)는 사용자가 직접 쿼리 명령 및 함수를 사용하여 직접 입력하는 방식으로 데이터를 추출하는 쿼리를 의미함
(출처: https://docs.logpresso.com/ko/enterprise/4.0/ui/query)
예시 1

코드
select
  cust.customer_state,
  count(distinct ord.order_id) as ord_cnt,
  count(distinct cust.customer_unique_id) as cust_cnt
from zerobase-olist-440106.olist.olist_orders as ord
left join zerobase-olist-440106.olist.olist_customers as cust
on ord.customer_id = cust.customer_id
group by cust.customer_state
order by count(distinct ord.order_id) 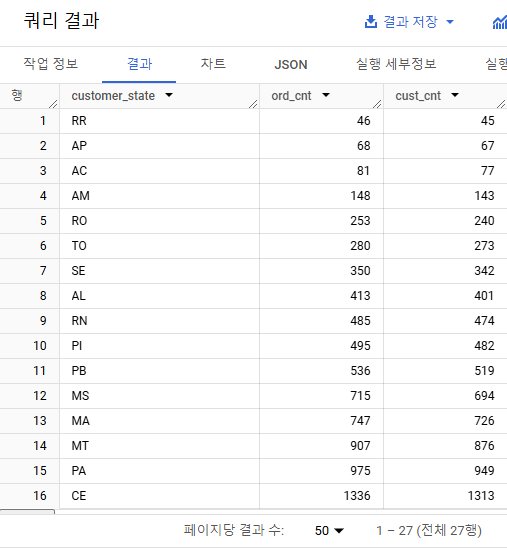
예시 2

코드
select ord.order_id, cust.customer_state
from zerobase-olist-440106.olist.olist_orders as ord
left join (
  select
    customer_id,
    customer_unique_id,
    customer_state
  from zerobase-olist-440106.olist.olist_customers
  where customer_state in ('SP', 'RJ')) as cust
  -- customer 테이블에서 SP, RJ에 속하는 값만 가져와서 join
on ord.customer_id = cust.customer_id
where cust.customer_state is not null;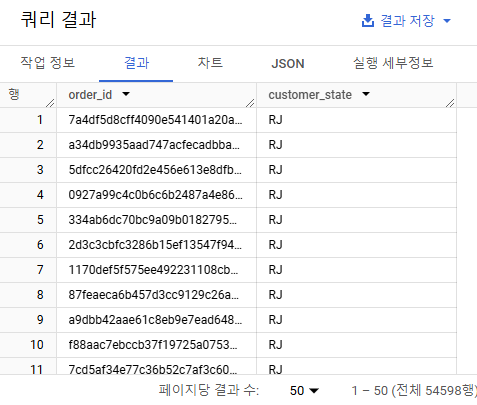
예시 3

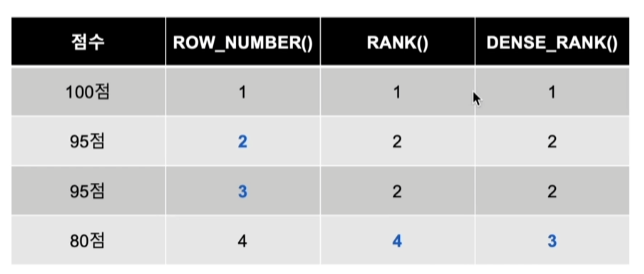
순위/행 번호를 매기는 방법!
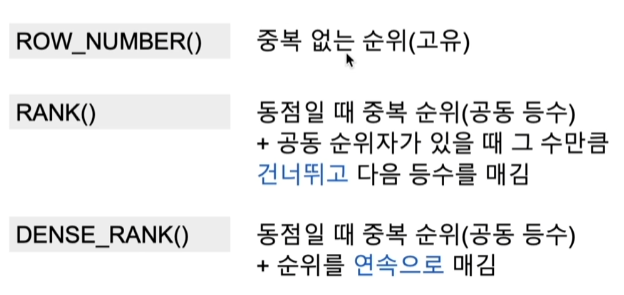
즉, 아래 그림처럼 됨
순위를 매길 때는 OVER 절을 사용하면 됨
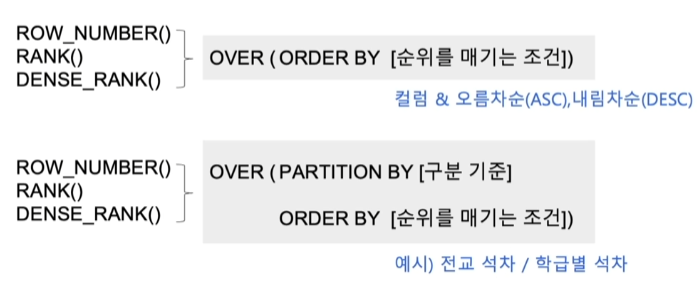
예를 들어, 'score' 컬럼을 기준으로 순위를 매길 경우의 코드
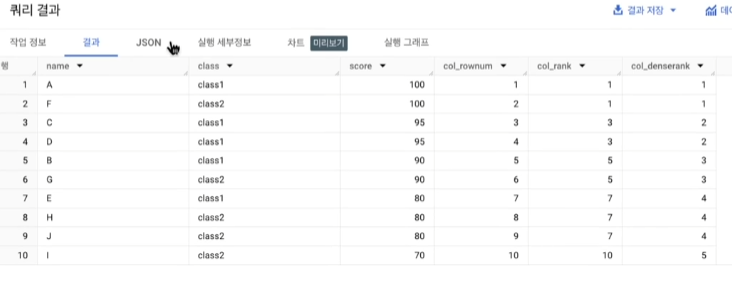
select *,
ROW_NUMBER() OVER (order by score desc) as col_rownum,
RANK() OVER (order by score desc) as col_rank,
DENSE_RANK() OVER (order by score desc) as col_denserank
from table;
결과는 아래와 같음
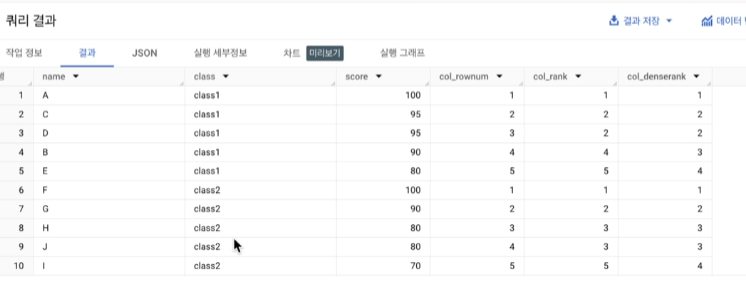
만약, 'class'별 'score'을 알고 싶다면, 아래처럼 partition by를 이용하면 됨 (class와 score 모두 컬럼임)
select *,
ROW_NUMBER() OVER (partition by class order by score desc) as col_rownum,
RANK() OVER (partition by class order by score desc) as col_rank,
DENSE_RANK() OVER (partition by class order by score desc) as col_denserank
from table;
결과는 아래와 같음
이걸 활용해서 요청사항 풀어보기~
코드
-- 2017년 && 배송 완료된 건만 추출하기
with order2 as(
select *
from zerobase-olist-440106.olist.olist_orders as ord
where EXTRACT(YEAR from ord.order_approved_at) = 2017
and ord.order_status = 'delivered'),
-- order_id별 매출 합 구하기
item2 as(
select
item.order_id,
sum(item.price) as ord_amount
from zerobase-olist-440106.olist.olist_order_items as item
group by item.order_id
),
-- 위에서 구한 테이블 2개와 customer 테이블을 join하여,
-- state별 + city별로 원하는 데이터 집계하기
result as(
-- group by 1, 2를 하면
-- 첫번째, 두번째로 select한 데이터를 가지고 그룹핑해줌 (여기선 state, city)
select
cust.customer_state as state,
cust.customer_city as city,
count(distinct ord.order_id) as ord_cnt,
count(distinct cust.customer_unique_id) as cust_cnt,
sum(item2.ord_amount) as ord_amount
from order2 as ord
inner join item2
on ord.order_id = item2.order_id
left join zerobase-olist-440106.olist.olist_customers as cust
on ord.customer_id = cust.customer_id
group by 1,2)
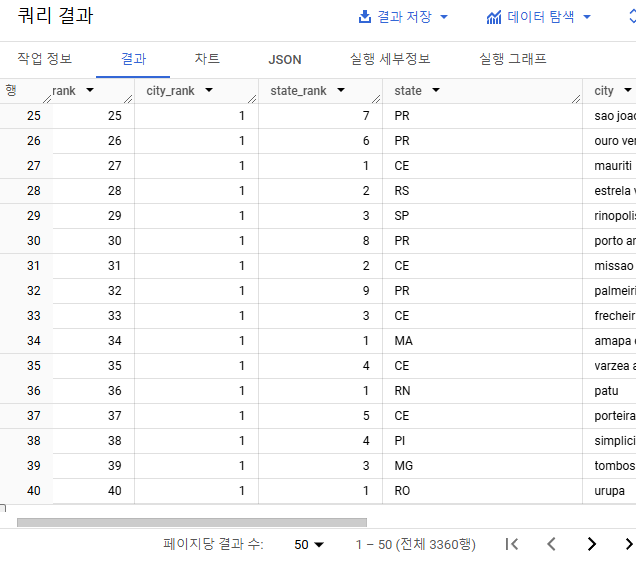
-- 위의 집계 결과(result 테이블)로 순위 매기기
select
row_number() over (order by ord_amount) as total_rank,
row_number() over (partition by city order by ord_amount) as city_rank,
row_number() over (partition by state order by ord_amount) as state_rank,
*
from result
order by total_rank결과
예시 4
아래는 '객단가'에 대한 질문임. 즉, 고객 1명당 평균적으로 얼마나 소비하는지.

객단가 = (건당 주문 금액 x 주문 빈도) 로 구할 수 있음
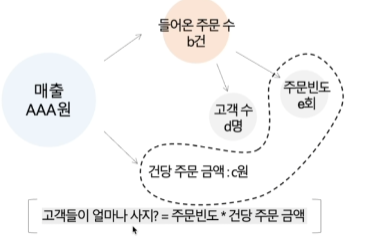
객단가 관련 용어
ARPU : Average Revenue Per User (매출 / 사용자 수)
ARPPU : Average Revenue Per Paid User (매출 / 구매자 수)
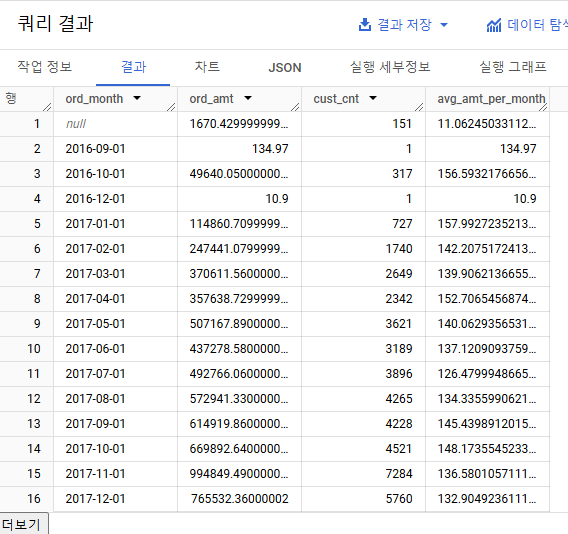
코드
select
  date_trunc(date(ord.order_approved_at), month) as ord_month,
  sum(item.price) as ord_amt,
  count(distinct cust.customer_unique_id) as cust_cnt,
  safe_divide(sum(item.price), count(distinct cust.customer_unique_id)) as avg_amt_per_month
from zerobase-olist-440106.olist.olist_orders as ord
left join zerobase-olist-440106.olist.olist_order_items as item
on ord.order_id = item.order_id
left join zerobase-olist-440106.olist.olist_customers as cust
on ord.customer_id = cust.customer_id
group by ord_month
order by ord_month;
결과
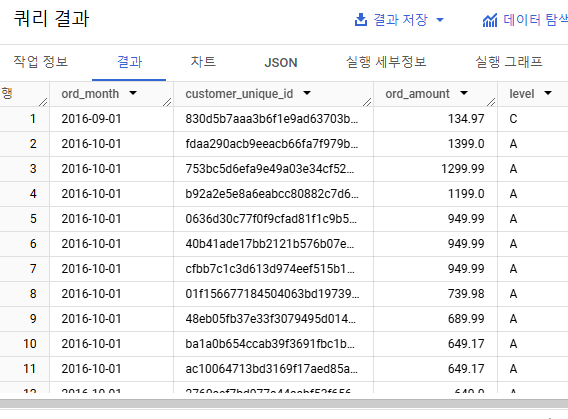
예시 5
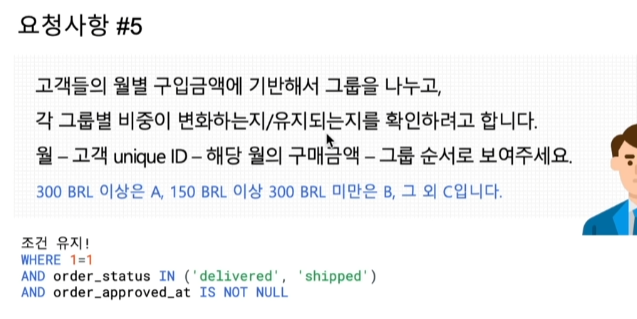
이렇게 객단가별로 등급을 매긴 테이블을 만들면, 시각화 툴을 통해 등급별 비중 변화를 살필 수 있음
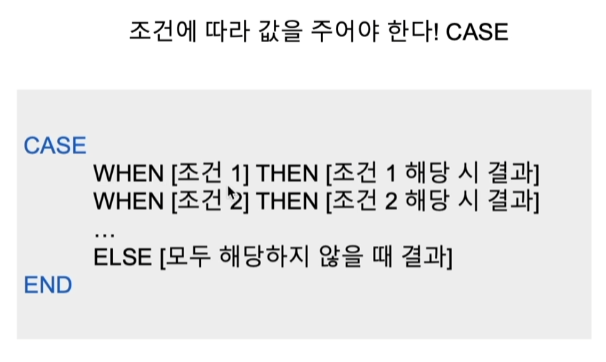
위처럼 조건에 따라 값을 부여해야 할 경우, CASE를 이용하면 됨
코드
select
  date_trunc(date(ord.order_approved_at), month) as ord_month,
  cust.customer_unique_id,
  sum(item.price) as ord_amount,
  case when sum(item.price) >= 300 then 'A'
  when sum(item.price) >= 150 and sum(item.price) < 300 then 'B'
  else 'C' end as level
from zerobase-olist-440106.olist.olist_orders as ord
inner join zerobase-olist-440106.olist.olist_order_items as item
on ord.order_id = item.order_id
left join  zerobase-olist-440106.olist.olist_customers as cust
on ord.customer_id = cust.customer_id
where 1=1
  and order_approved_at is not null
group by 1,2
order by ord_month ASC, ord_amount DESC;
결과
🔵 흥미로웠던 점:
요청 사항을 가정하여 쿼리를 작성하니 데이터 분석 일의 흐름을 맛 볼 수 있었다. 블럭으로 성을 쌓듯이 하나하나 필요한 부품(테이블)을 직접 만들어가는 과정이 재밌었다.
🔵 다음 학습 계획:
해당 데이터셋을 tableau에서도 사용하며 지표를 추출할 것입니다.