Today
강의
R 프로그램, 통계 19강 까지
스터디 내용
17. 문자열4, 단어순서 바꾸기, reverse words, string
rev_word <- function(string){
a <- strsplit(string, split = " ")
str_length <- length(a[[1]])
reversed <- a[[1]][str_length:1]
paste(reversed, collapse =" ")
}

rev_word("how are you?, what rudoing")
18. Chi-square test
data <- matrix(c(42,30,50,87), nrow = 2, byrow = FALSE)
data

#H0

chisq <- function(obs){
        Expected <- outer(rowSums(obs), colSums(obs)) / sum(obs)
        sum((obs-Expected)^2/Expected)}

chisq(data) # 상관이 없었다면 나와야 할 값이 나타남.

rowSums(data) # 각 행의 값

rs <- rowSums(data)
cs <- colSums(data)

rs
cs

117*72

outer(rs,cs) # 각 각의 곱들이 나타남.
outer(rs,cs) / sum(data)

1 - pchisq(9.132947, 1)

chisq.test(data, correct = FALSE)
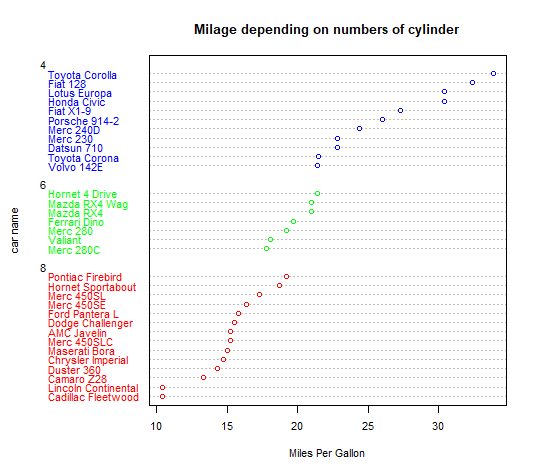
19. dotchart 점 그래프
dotchart
x <- 1:10
y <- x - 1
plot(y~x)

plot(mtcars$mpg)


dotchart(mtcars$mpg, labels=row.names(mtcars), cex = 0.7) # 이산형 값으로 그래프를 그림


carmpg <-mtcars[order(mtcars$mpg),] # 콤마를 기준으로 행 열이 나뉘고 order함수로 sort 기능 사용.
carmpg$cyl <- factor(carmpg$cyl)
class(carmpg$cyl) # factor class

carmpg$color[carmpg$cyl == 4] <- "blue" # 새로운 칼럼 생성 및 데이터 넣어줌
carmpg$color[carmpg$cyl == 6] <- "green"
carmpg$color[carmpg$cyl == 8] <- "red"

dotchart(carmpg$mpg, labels=row.names(carmpg),
         groups=carmpg$cyl, cex = 0.7, color = carmpg$color) # group cyl로 그룹화

dotchart(carmpg$mpg, labels=row.names(carmpg),
         groups=carmpg$cyl, cex = 0.7,
         color = carmpg$color, main = "Milage depending on numbers of cylinder") # main 제목 넣기

dotchart(carmpg$mpg, labels=row.names(carmpg),
         groups=carmpg$cyl, cex = 0.7,
         color = carmpg$color, main = "Milage depending on numbers of cylinder",
         xlab = "Miles Per Gallon", ylab = "car name") # xlab x축 제목
Result

Tomorrow
- 매일 1시간 정도 R 강의 수강 및 실습 진행
Summary
- 파이썬으로 먼저 데이터 분석을 접해서 그런지 R이 조금은 편하게 느껴진다.

