Today
강의
결과
스터디 내용
29. eigen value eigen vector, transpose
only square matrix
A <- matrix(c(3,1,0,2,1,0,-2,-2,1), nrow = 3)
A


ev <- eigen(A)$values # eigen decomposition
evec <- eigen(A)$vectors

diag(ev)

evec%*%diag(ev)%*%solve(evec) #eigen 함수 분해 , A - lambda*E


trans <- function(A){
  B <- matrix(nrow=nrow(A), ncol = ncol(A))
  for (i in 1:nrow(A)){
    for (j in 1:ncol(A)){
      B[j,i] <- A[i,j]
    }
  }
  return(B)
}

trans(A)
A

t(A) # transpose 내장 함수
symmetric matrix and eigen vectors orthogonal P%*%P_inverse = E
C <- matrix(c(3,2,-2,2,1,-2,-2,-2,1), nrow = 3)
C == trans(C)

eigen(C)
eigen(C)$vectors%*%diag(eigen(C)$values)%*%solve(eigen(C)$vectors)
30. ggplot, linear regression model 선형 모델
- Bulid Data Frame
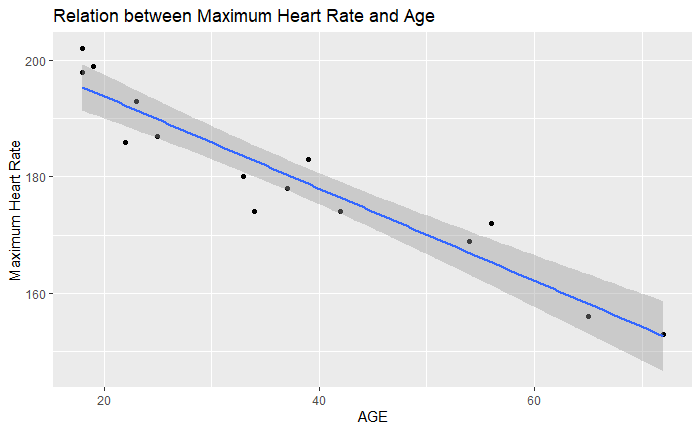
age <- c(18,22,25,33,65,54,34,56,72,19,23,42,18,39,37)
maxHR <- c(202, 186, 187, 180, 156, 169, 174, 172, 153, 199, 193, 174, 198, 183, 178)
df <- data.frame(age, maxHR)
df- Linear regression model
lm_result <- lm(maxHR ~ age, data = df) # 결과값이 ~ 앞에 쓰임
lm_result
-0.7911age + 209.6431 = maxHR
- Visualization
library(ggplot2)
ggplot(df, aes(age, maxHR)) + geom_point() + xlab("AGE") +ylab("Maximum Heart Rate") + ggtitle("Relation between Maximum Heart Rate and Age") +
  stat_smooth(method=lm, level =0.95)
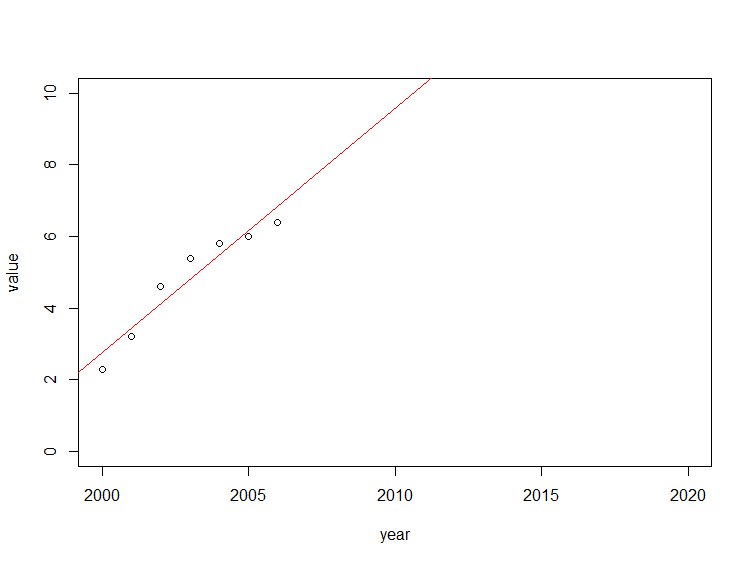
31. 선형 모델
year <- c(2000, 2001, 2002, 2003, 2004, 2005, 2006)
value <- c(2.3, 3.2, 4.6, 5.4, 5.8, 6, 6.4)
plot(year, value, xlim = c(2000, 2020), ylim = c(0,10))

fit <- lm(value ~ year)
abline(fit, col = "red")

fit$coefficients[[2]] # value = 0.92year - 1837.38

fit$residuals # 잔차값

summary(fit) # p-value : H 0 를 기각하기에 증거가 충분한가
Tomorrow
- 내일 부터 ADsP 자격증 준비 시작!
Summary
- 코딩 공부시간을 자소서에 올인해 오랜만에 스터디를 진행했다. 며칠 쉬었다고 그새 쉬운 부분을 까먹은걸 보니 역시 꾸준히 하는게 답인 것 같다. 앞으로 ADsP 시험과 병행하며 R 실습 파트를 같이 공부해야겠다.

성장