Today
강의
결과
스터디 내용
adsp day1
1. data scientist, analyst
data scientist, analyst <- user of c(R, Python, spark(scala, R, Python), hadoop)
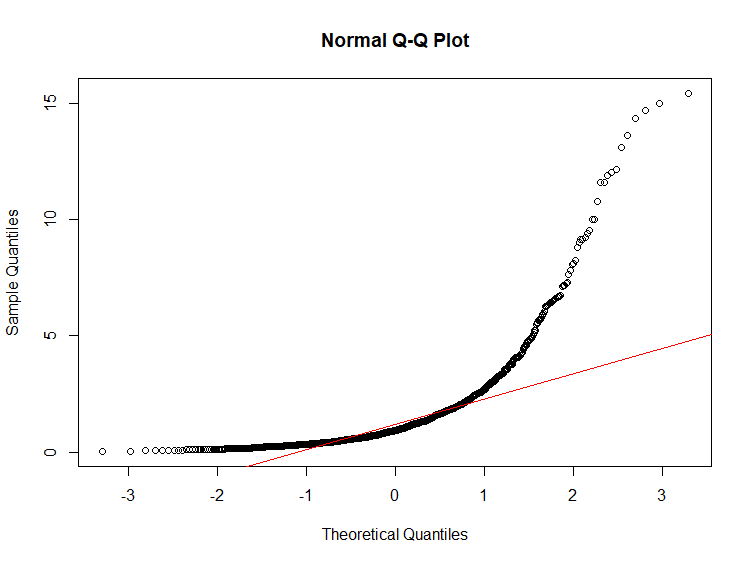
2. QQplot 정규분포 검정
getwd()

light <- read.table("C:\\Users\\park\\therbook\\light.txt", header = T)
light
hist(light$speed, col = "green")
summary(light)
boxplot(light)

x <- exp(rnorm(1000))
hist(x)

qqnorm(light$speed)
qqline(light$speed, col = "red") # 빨간 선 안에 올라가야 정규분포를 따른다고 봄.

H0: normally distributed => not reject

shapiro.test(light$speed) # normality test p-value > 0.05 따라서 H0 기각 힘듦

qqnorm(x)
qqline(x, col = "red")

H0: normally distributed => reject

shapiro.test(x)

H0 : speed of light 299 990 km/s => reject

wilcox.test(light$speed,mu=990)

H0 : speed of light 299 909 km/s => not reject

wilcox.test(light$speed,mu=909)
Tomorrow
- adsp 2일치, R 강의 실습
Summary
- keep going!

성장