.gif)
사용한 라이브러리
https://pub.dev/packages/fl_chart
- (공식문서) 라이브러리 차트 유형
https://github.com/imaNNeoFighT/fl_chart/blob/master/repo_files/documentations/index.md- (공식문서) 라인차트 설명
https://github.com/imaNNeoFighT/fl_chart/blob/master/repo_files/documentations/line_chart.md- (공식문서) 샘플2 라인차트 예제 코드
https://github.com/imaNNeoFighT/fl_chart/blob/master/example/lib/line_chart/samples/line_chart_sample2.dart
add package
dependencies:
	fl_chart: ^0.10.0
config
gridData: FlGridData Config
FlGridData위젯의showproperties
LineChartData(
gridData: FlGridData(
show: true,
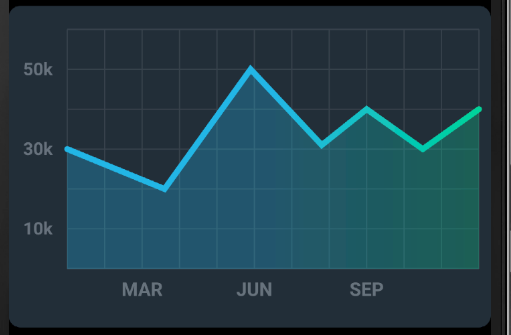
drawVerticalLine: true,true :
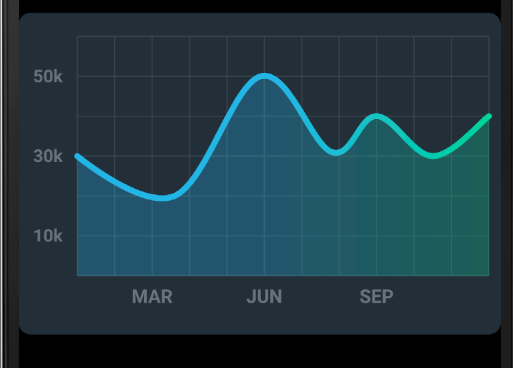
true (+drawVerticalLine: false) :
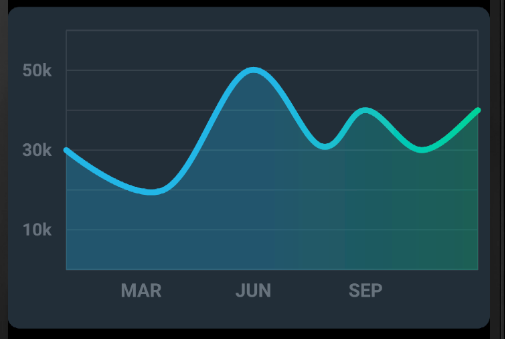
false:
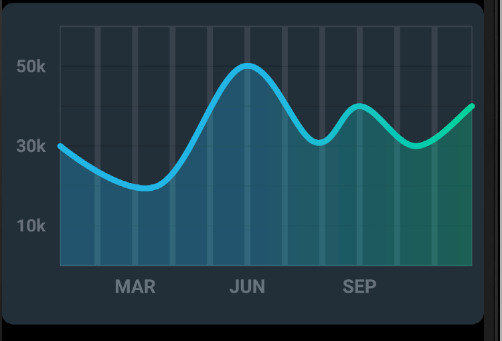
FlLineWidget의 color와 선두께(strokeWidth) 조정 가능
full Code
LineChartData(
      gridData: FlGridData(
        ...
        getDrawingHorizontalLine: (value) {
          return FlLine(
            color: Colors.black12,
            strokeWidth: 1,
          );
        },
        getDrawingVerticalLine: (value) {
          return FlLine(
            color: Color(0xff37434d),
            strokeWidth: 5,
          );
        },
      ),
titlesData: FlTitlesData Config
FlGridData위젯의showproperties
LineChartData(
      titlesData: FlTitlesData(
        show: true,
        ...
true :
false :
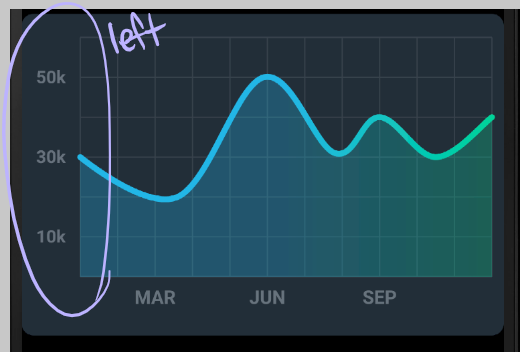
- Chart의 위치(left, top, right, bottom)에 따라
leftTitles속성의SideTitles위젯을 이용해 구현
full Code
leftTitles: SideTitles(
          showTitles: true,
          textStyle: const TextStyle(
            color: Color(0xff67727d),
            fontWeight: FontWeight.bold,
            fontSize: 15,
          ),
          // getTitles: 관련 축에서 주어진 값으로 제목을 검색하는 함수입니다. 큰 숫자에 대한 표시기를 표시하여 숫자 서식을 설정하려면 터치하지 마십시오.
          getTitles: (value) {
            print('leftTitles $value');
            switch (value.toInt()) {
              case 1:
                return '10k';
              case 3:
                return '30k';
              case 5:
                return '50k';
            }
            return '';
          },
          reservedSize: 28,
          margin: 12,
        ),
      ),
borderData: FlBorderData Config
FlBorderData의minX: 0, maxX: 11, minY: 0, maxY: 6,
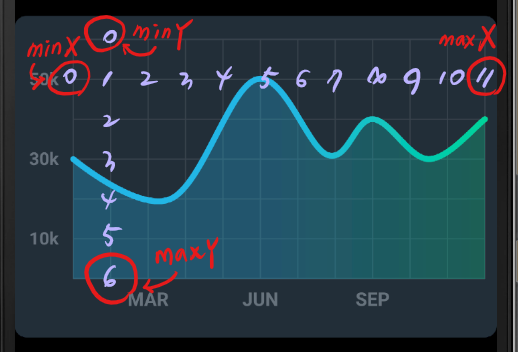
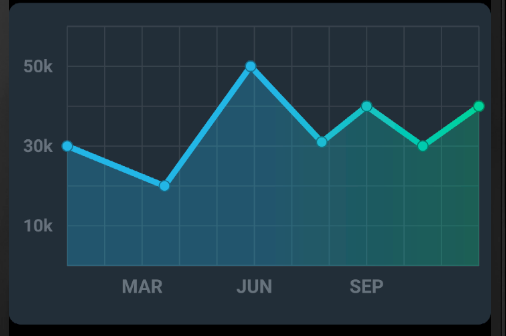
- 꼭지점 마다 출력될
FlBorderData의lineBarsData()의spots[]데이터
LineChartBarData(
  spots: [
    FlSpot(0, 3),
    FlSpot(2.6, 2),
    FlSpot(4.9, 5),
    FlSpot(6.8, 3.1),
    FlSpot(8, 4),
    FlSpot(9.5, 3),
    FlSpot(11, 4),
  ],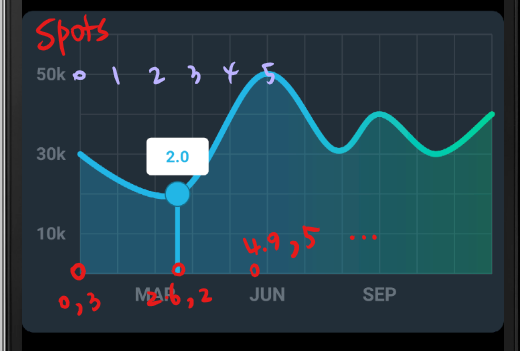
isCurved: false, colors: gradientColors, barWidth: 5,
dotData: FlDotData( show: true, ),
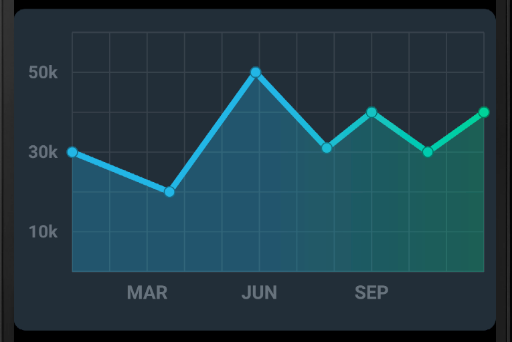
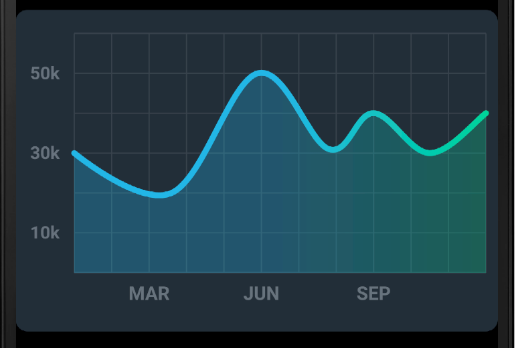
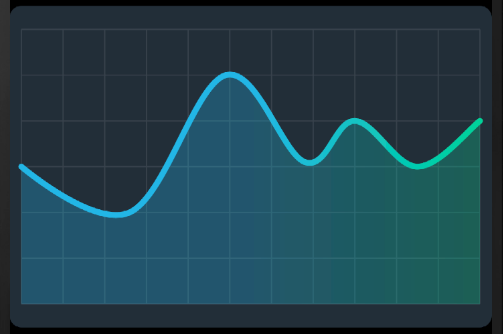
LineChartBarData > belowBarData: BarAreaData Config
belowBarData: BarAreaData( show: false, colors: gradientColors.map((color) => color.withOpacity(0.3)).toList(), ),
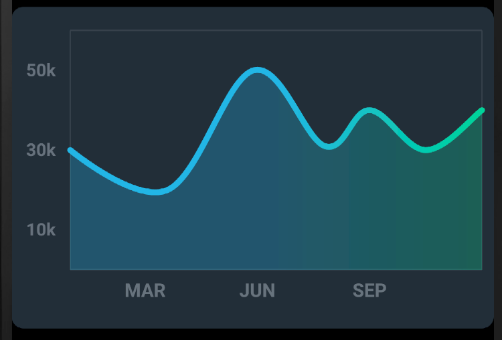
false :
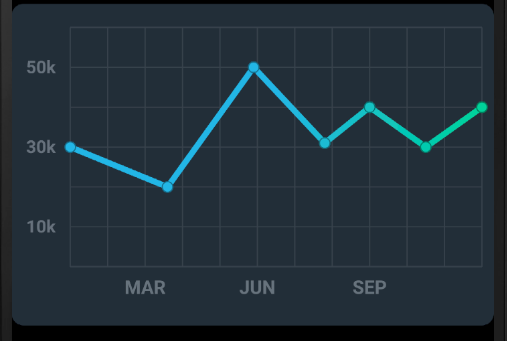
true show: true,:
full code
borderData: FlBorderData(
          show: true,
          border: Border.all(color: const Color(0xff37434d), width: 1)),
      minX: 0,
      maxX: 11,
      minY: 0,
      maxY: 6,
      lineBarsData: [
        LineChartBarData(
          spots: [
            FlSpot(0, 3),
            FlSpot(2.6, 2),
            FlSpot(4.9, 5),
            FlSpot(6.8, 3.1),
            FlSpot(8, 4),
            FlSpot(9.5, 3),
            FlSpot(11, 4),
          ],
          isCurved: true,
          colors: gradientColors,
          barWidth: 5,
          isStrokeCapRound: true,
          dotData: FlDotData(
            show: false,
          ),
          belowBarData: BarAreaData(
            show: true,
            colors:
                gradientColors.map((color) => color.withOpacity(0.3)).toList(),
          ),
        ),
      ],
    );
full Code
.gif)
import 'package:fl_chart/fl_chart.dart';
import 'package:flutter/material.dart';
class FlChartPage extends StatefulWidget {
_FlChartPageState createState() => _FlChartPageState();
}
class _FlChartPageState extends State<FlChartPage> {
List<Color> gradientColors = [
const Color(0xff23b6e6),
const Color(0xff02d39a),
];
bool showAvg = false;
Widget build(BuildContext context) {
return SafeArea(
child: Column(
children: <Widget>[
FlatButton(
child: Text(
showAvg ? '평균값 O' : '평균값 X',
style: TextStyle(
color:
showAvg ? Colors.white.withOpacity(0.5) : Colors.white),
),
onPressed: () {
print('click');
setState(() {
showAvg = !showAvg;
});
},
),
AspectRatio(
aspectRatio: 3 / 2,
child: Container(
decoration: BoxDecoration(
borderRadius: BorderRadius.all(
Radius.circular(10),
),
color: Color(0xff232d37)),
child: Padding(
padding: EdgeInsets.symmetric(vertical: 20, horizontal: 10),
child: LineChart(
showAvg ? avgChart() : mainChart(),
),
),
),
),
],
),
);
}
LineChartData mainChart() {
return LineChartData(
gridData: FlGridData(
show: true,
drawVerticalLine: true,
getDrawingHorizontalLine: (value) {
return FlLine(
color: Color(0xff37434d),
strokeWidth: 1,
);
},
getDrawingVerticalLine: (value) {
return FlLine(
color: Color(0xff37434d),
strokeWidth: 1,
);
},
),
titlesData: FlTitlesData(
show: true,
bottomTitles: SideTitles(
showTitles: true,
reservedSize: 22,
textStyle: const TextStyle(
color: Color(0xff68737d),
fontWeight: FontWeight.bold,
fontSize: 16),
getTitles: (value) {
print('bottomTitles $value');
switch (value.toInt()) {
case 2:
return 'MAR';
case 5:
return 'JUN';
case 8:
return 'SEP';
}
return '';
},
margin: 8,
),
leftTitles: SideTitles(
showTitles: true,
textStyle: const TextStyle(
color: Color(0xff67727d),
fontWeight: FontWeight.bold,
fontSize: 15,
),
getTitles: (value) {
print('leftTitles $value');
switch (value.toInt()) {
case 1:
return '10k';
case 3:
return '30k';
case 5:
return '50k';
}
return '';
},
reservedSize: 28,
margin: 12,
),
),
borderData: FlBorderData(
show: true,
border: Border.all(color: const Color(0xff37434d), width: 1)),
minX: 0,
maxX: 11,
minY: 0,
maxY: 6,
lineBarsData: [
LineChartBarData(
spots: [
FlSpot(0, 3),
FlSpot(2.6, 2),
FlSpot(4.9, 5),
FlSpot(6.8, 3.1),
FlSpot(8, 4),
FlSpot(9.5, 3),
FlSpot(11, 4),
],
isCurved: true,
colors: gradientColors,
barWidth: 5,
isStrokeCapRound: true,
dotData: FlDotData(
show: true,
),
belowBarData: BarAreaData(
show: true,
colors:
gradientColors.map((color) => color.withOpacity(0.3)).toList(),
),
),
],
);
}
LineChartData avgChart() {
return LineChartData(
lineTouchData: LineTouchData(enabled: false),
gridData: FlGridData(
show: true,
drawHorizontalLine: true,
getDrawingVerticalLine: (value) {
return FlLine(
color: const Color(0xff37434d),
strokeWidth: 1,
);
},
getDrawingHorizontalLine: (value) {
return FlLine(
color: const Color(0xff37434d),
strokeWidth: 1,
);
},
),
titlesData: FlTitlesData(
show: true,
bottomTitles: SideTitles(
showTitles: true,
reservedSize: 22,
textStyle: const TextStyle(
color: Color(0xff68737d),
fontWeight: FontWeight.bold,
fontSize: 16),
getTitles: (value) {
switch (value.toInt()) {
case 2:
return 'MAR';
case 5:
return 'JUN';
case 8:
return 'SEP';
}
return '';
},
margin: 8,
),
leftTitles: SideTitles(
showTitles: true,
textStyle: const TextStyle(
color: Color(0xff67727d),
fontWeight: FontWeight.bold,
fontSize: 15,
),
getTitles: (value) {
switch (value.toInt()) {
case 1:
return '10k';
case 3:
return '30k';
case 5:
return '50k';
}
return '';
},
reservedSize: 28,
margin: 12,
),
),
borderData: FlBorderData(
show: true,
border: Border.all(color: const Color(0xff37434d), width: 1)),
minX: 0,
maxX: 11,
minY: 0,
maxY: 6,
lineBarsData: [
LineChartBarData(
spots: [
FlSpot(0, 3.44),
FlSpot(2.6, 3.44),
FlSpot(4.9, 3.44),
FlSpot(6.8, 3.44),
FlSpot(8, 3.44),
FlSpot(9.5, 3.44),
FlSpot(11, 3.44),
],
isCurved: true,
colors: [
ColorTween(begin: gradientColors[0], end: gradientColors[1])
.lerp(0.2),
ColorTween(begin: gradientColors[0], end: gradientColors[1])
.lerp(0.2),
],
barWidth: 5,
isStrokeCapRound: true,
dotData: FlDotData(
show: false,
),
belowBarData: BarAreaData(show: true, colors: [
ColorTween(begin: gradientColors[0], end: gradientColors[1])
.lerp(0.2)
.withOpacity(0.1),
ColorTween(begin: gradientColors[0], end: gradientColors[1])
.lerp(0.2)
.withOpacity(0.1),
]),
),
],
);
}
}
𝙸 𝚊𝚖 𝚊 𝚌𝚞𝚛𝚒𝚘𝚞𝚜 𝚍𝚎𝚟𝚎𝚕𝚘𝚙𝚎𝚛 𝚠𝚑𝚘 𝚎𝚗𝚓𝚘𝚢𝚜 𝚍𝚎𝚏𝚒𝚗𝚒𝚗𝚐 𝚊 𝚙𝚛𝚘𝚋𝚕𝚎𝚖. 🇰🇷👩🏻💻