ROC와 AUC 개념 정리
1. ROC (Receiver Operating Characteristic Curve)
ROC는 이진 분류 문제에서 모델의 성능을 평가하기 위해 사용하는 그래프입니다.
이 그래프는 분류기의 민감도(Recall)와 특이도(Specificity)의 관계를 보여줍니다.
- x축: 1 - 특이도 (False Positive Rate, FPR)
- FPR =
- 잘못된 정답으로 분류된 비율
- y축: 민감도 (True Positive Rate, TPR 또는 Recall)
- TPR =
- 올바르게 정답으로 분류된 비율
ROC 곡선은 모델이 분류 기준(Threshold)을 바꾸면서 FPR과 TPR이 어떻게 변하는지를 나타냅니다.
2. AUC (Area Under the Curve)
AUC는 ROC 곡선 아래의 면적을 의미합니다.
- AUC 값은 모델의 분류 성능을 숫자로 요약합니다.
- 값의 범위는 [0, 1]이며, 1에 가까울수록 성능이 좋습니다.
- 0.5: 무작위 추측과 동일한 성능 (즉, 분류가 의미 없음)
- 1: 완벽한 분류기
- 0: 최악의 성능 (결과가 완전히 반대로 분류됨)
ROC와 AUC의 중요성
-
모델 성능 비교
- ROC 곡선이 왼쪽 위로 치우칠수록 성능이 좋은 모델입니다.
- AUC 값으로 모델 간 성능을 쉽게 비교할 수 있습니다.
-
Threshold 선택
- ROC 곡선을 활용하면 분류 임계값을 조정하여 적절한 TPR과 FPR의 균형을 맞출 수 있습니다.
-
불균형 데이터
- AUC는 데이터의 클래스 불균형이 심할 때도 모델의 성능을 비교하는 데 유용합니다.
ROC와 AUC의 활용 예제
- 이진 분류 모델(예: 암 진단, 스팸 필터링)
- 모델 성능 평가 및 비교
예: 모델 A의 AUC가 0.9이고, 모델 B의 AUC가 0.8이면, 모델 A가 B보다 성능이 좋음.
import matplotlib.pyplot as plt
from sklearn.metrics import roc_curve, auc
from sklearn.datasets import make_classification
from sklearn.linear_model import LogisticRegression
# 데이터 생성 및 모델 학습
X, y = make_classification(n_samples=1000, n_features=20, random_state=42)
model = LogisticRegression()
model.fit(X, y)
y_score = model.predict_proba(X)[:, 1]
# ROC 곡선 및 AUC 계산
fpr, tpr, _ = roc_curve(y, y_score)
roc_auc = auc(fpr, tpr)
# 그래프 그리기
plt.figure(figsize=(8, 6))
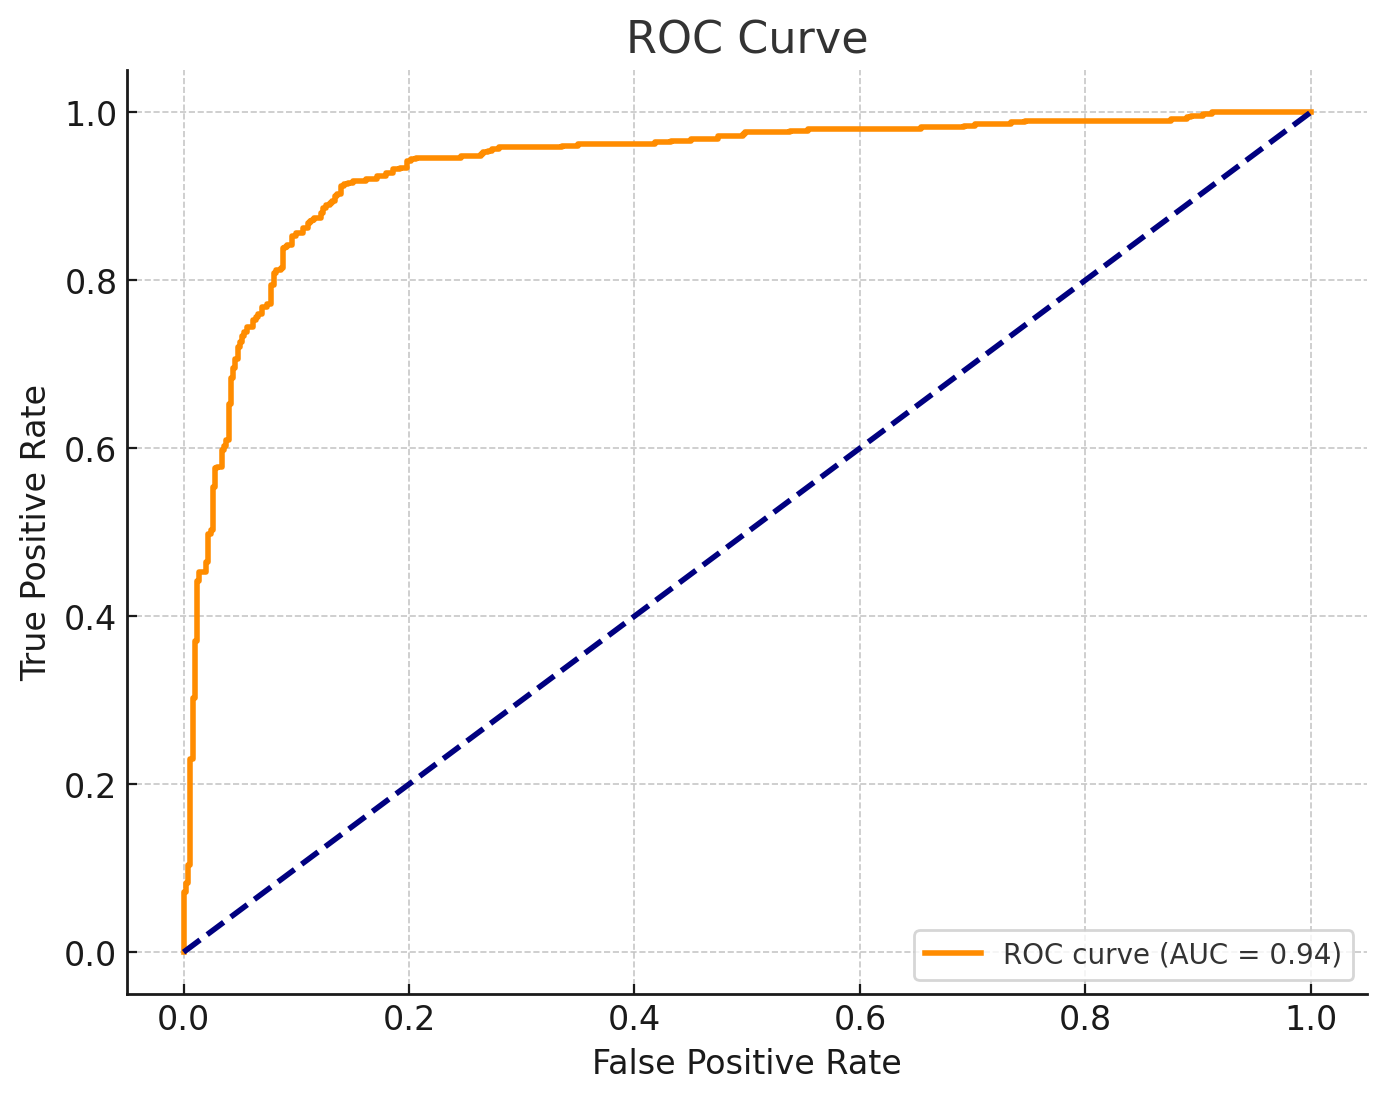
plt.plot(fpr, tpr, label=f"ROC curve (AUC = {roc_auc:.2f})", color='darkorange', lw=2)
plt.plot([0, 1], [0, 1], color='navy', lw=2, linestyle='--')
plt.xlabel("False Positive Rate")
plt.ylabel("True Positive Rate")
plt.title("ROC Curve")
plt.legend(loc="lower right")
# 저장 및 출력
output_path = "/mnt/data/roc_curve_example.png"
plt.savefig(output_path)
plt.show()
output_path
니가 해

열심히 사는 척