[28일차]DataFrame활용 - 결측치 필터와 처리(isin, isnull, isna, notnull)
데브코스_데이터분석- Python Pandas 활용하기[6주차]
목록 보기
48/91
이번에는 결측치를 이용해서 마스크를 만들어보자.
실습 환경 구축
# 참조
import pandas as pd

# 데이터프레임 생성
cols = ['name', 'survived', 'pclass', 'fare', 'sex', 'age']
titanic = pd.read_excel('titanic3.xls', usecols=cols, index_col='name')
titanic
**상류층 | 중산층 모두 찾을 조건문(마스크)를 만들 때**
• 기존에 배운 방식으로 한다면
plcass_1_mask = titanic['pclass'] == 1
plcass_2_mask = titanic['pclass'] == 2

titanic[plcass_1_mask | plcass_2_mask]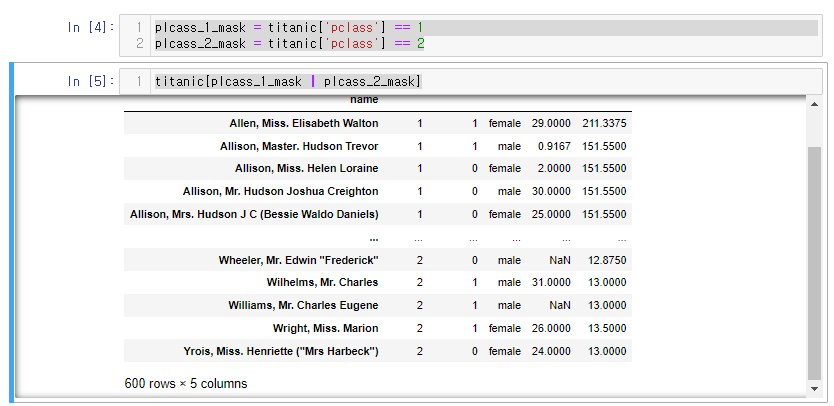
**.isin()으로 동일코드를 구현해보면
- **
Series.isin(values)**- 파이썬의 in과 비슷한 개념
- •
1 in [1, 2]2 in [1, 2]모두 True가 나옴
- •
.isin메소드를 사용하여 각 요소가 특정 값들에 속하는지 여부를 확인할 수 있다.- Series의 각 요소가 주어진 값(values)에 포함되는지 여부를 나타내는 불리언 Series를 반환
- values는 집합(set)이나 리스트 형태의 값들로 이루어진 시퀀스
- values에 단일 문자열을 전달할 경우 TypeError가 발생
- 단일 문자열을 하나의 요소로 갖는 리스트로 변환해야함.
- 파이썬의 in과 비슷한 개념
코드
titanic['pclass'].isin([1,2])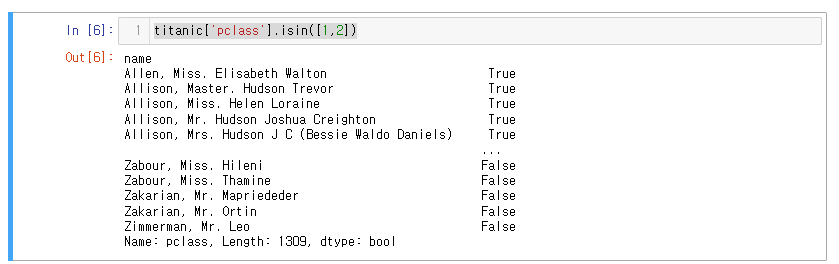
pclass 컬럼 중 1또는 2를 구한다.
.****isnull()****
- null요소가 있는지 확인하는 메서드
- NA를 발견하면 True로 반환한다.
titanic에서 Null 데이터를 확인해 보자.
- age열 isnull()
# age열 isnull()
titanic['age'].isnull()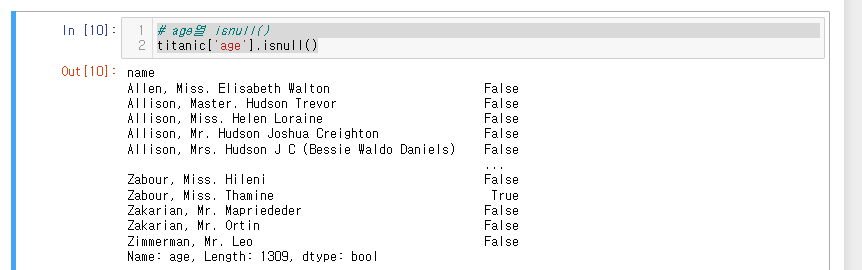
sum() 메서드를 이용해 age에 결측값이 몇개인지 확인해볼 수 있다.
**.notnull()**
-
• isnull과 반대로 NA가 아닌 걸 발견하면 True로 반환
-
age열에서 결측치가 아닌것
titanic['age'].notnull()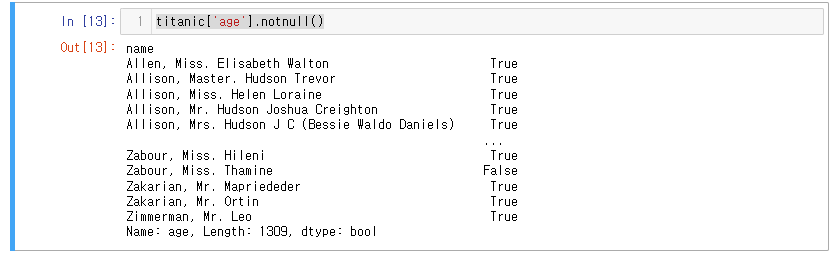
마무리 : isnull(), notnull()을 이용한 마스크 생성.
나이가 식별되지 않은 사람과 식별된 사람을 찾아보자.
결측치가 있으면 식별이 안된것이니 마스크로 만들어줌.
unknown_age_mask = titanic['age'].isna()
known_age_mask = titanic['age'].notnull()
식별되지 않은사람
# 나이가 식별되지 않은 사람 확인
titanic[unknown_age_mask]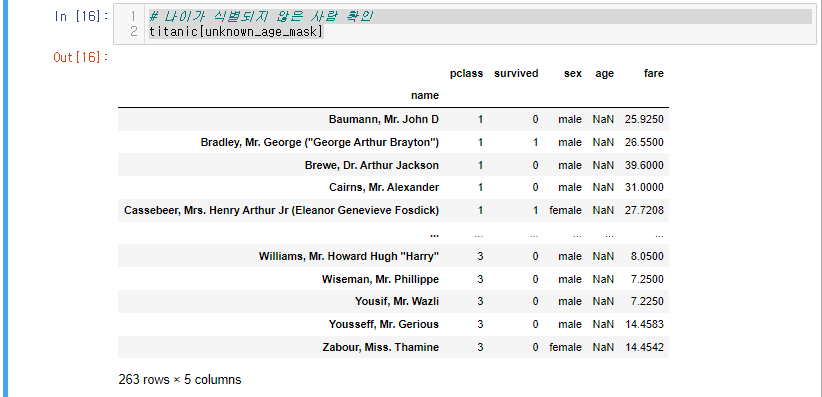
식별된 사람
# 나이가 식별된 사람 확인
titanic[known_age_mask]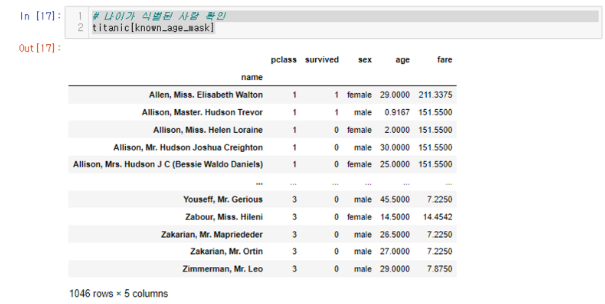

LV. 1