**DataFrame심화 - 여러 집계함수 동시 적용(agg)**
이전에 통계를 확인할 떄에는 describe()메소드를 사용했었다.
이번 글에서는 .agg() 메소드를 이용해 데이터를 집계해보자.
실습 환경 세팅
import pandas as pd

customers = pd.read_csv('marketing_campaign.csv', sep='\t', index_col='ID')
customers
.agg()
지정된 축(axis)을 기준으로 하나 이상의 연산을 사용하여 데이터를 집계(aggregate) 하는 기능을 제공
.agg parameter(인자값)
func: function, str, list or dict- 데이터를 집계하는 데 사용할 함수를 지정.
- 함수로는 DataFrame을 인자로 받을 수 있는 함수나 DataFrame의 apply() 메소드에 사용할 수 있는 함수여야 한다.
- 즉 return 값을 반환할 수 있는 함수만 넣을 수 있다.
- 허용 가능한 조합
- 함수
- 함수 이름의 문자열
- 함수나 함수 이름이 포함된 리스트
- 축 레이블과 함수 또는 함수 이름이 포함된 딕셔너리 형태의 조합
axis: {0 or ‘index}- 데이터를 집계할 축을 지정.
- 0 또는 'index'인 경우 각 열(column)을 기준으로 함수를 적용.
- 1 또는 'columns'인 경우 각 행(row)을 기준으로 함수를 적용.
실습 - dict 형태
Income 컬럼의 max값, Kidhome 컬럼의mean값 확인.
customers.agg({'Income' : 'max', 'Kidhome':'mean'})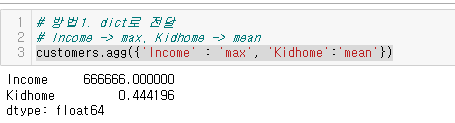
Income -> [min, max, std], Kidhome -> ['min', 'max', 'mean']
리스트화 해서 여러 데이터를 구할 수 도 있다.
# Income -> [min, max, std], Kidhome -> ['min', 'max', 'mean']
customers.agg({'Income' : ['max','min','std'], 'Kidhome':['mean','min','max']})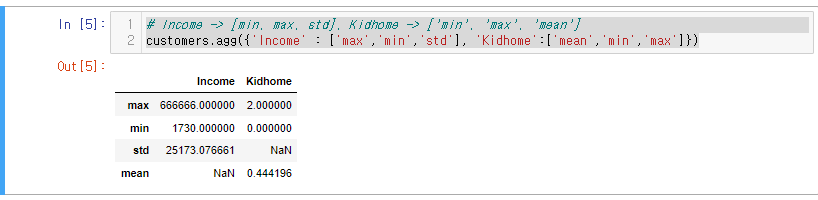
이런식으로도 확인 가능하다. (.apply() 메소드도 해당 모습으로 사용 가능 )
customers[['Income','Kidhome']].agg(['max','min','std'])실습 2 - 리스트 형태
customers.agg(['max','min'])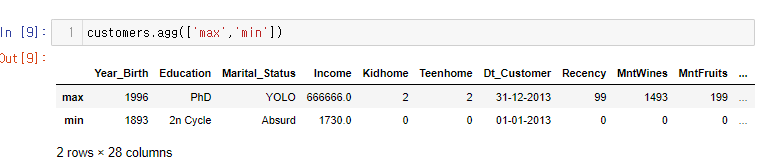
모든 컬럼에 최대, 최소 값이 나온다.
실습 2 - 오류 발생
customers.agg(['mean'])해당 코드를 실행하면 아래와 같은 오류가 발생한다.
오류 메시지
FutureWarning: ['Education', 'Marital_Status', 'Dt_Customer'] did not aggregate successfully. If any error is raised this will raise in a future version of pandas. Drop these columns/ops to avoid this warning.
  customers.agg(['mean'])
- customers 데이터프레임의
['Education', 'Marital_Status', 'Dt_Customer']열에 숫자형이 아닌 데이터가 포함되어 있기 때문에 에러가 발생.- 이를 방지하기 위해 이러한 열을 집계 연산에서 제외하거나, 원본에서 해당 열을 삭제.
대처 1 : drop() agg() 체인형으로 해결
['Education', 'Marital_Status', 'Dt_Customer'] 해당 컬럼을 제거 후 .agg를 실행한다.
customers.drop(columns=['Education', 'Marital_Status', 'Dt_Customer']).agg(['mean'])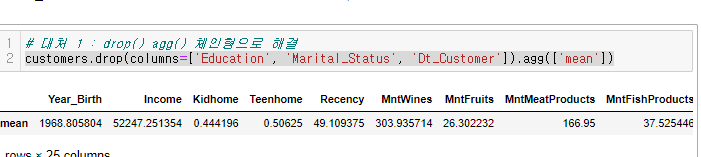
대처 2 : 새로운 df를 만들어 해결
숫자형 컬럼만 가져오는 df를 만들어서 실행하자.
.select_dtypes()메소드 사용- 컬럼의 타입을 찾아서 추출할 때 사용.
# 대처 2 : 새로운 df를 만들어 해결
customers_numeric = customers.select_dtypes(include='number')
customers_numeric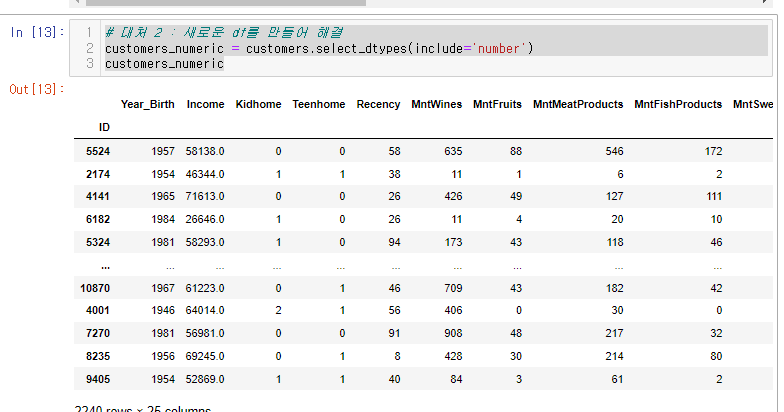
숫자를 사용하는 컬럼만 가져와진 것을 볼 수 있다.
여기에 .agg(['mean']) 사용
customers_numeric.agg(['mean'])**주의 : agg()는 numeric_only=True가 안된다**
간혹 숫자형 데이터만 집계하기위해 agg()에 숫자만 적용하는 인자 numeric_only=True쓰는 경우가 있는데 무의미한 코드이다. 왜냐? agg()에서는 이 인자를 지원하지 않기 때문!
생각보다 쉽게 보이는 코드 실수.

LV. 1