
04. Self Oil station Price Analysis
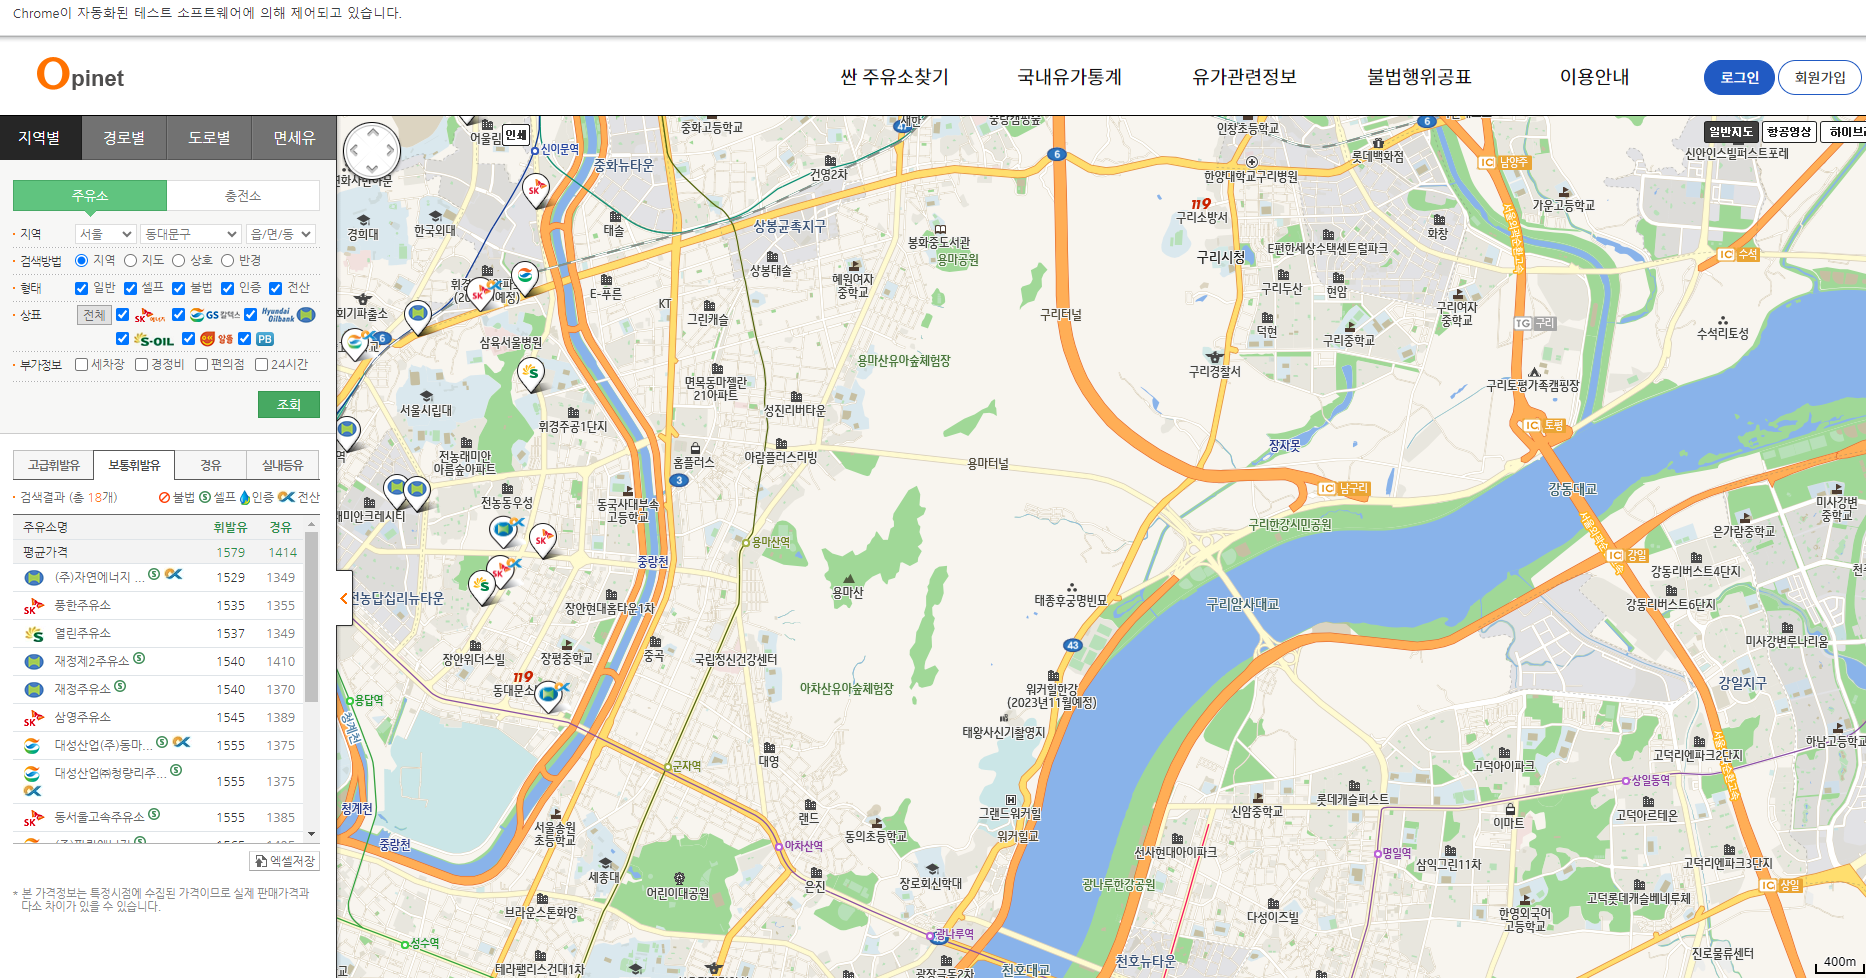
셀프 주유소가 정말 저렴한가? - 데이터 확보하기 위한 작업
사이트에서 지역 검색기능을 상요하기 위해 선택가능한 지역정보 크롤링
서울만을 기준으로 서울은 고정하고 구별 검샘을 통해 구별 셀프 주유소 정보 가져와 엑셀 저장 버튼을 클릭하여 데이터 저장 - 반복문 사용
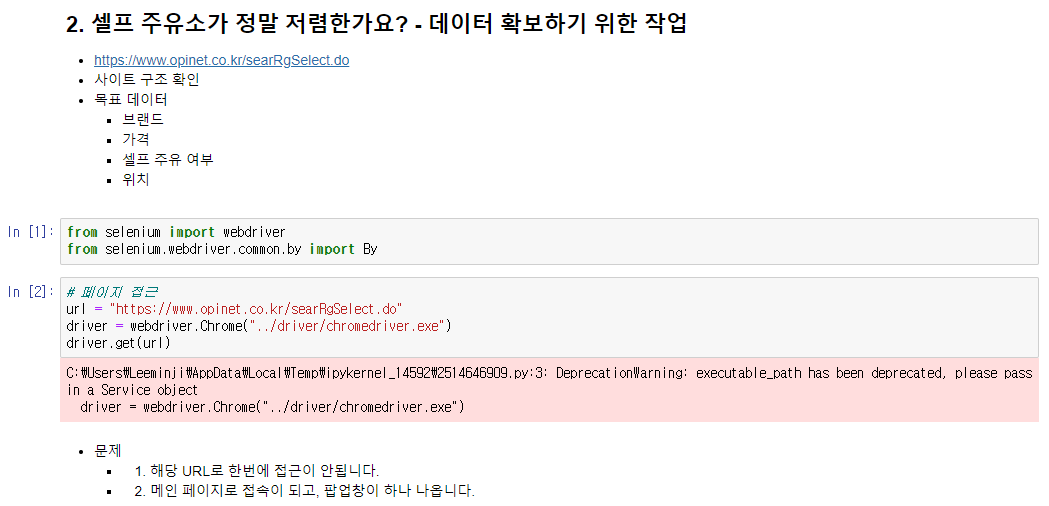
from selenium import webdriver
from selenium.webdriver.common.by import By
# 페이지 접근
url = "https://www.opinet.co.kr/searRgSelect.do"
driver = webdriver.Chrome("../driver/chromedriver.exe")
driver.get(url)
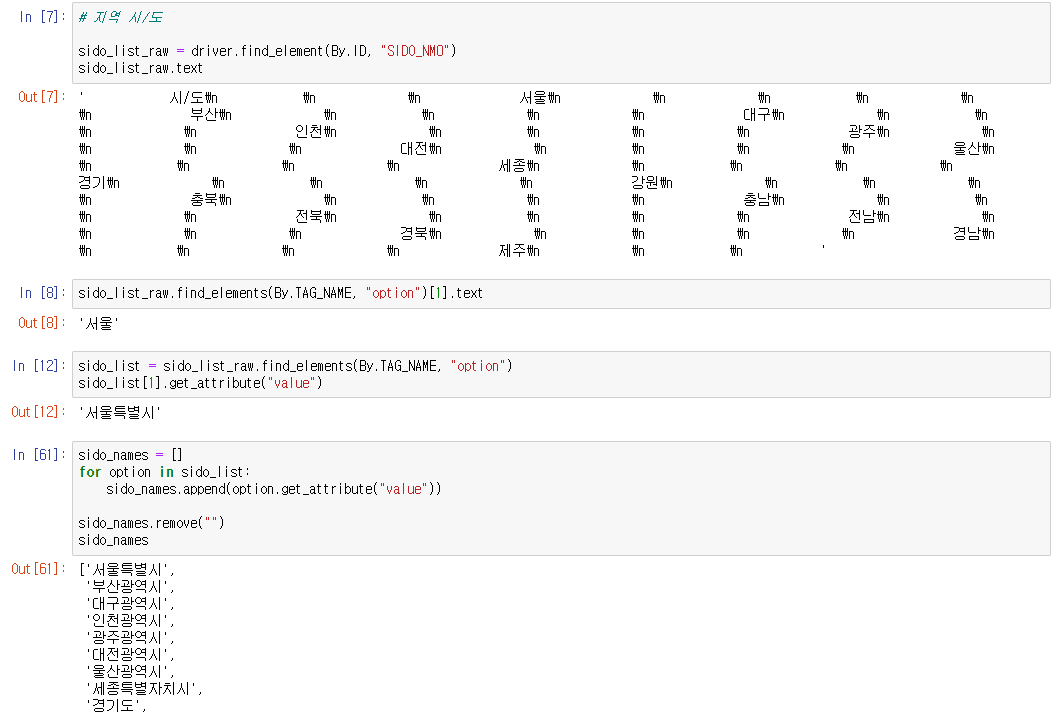
# 지역 시/도
sido_list_raw = driver.find_element(By.ID, "SIDO_NM0")
sido_list_raw.text
sido_name = [option.get_attribute("value") for option in sido_list]
sido_name
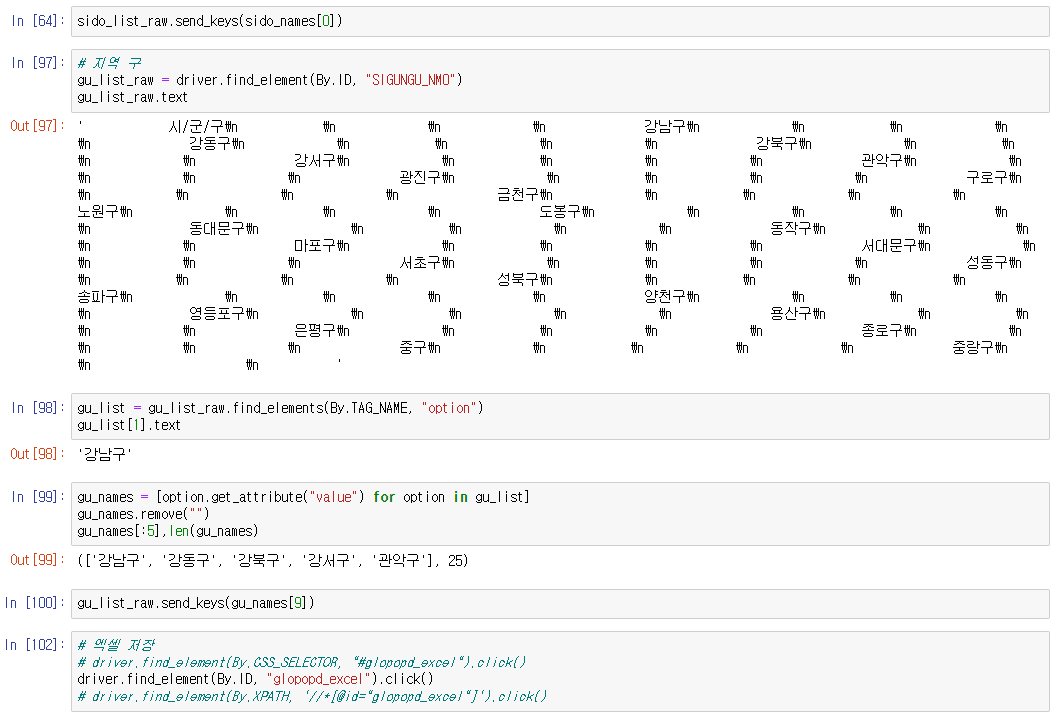
# 지역 구
gu_list_raw = driver.find_element(By.ID, "SIGUNGU_NM0")
gu_list_raw.text
gu_list = gu_list_raw.find_elements(By.TAG_NAME, "option")
gu_names = [option.get_attribute("value") for option in gu_list]
gu_names.remove("")
# 엑셀 저장
# driver.find_element(By.CSS_SELECTOR, "#glopopd_excel").click()
driver.find_element(By.ID, "glopopd_excel").click()
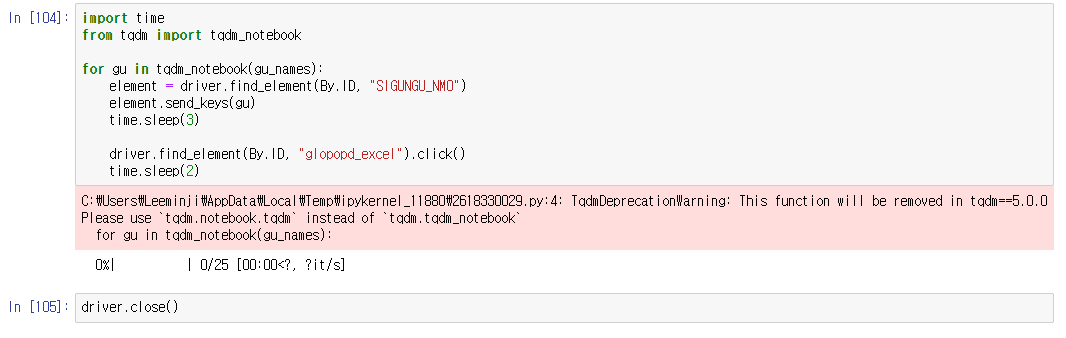
import time
from tqdm import tqdm_notebook
for gu in tqdm_notebook(gu_names):
element = driver.find_element(By.ID, "SIGUNGU_NM0")
element.send_keys(gu)
time.sleep(3)
driver.find_element(By.ID, "glopopd_excel").click()
time.sleep(2)
driver.close() 데이터 정리하기
다운로드 된 파일들을 concat으로 병합하고 데이터를 사용하기 편하게 정리(데이터가 없는 행은 삭제, 시각화를 위해 가격데이터 float형으로 변환)
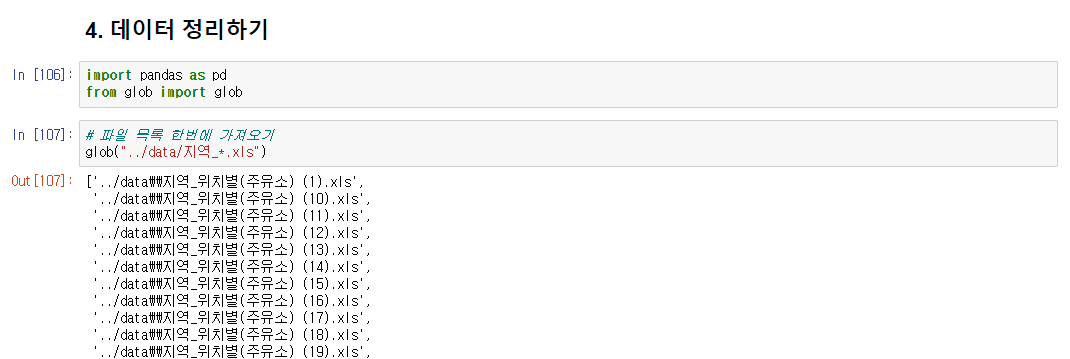
import pandas as pd
from glob import glob
# 파일 목록 한번에 가져오기
glob("../data/지역_*.xls")
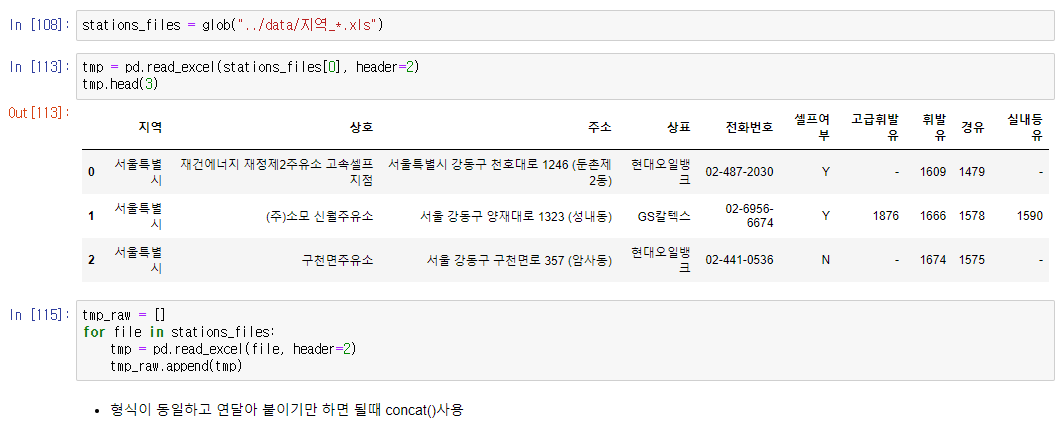
stations_files = glob("../data/지역_*.xls")
tmp = pd.read_excel(stations_files[0], header=2)
tmp_raw = []
for file in stations_files:
tmp = pd.read_excel(file, header=2)
tmp_raw.append(tmp)
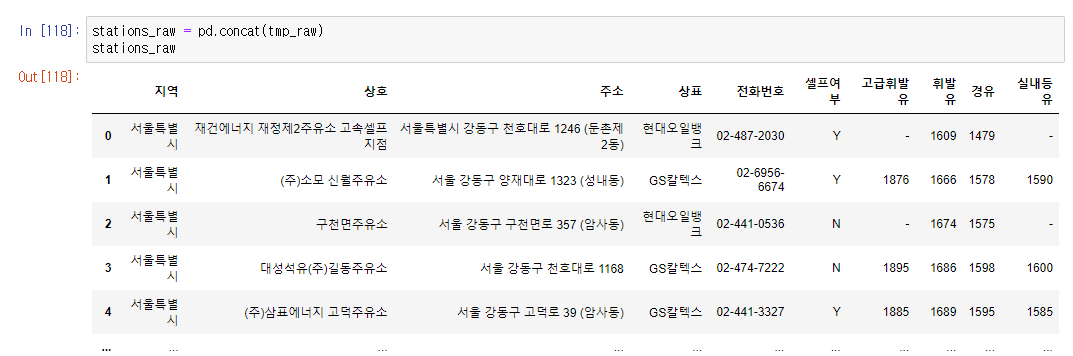
stations_raw = pd.concat(tmp_raw)
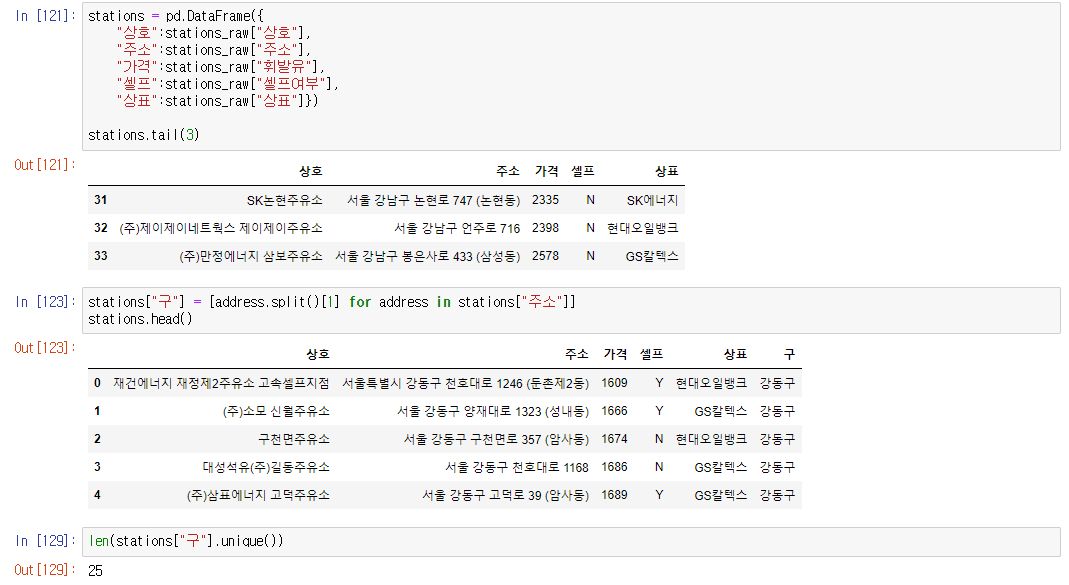
stations = pd.DataFrame({
"상호":stations_raw["상호"],
"주소":stations_raw["주소"],
"가격":stations_raw["휘발유"],
"셀프":stations_raw["셀프여부"],
"상표":stations_raw["상표"]})
# 가격 정보 없는 주유소
stations[stations["가격"]== "-"]
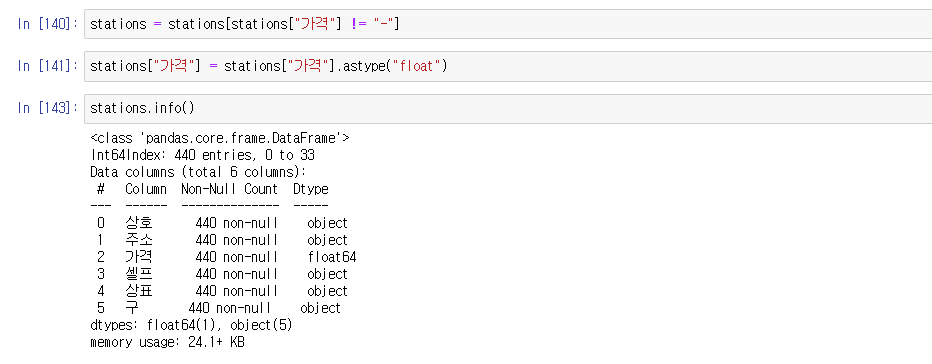
stations = stations[stations["가격"] != "-"]
stations["가격"] = stations["가격"].astype("float")
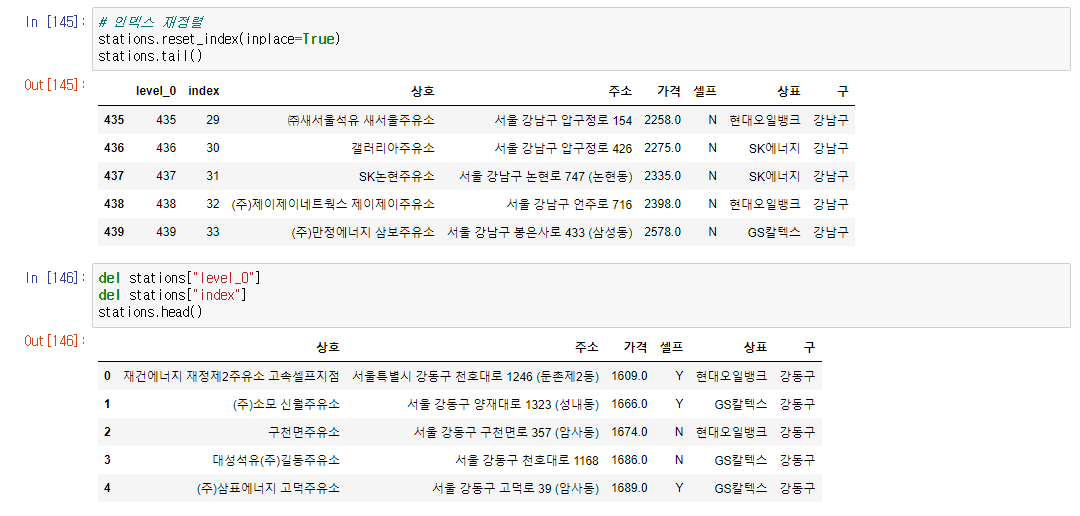
# 인덱스 재정렬
stations.reset_index(inplace=True)
stations.tail()
del stations["level_0"]
del stations["index"]
stations.head()주유가격 정보 시각화
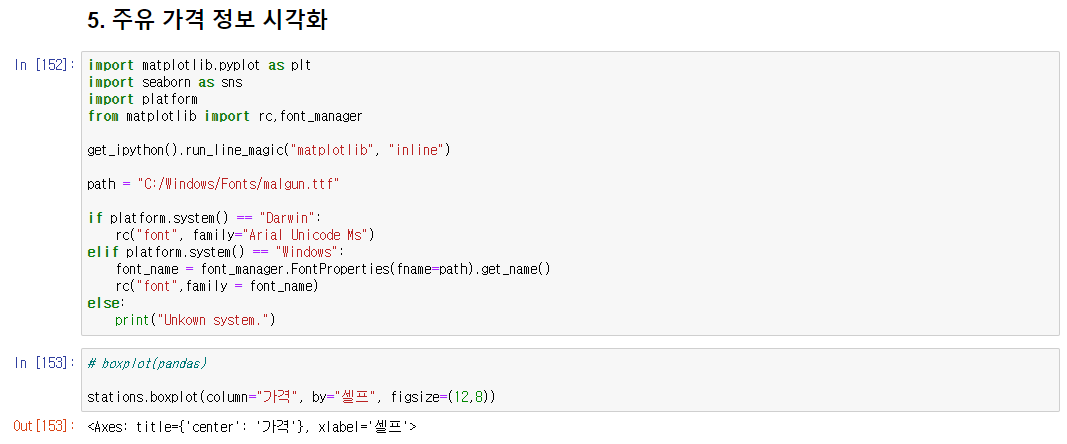
import matplotlib.pyplot as plt
import seaborn as sns
import platform
from matplotlib import rc,font_manager
get_ipython().run_line_magic("matplotlib", "inline")
path = "C:/Windows/Fonts/malgun.ttf"
if platform.system() == "Darwin":
rc("font", family="Arial Unicode Ms")
elif platform.system() == "Windows":
font_name = font_manager.FontProperties(fname=path).get_name()
rc("font",family = font_name)
else:
print("Unkown system.")
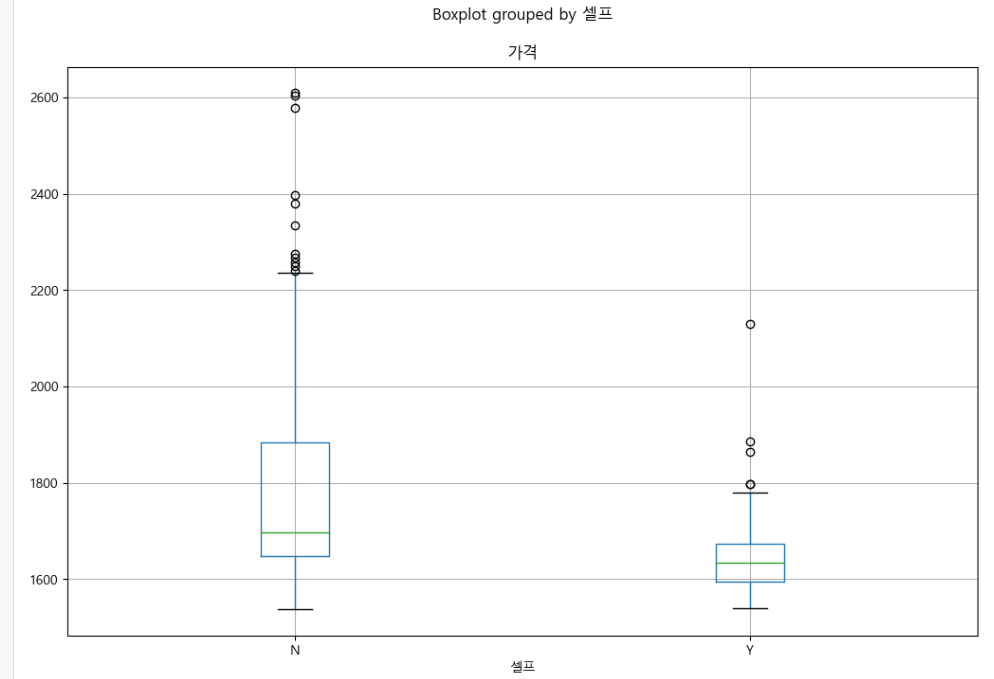
# boxplot(pandas)
stations.boxplot(column="가격", by="셀프", figsize=(12,8))
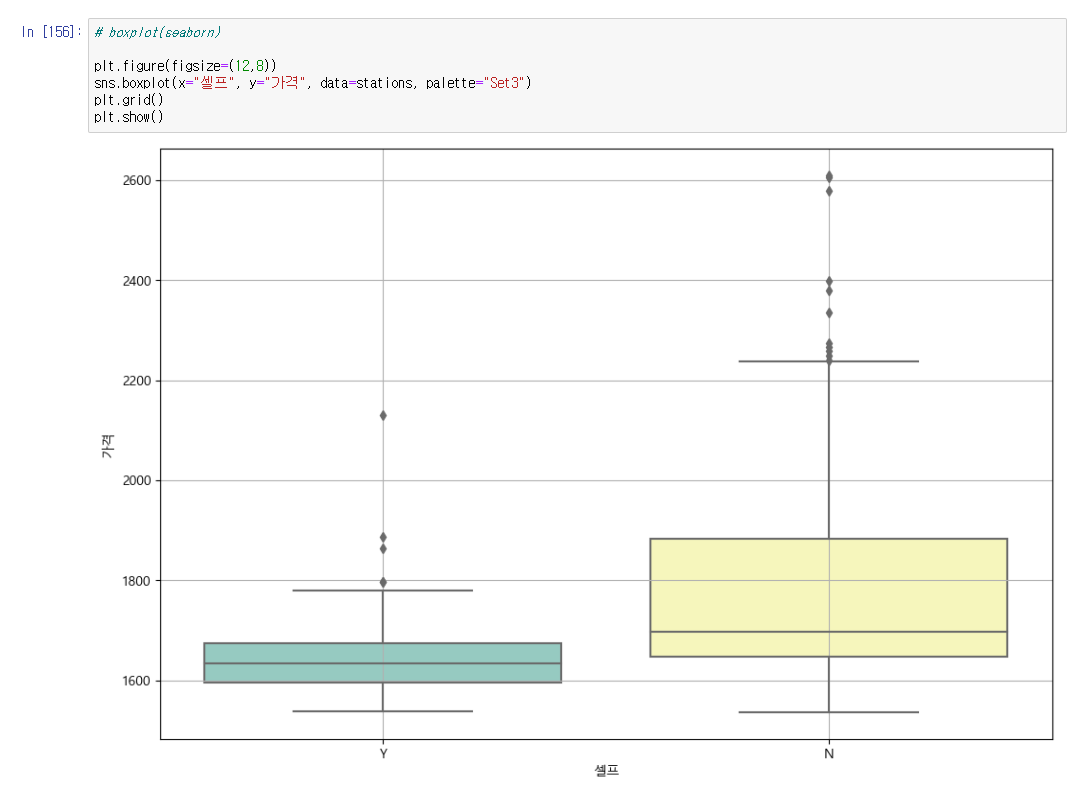
# boxplot(seaborn)
plt.figure(figsize=(12,8))
sns.boxplot(x="셀프", y="가격", data=stations, palette="Set3")
plt.grid()
plt.show()
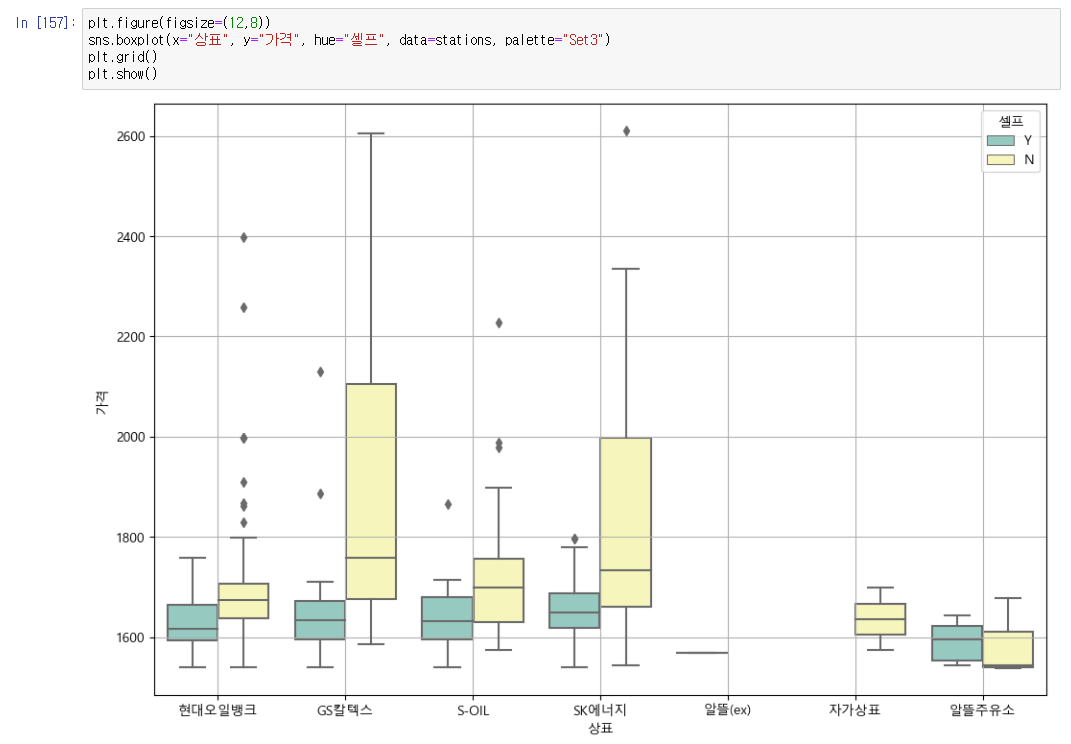
plt.figure(figsize=(12,8))
sns.boxplot(x="상표", y="가격", hue="셀프", data=stations, palette="Set3")
plt.grid()
plt.show()
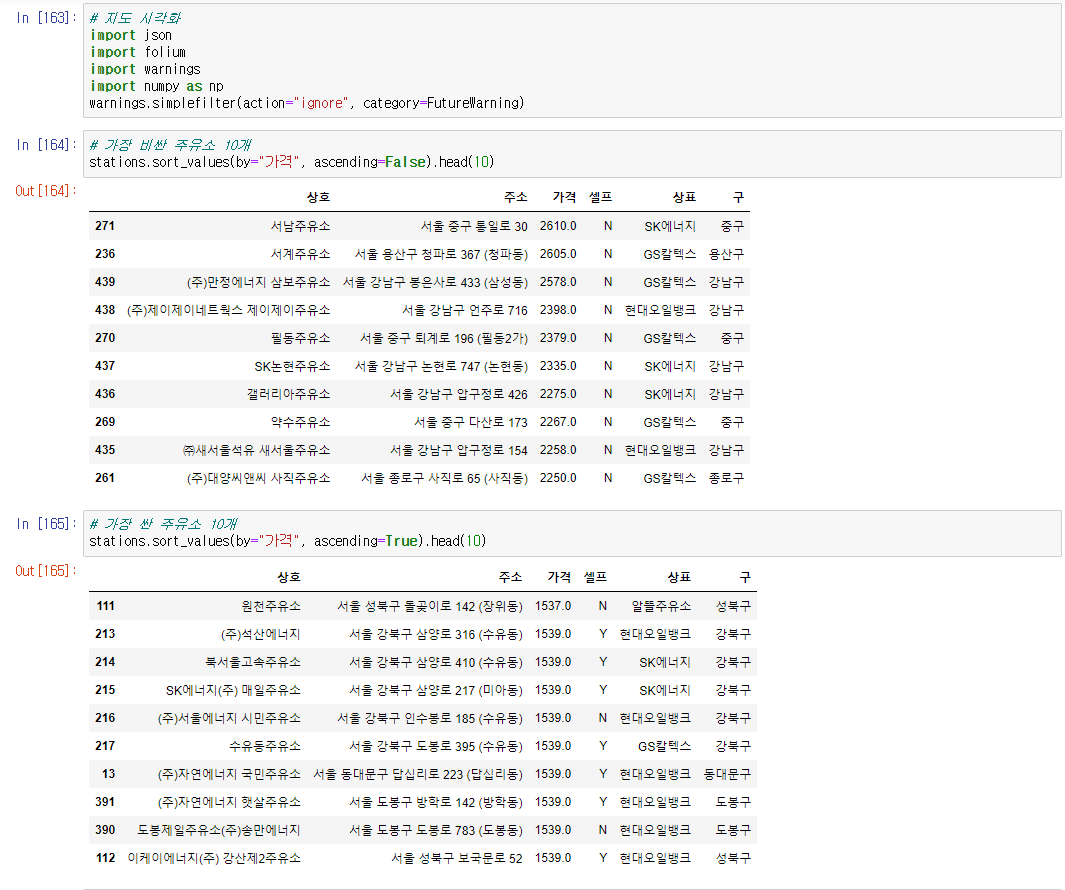
# 가장 비싼 주유소 10개
stations.sort_values(by="가격", ascending=False).head(10)
# 가장 싼 주유소 10개
stations.sort_values(by="가격", ascending=True).head(10)프로젝트 결과
시각화하여 보니 셀프 주유소가 셀프가 아닌 주유소보다 가격대가 훨씬 저렴한것을 볼 수 있다. 셀프와 셀프가 아닌 주유소의 최저가격은 비슷하나 최고가격과 평균가격이 셀프주유소가 저렴하므로 셀프주유소가 셀프가 아닌주유소보다 저렴할 확률이 높다.
이글은 제로베이스 데이터 취업스쿨의 강의자료 일부를 발췌하여 작성되었습니다.

데이터 공부합니다