
인구소멸지역 분석 프로젝트
프로젝트 개요
- 인구소멸 위기 지역 파악
- 인구소멸 위기 지역의 지도 표현
- 지도 표현에 대한 카르토그램 표현
데이터 처리
데이터 가져와서 전처리하고 소멸위험 비율(20~39세 여자인구/65세 이상 인구)을 계산하여 소멸위기지역 확인
- 데이터가져오기
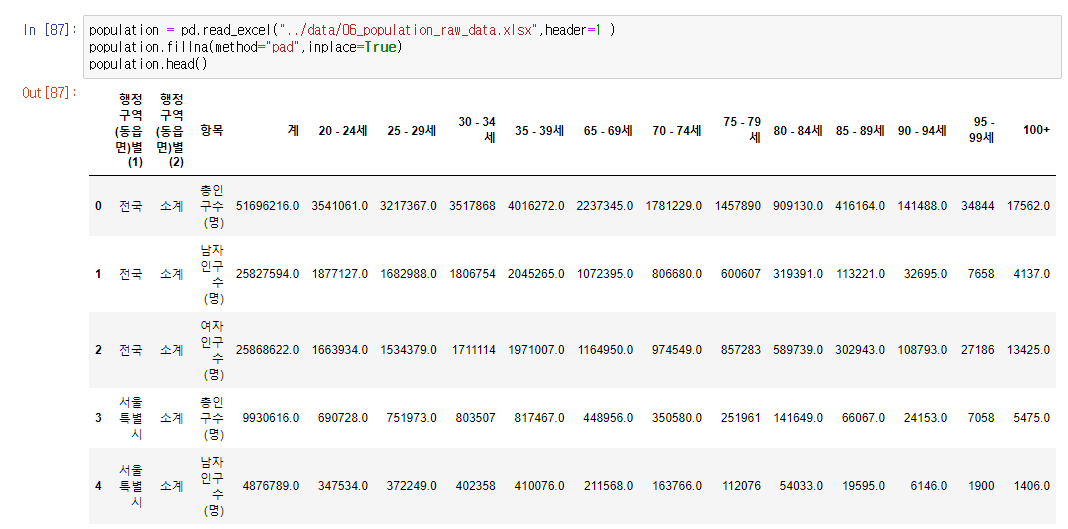
population = pd.read_excel("../data/06_population_raw_data.xlsx",header=1 )
population.fillna(method="pad",inplace=True)- 컬럼과 값 이름 수정
# 컬럼 이름 변경
population.rename(columns = {"행정구역(동읍면)별(1)":"광역시도",
"행정구역(동읍면)별(2)":"시군구",
"계":"인구수"}, inplace=True)
population = population[population["시군구"]!="소계"]
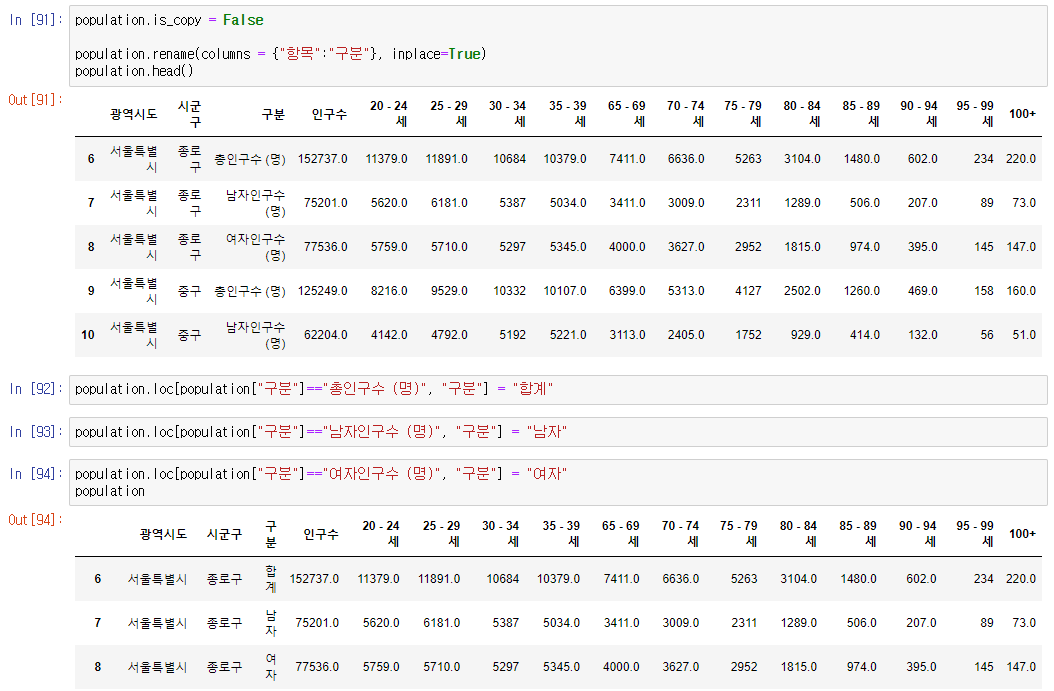
population.is_copy = False
population.rename(columns = {"항목":"구분"}, inplace=True)
population.loc[population["구분"]=="총인구수 (명)", "구분"] = "합계"
population.loc[population["구분"]=="남자인구수 (명)", "구분"] = "남자"
population.loc[population["구분"]=="여자인구수 (명)", "구분"] = "여자"- 소멸위험비율을 구하기위해 칼럼 생성
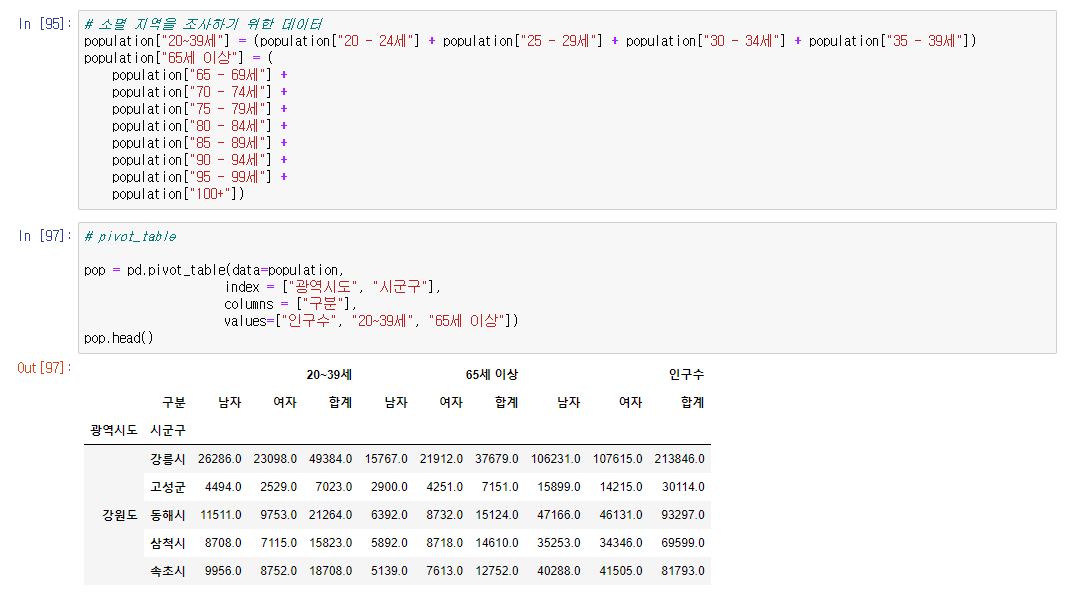
# 소멸 지역을 조사하기 위한 데이터
population["20~39세"] = (population["20 - 24세"] + population["25 - 29세"] + population["30 - 34세"] + population["35 - 39세"])
population["65세 이상"] = (
    population["65 - 69세"] +
    population["70 - 74세"] +
    population["75 - 79세"] +
    population["80 - 84세"] +
    population["85 - 89세"] +
    population["90 - 94세"] +
    population["95 - 99세"] +
    population["100+"])

# pivot_table
pop = pd.pivot_table(data=population,
                    index = ["광역시도", "시군구"],
                    columns = ["구분"],
values=["인구수", "20~39세", "65세 이상"])- 소멸위험 비율 계산
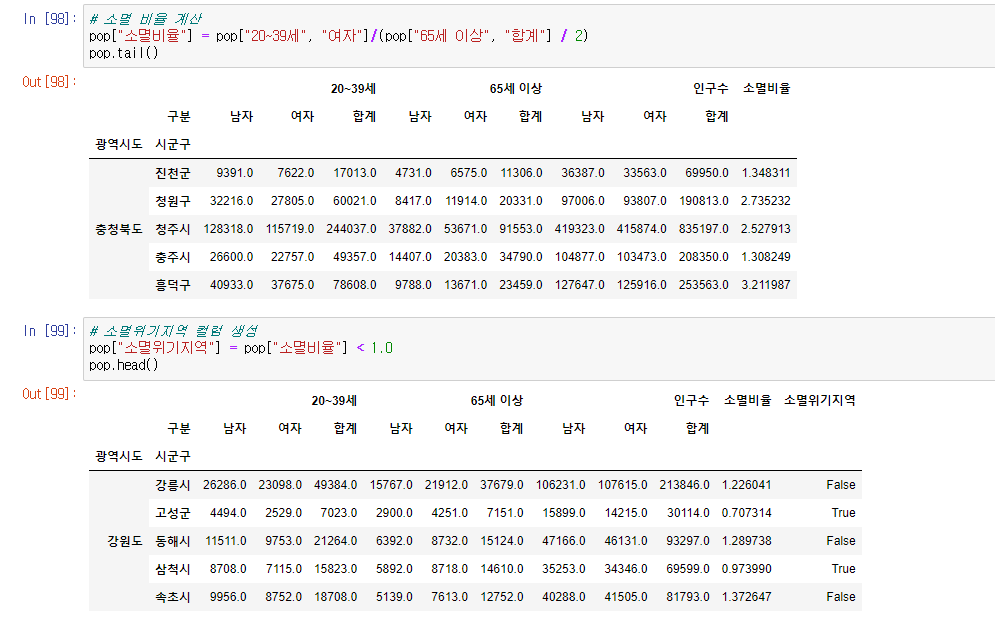
# 소멸 비율 계산
pop["소멸비율"] = pop["20~39세", "여자"]/(pop["65세 이상", "합계"] / 2)
# 소멸위기지역 컬럼 생성
pop["소멸위기지역"] = pop["소멸비율"] < 1.0- 소멸위기 지역 조회
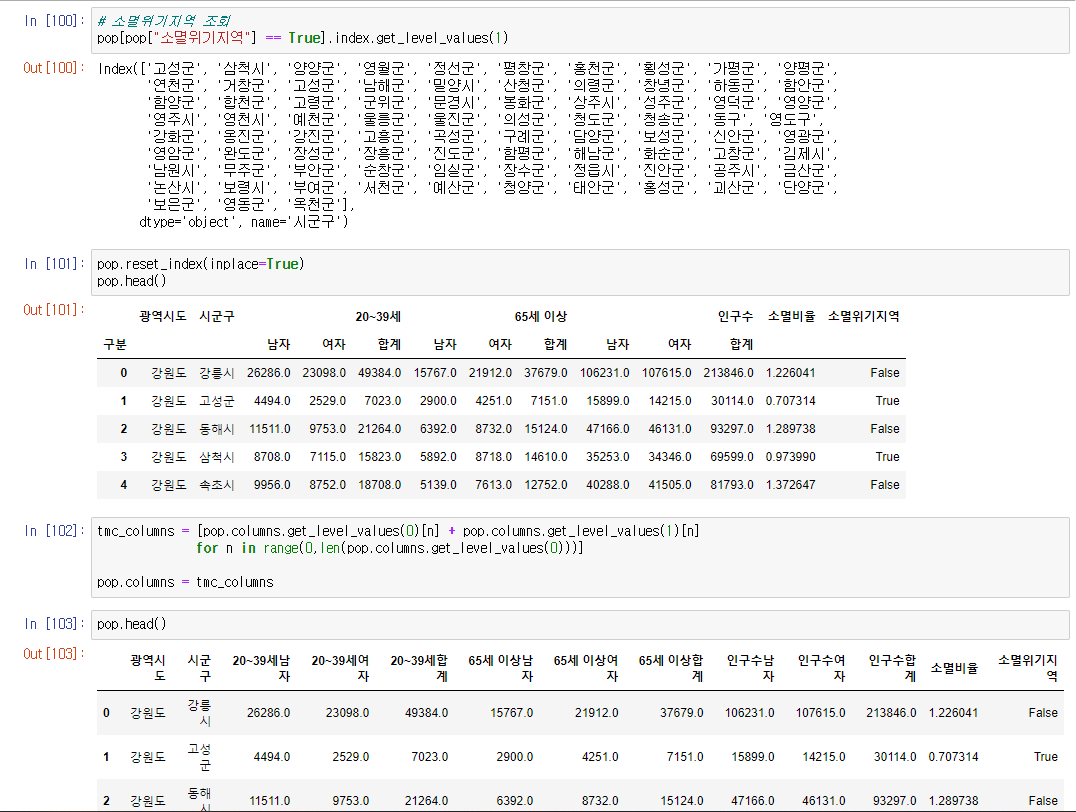
# 소멸위기지역 조회
pop[pop["소멸위기지역"] == True].index.get_level_values(1)
pop.reset_index(inplace=True)

pop.reset_index(inplace=True)
tmc_columns = [pop.columns.get_level_values(0)[n] + pop.columns.get_level_values(1)[n]
              for n in range(0,len(pop.columns.get_level_values(0)))]

pop.columns = tmc_columns
지도시각화를 위한 지역별 ID만들기
- 시군구 데이터 확인
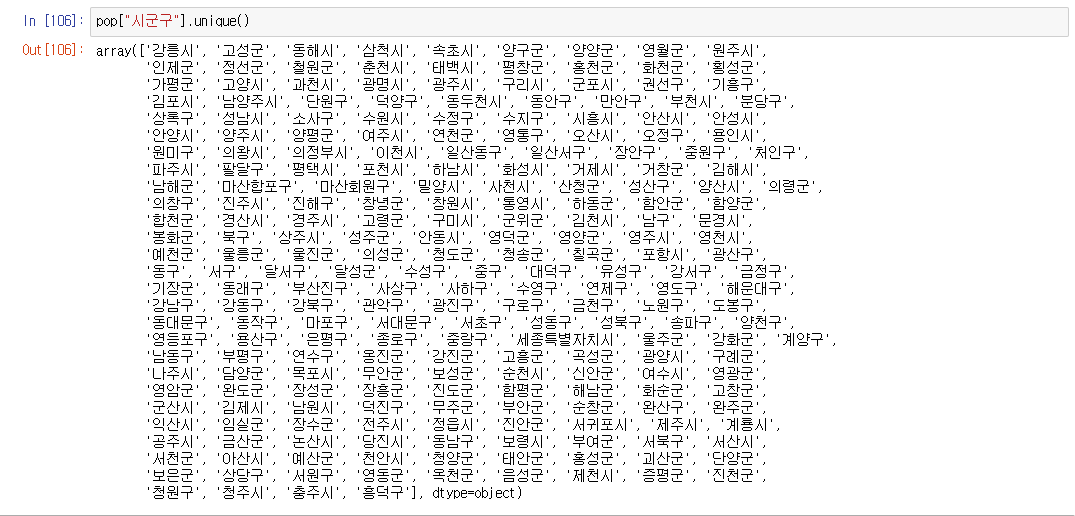
pop["시군구"].unique()- 행정구 목록 작성

tmp_gu_dict = {
    "수원":["장안구", "권선구","팔달구","영통구"],
    "성남":["수정구", "중원구","분당구"],
    "안양":["만안구","동안구"],
    "안산":["상록구","단원구"],
    "고양":["덕양구","일산동구","일산서구"],
    "용인":["처인구","기흥구","수지구"],
    "청주":["상당구","서원구","흥덕구","청원구"],
    "천안":["동남구","서북구"],
    "전주":["완산구","덕진구"],
    "포항":["남구","북구"],
    "창원":["의창구","성산구","진해구","마산합포구","마산회원구"],
"부천":["오정구","원미구","소사구"]}- 일반 시 이름과 세종시, 광역시도 일반 구 정리
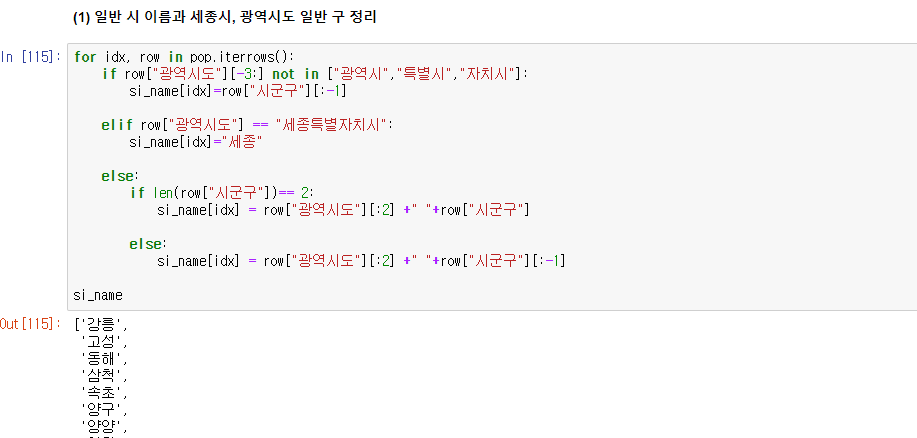
for idx, row in pop.iterrows():
    if row["광역시도"][-3:] not in ["광역시","특별시","자치시"]:
        si_name[idx]=row["시군구"][:-1]

    elif row["광역시도"] == "세종특별자치시":
        si_name[idx]="세종"

    else:
        if len(row["시군구"])== 2:
            si_name[idx] = row["광역시도"][:2] +" "+row["시군구"]

        else:
si_name[idx] = row["광역시도"][:2] +" "+row["시군구"][:-1] - 행정구 정리

for idx, row in pop.iterrows():
    if row["광역시도"][-3:] not in ["광역시","자치시","특별시"]:
        for keys, values in tmp_gu_dict.items():
            if row["시군구"] in values:
                if len(row["시군구"])==2:
                    si_name[idx] = keys + " " + row["시군구"]
                elif row["시군구"] in ["마산합포구","마산회원구"]:
                    si_name[idx] = keys + " " + row["시군구"][2:-1]
                else:
si_name[idx] = keys + " " + row["시군구"][:-1]- 고성군(강원, 전남 둘다 고성군 존재)

for idx, row in pop.iterrows():
    if row["광역시도"][-3:] not in ["광역시","자치시","특별시"]:
        if row["시군구"][:-1] == "고성" and row["광역시도"] == "강원도":
            si_name[idx] = "고성(강원)"
        elif row["시군구"][:-1] == "고성" and row["광역시도"] == "경상남도":
si_name[idx] = "고성(경남)"- ID 칼럼에 정리한 데이터 넣기
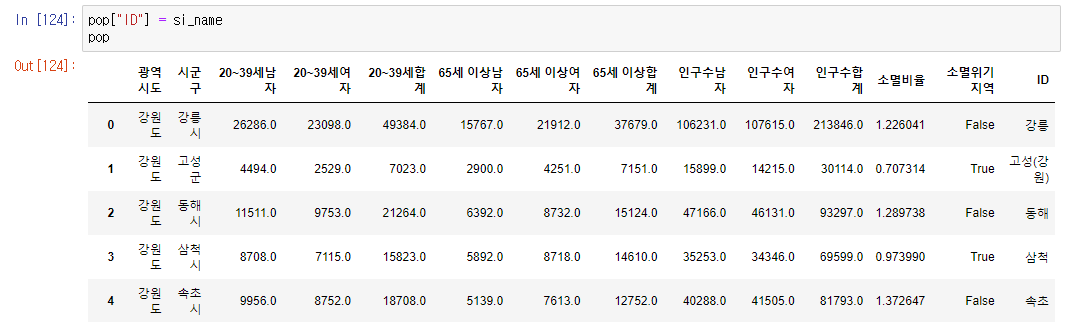
pop["ID"] = si_name- 불필요한 칼럼 삭제
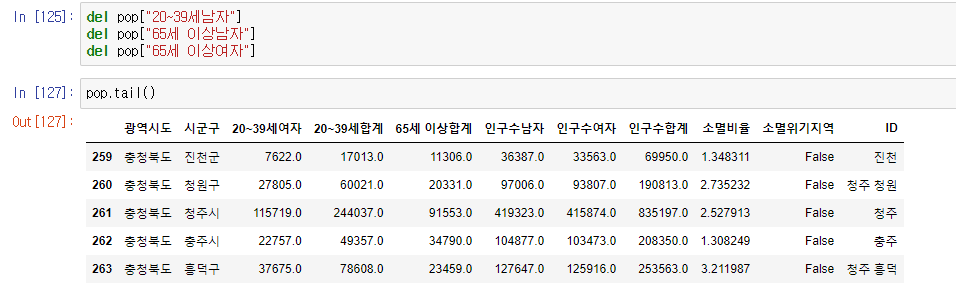
del pop["20~39세남자"]
del pop["65세 이상남자"]
del pop["65세 이상여자"]
지도그리기(카르토그램)
- 한국의 지역위치를 담은 엑셀파일을 읽어온다.
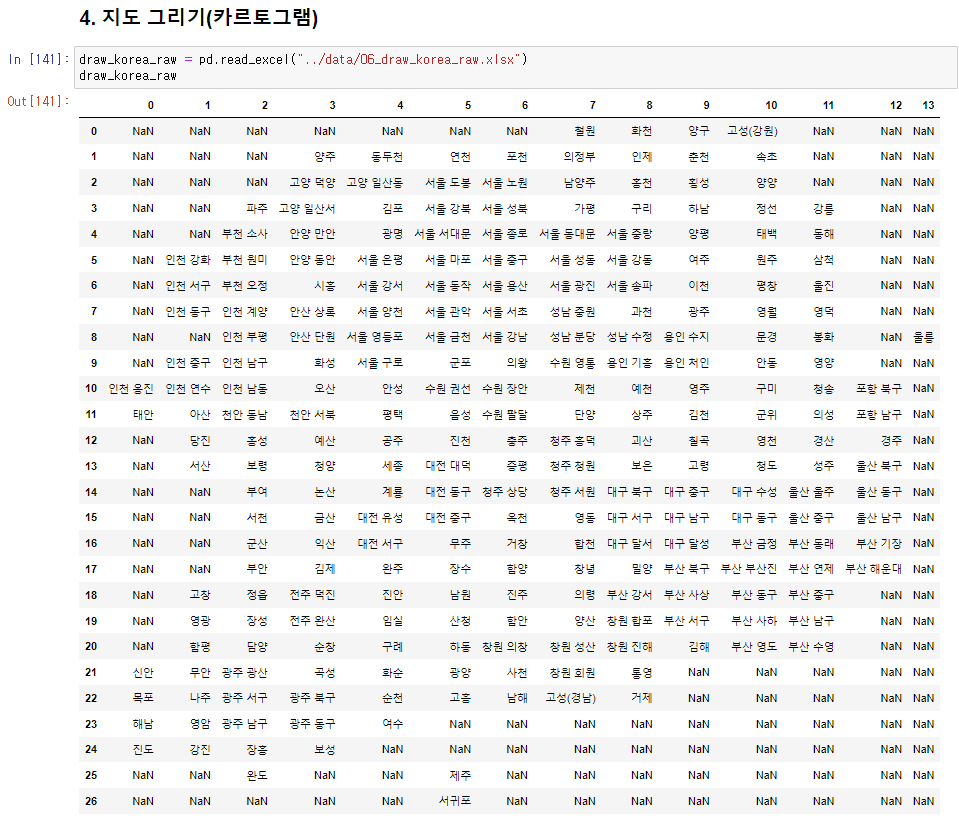
draw_korea_raw = pd.read_excel("../data/06_draw_korea_raw.xlsx")- 데이터의 행과 열값을 데이터 프레임으로 가져옴
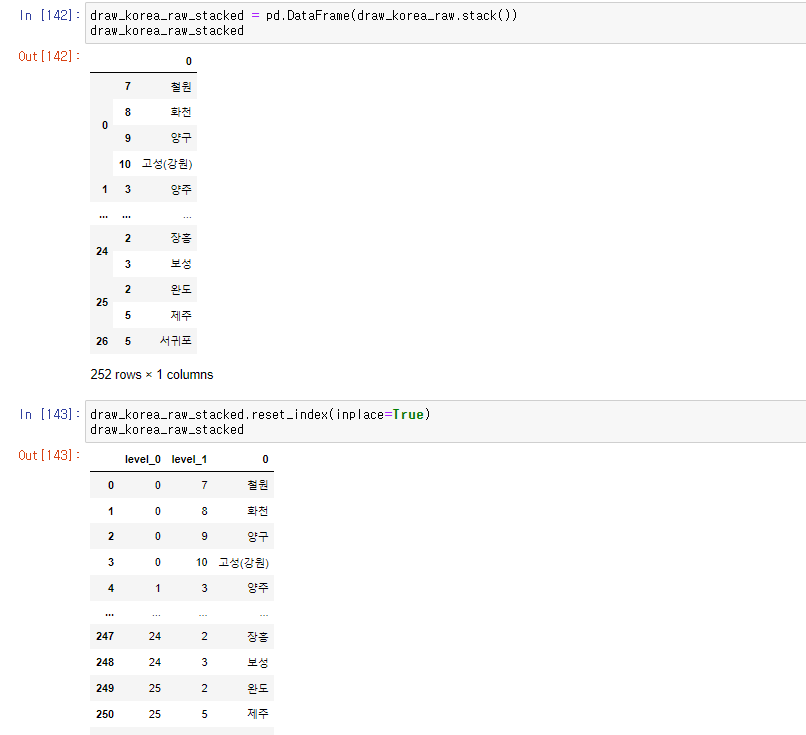
draw_korea_raw_stacked = pd.DataFrame(draw_korea_raw.stack())
draw_korea_raw_stacked.reset_index(inplace=True)
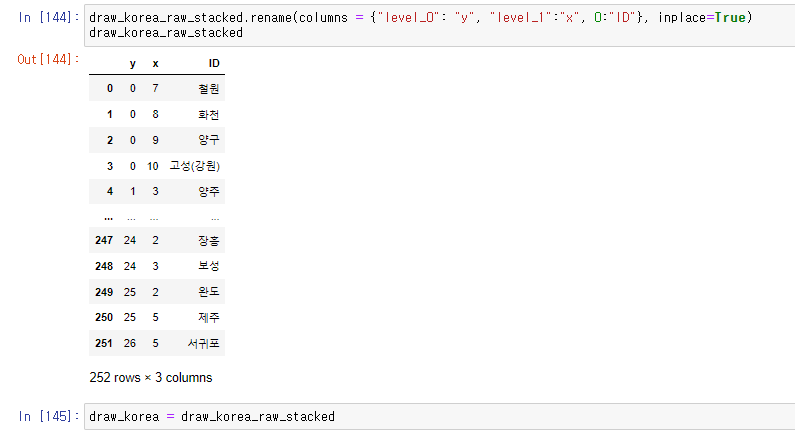
draw_korea_raw_stacked.rename(columns = {"level_0": "y", "level_1":"x", 0:"ID"}, inplace=True)
draw_korea = draw_korea_raw_stacked- 한국의 지도 모양으로 선을 그은 데이터
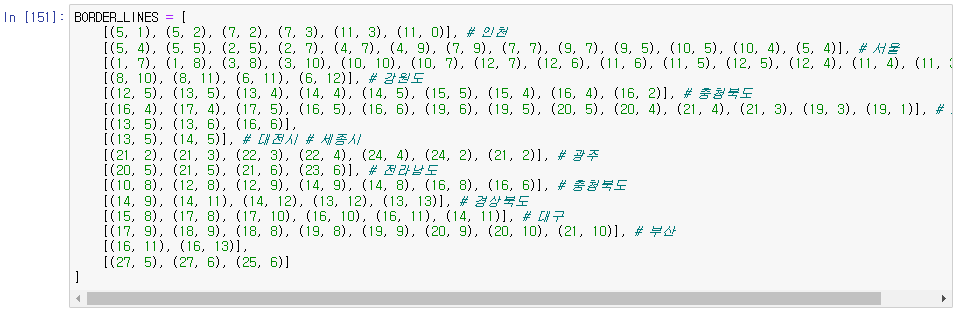
BORDER_LINES = [
    [(5, 1), (5, 2), (7, 2), (7, 3), (11, 3), (11, 0)], # 인천
    [(5, 4), (5, 5), (2, 5), (2, 7), (4, 7), (4, 9), (7, 9), (7, 7), (9, 7), (9, 5), (10, 5), (10, 4), (5, 4)], # 서울
    [(1, 7), (1, 8), (3, 8), (3, 10), (10, 10), (10, 7), (12, 7), (12, 6), (11, 6), (11, 5), (12, 5), (12, 4), (11, 4), (11, 3)], # 경기도
    [(8, 10), (8, 11), (6, 11), (6, 12)], # 강원도
    [(12, 5), (13, 5), (13, 4), (14, 4), (14, 5), (15, 5), (15, 4), (16, 4), (16, 2)], # 충청북도
    [(16, 4), (17, 4), (17, 5), (16, 5), (16, 6), (19, 6), (19, 5), (20, 5), (20, 4), (21, 4), (21, 3), (19, 3), (19, 1)], # 전라북도
    [(13, 5), (13, 6), (16, 6)],
    [(13, 5), (14, 5)], # 대전시 # 세종시
    [(21, 2), (21, 3), (22, 3), (22, 4), (24, 4), (24, 2), (21, 2)], # 광주
    [(20, 5), (21, 5), (21, 6), (23, 6)], # 전라남도
    [(10, 8), (12, 8), (12, 9), (14, 9), (14, 8), (16, 8), (16, 6)], # 충청북도
    [(14, 9), (14, 11), (14, 12), (13, 12), (13, 13)], # 경상북도
    [(15, 8), (17, 8), (17, 10), (16, 10), (16, 11), (14, 11)], # 대구
    [(17, 9), (18, 9), (18, 8), (19, 8), (19, 9), (20, 9), (20, 10), (21, 10)], # 부산
    [(16, 11), (16, 13)],
[(27, 5), (27, 6), (25, 6)]]- 한국의 지역위치 데이터와 선 데이터를 합친다.
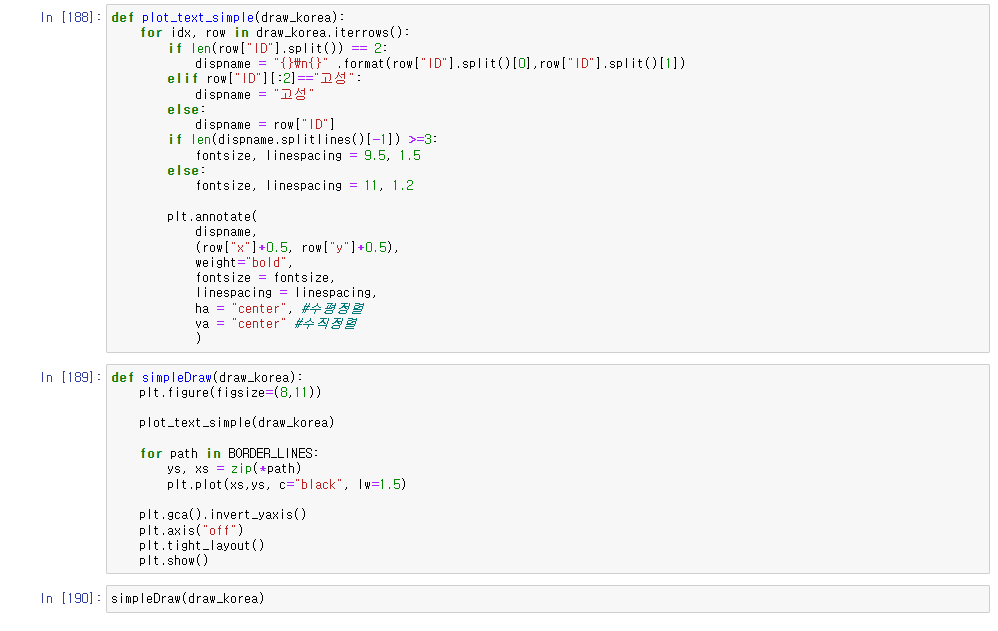
def plot_text_simple(draw_korea):
    for idx, row in draw_korea.iterrows():
        if len(row["ID"].split()) == 2:
            dispname = "{}\n{}" .format(row["ID"].split()[0],row["ID"].split()[1])
        elif row["ID"][:2]=="고성":
            dispname = "고성"
        else:
            dispname = row["ID"]
        if len(dispname.splitlines()[-1]) >=3:
            fontsize, linespacing = 9.5, 1.5
        else:
            fontsize, linespacing = 11, 1.2

        plt.annotate(
            dispname,
            (row["x"]+0.5, row["y"]+0.5),
            weight="bold",
            fontsize = fontsize,
            linespacing = linespacing,
            ha = "center", #수평정렬
            va = "center") #수직정렬

def simpleDraw(draw_korea):
    plt.figure(figsize=(8,11))

    plot_text_simple(draw_korea)

    for path in BORDER_LINES:
        ys, xs = zip(*path)
        plt.plot(xs,ys, c="black", lw=1.5)

    plt.gca().invert_yaxis()
    plt.axis("off")
    plt.tight_layout()
    plt.show()
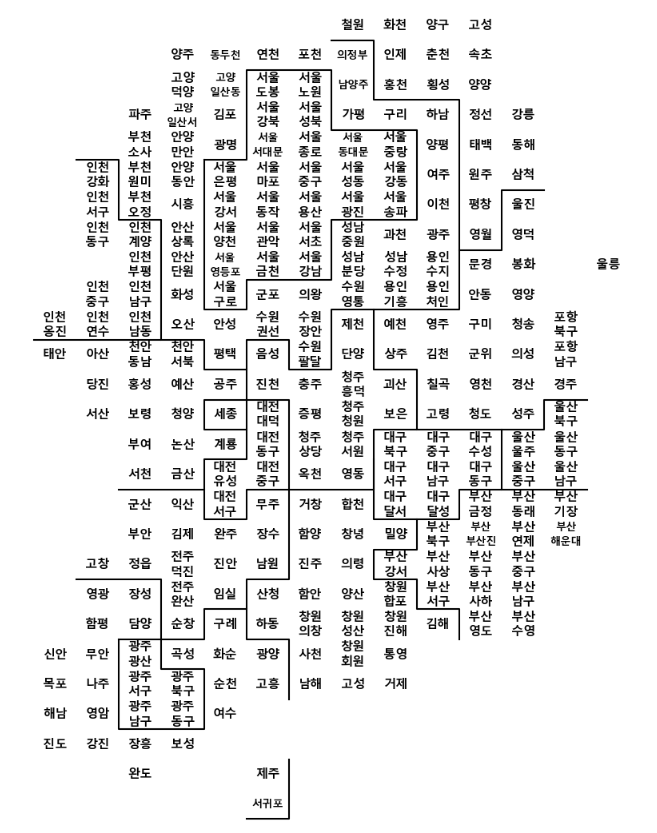
simpleDraw(draw_korea)- 두 데이터 사이 검증 작업
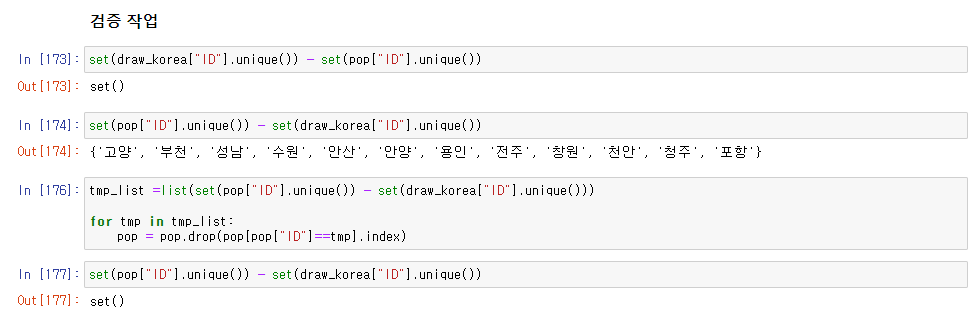
set(draw_korea["ID"].unique()) - set(pop["ID"].unique())
set(pop["ID"].unique()) - set(draw_korea["ID"].unique())
tmp_list =list(set(pop["ID"].unique()) - set(draw_korea["ID"].unique()))

for tmp in tmp_list:
pop = pop.drop(pop[pop["ID"]==tmp].index)- 두 데이터 합병
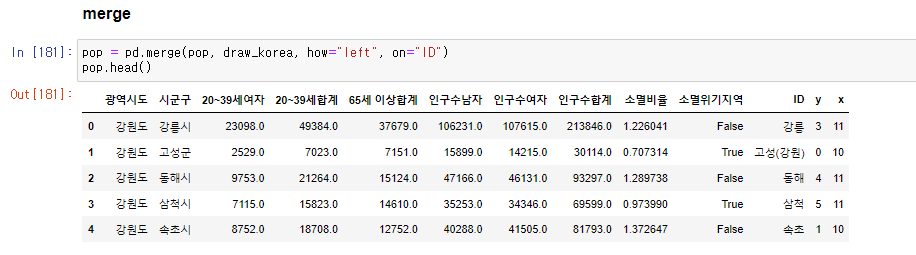
pop = pd.merge(pop, draw_korea, how="left", on="ID")그림을 그리기 위한 데이터를 계산하는 함수
- 색상을 만들때, 최소값으르 흰색
- blockedMap: 인구현황(pop)
- targetData: 그리고 싶은 컬럼
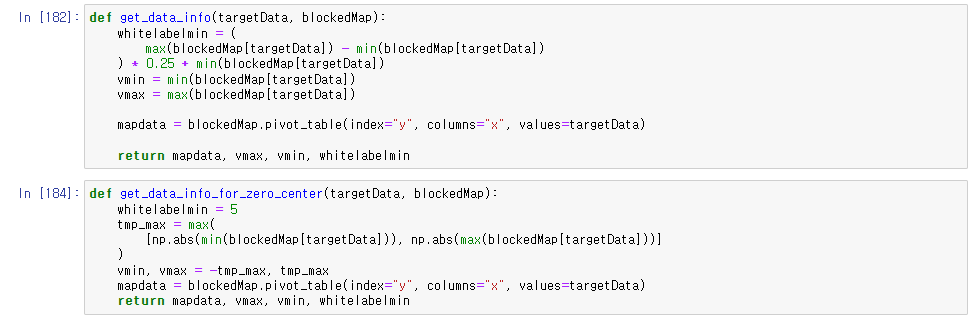
def get_data_info(targetData, blockedMap):
    whitelabelmin = (
        max(blockedMap[targetData]) - min(blockedMap[targetData])
    ) * 0.25 + min(blockedMap[targetData])
    vmin = min(blockedMap[targetData])
    vmax = max(blockedMap[targetData])

    mapdata = blockedMap.pivot_table(index="y", columns="x", values=targetData)

    return mapdata, vmax, vmin, whitelabelmin
def get_data_info_for_zero_center(targetData, blockedMap):
whitelabelmin = 5
tmp_max = max(
[np.abs(min(blockedMap[targetData])), np.abs(max(blockedMap[targetData]))]
)
vmin, vmax = -tmp_max, tmp_max
mapdata = blockedMap.pivot_table(index="y", columns="x", values=targetData)
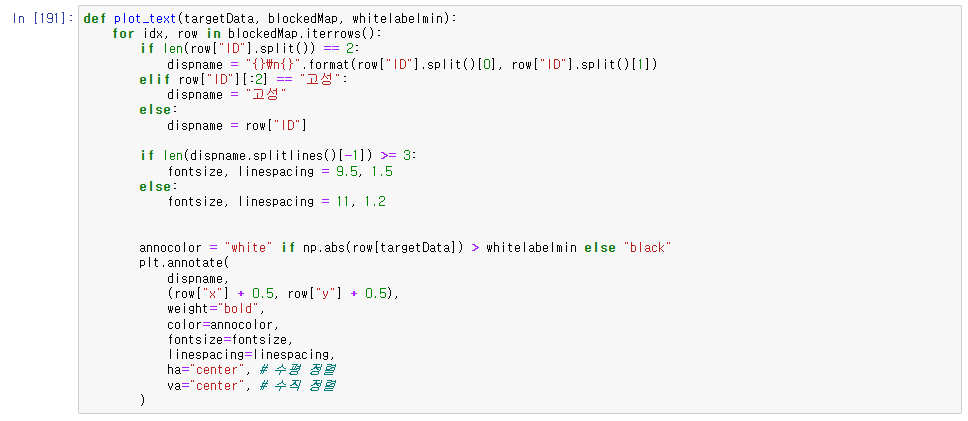
return mapdata, vmax, vmin, whitelabelmindef plot_text(targetData, blockedMap, whitelabelmin):
for idx, row in blockedMap.iterrows():
if len(row["ID"].split()) == 2:
dispname = "{}\n{}".format(row["ID"].split()[0], row["ID"].split()[1])
elif row["ID"][:2] == "고성":
dispname = "고성"
else:
dispname = row["ID"]
if len(dispname.splitlines()[-1]) >= 3:
fontsize, linespacing = 9.5, 1.5
else:
fontsize, linespacing = 11, 1.2
annocolor = "white" if np.abs(row[targetData]) > whitelabelmin else "black"
plt.annotate(
dispname,
(row["x"] + 0.5, row["y"] + 0.5),
weight="bold",
color=annocolor,
fontsize=fontsize,
linespacing=linespacing,
ha="center", # 수평 정렬
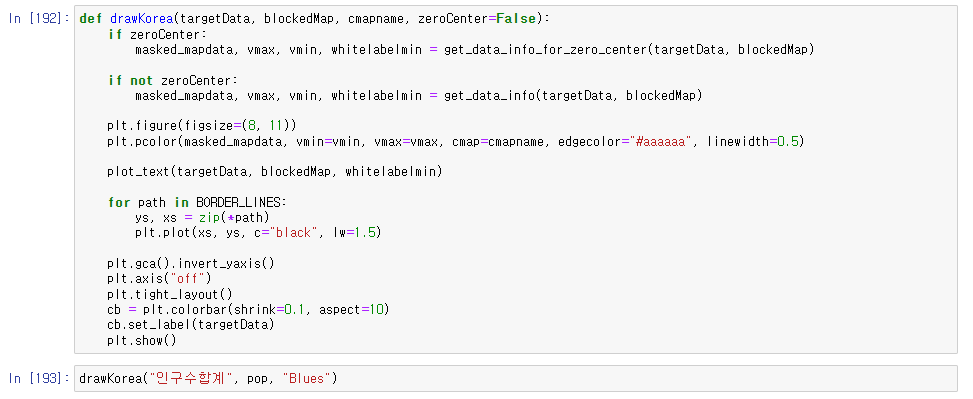
va="center") # 수직 정렬 def drawKorea(targetData, blockedMap, cmapname, zeroCenter=False):
if zeroCenter:
masked_mapdata, vmax, vmin, whitelabelmin = get_data_info_for_zero_center(targetData, blockedMap)
if not zeroCenter:
masked_mapdata, vmax, vmin, whitelabelmin = get_data_info(targetData, blockedMap)
plt.figure(figsize=(8, 11))
plt.pcolor(masked_mapdata, vmin=vmin, vmax=vmax, cmap=cmapname, edgecolor="#aaaaaa", linewidth=0.5)
plot_text(targetData, blockedMap, whitelabelmin)
for path in BORDER_LINES:
ys, xs = zip(*path)
plt.plot(xs, ys, c="black", lw=1.5)
plt.gca().invert_yaxis()
plt.axis("off")
plt.tight_layout()
cb = plt.colorbar(shrink=0.1, aspect=10)
cb.set_label(targetData)
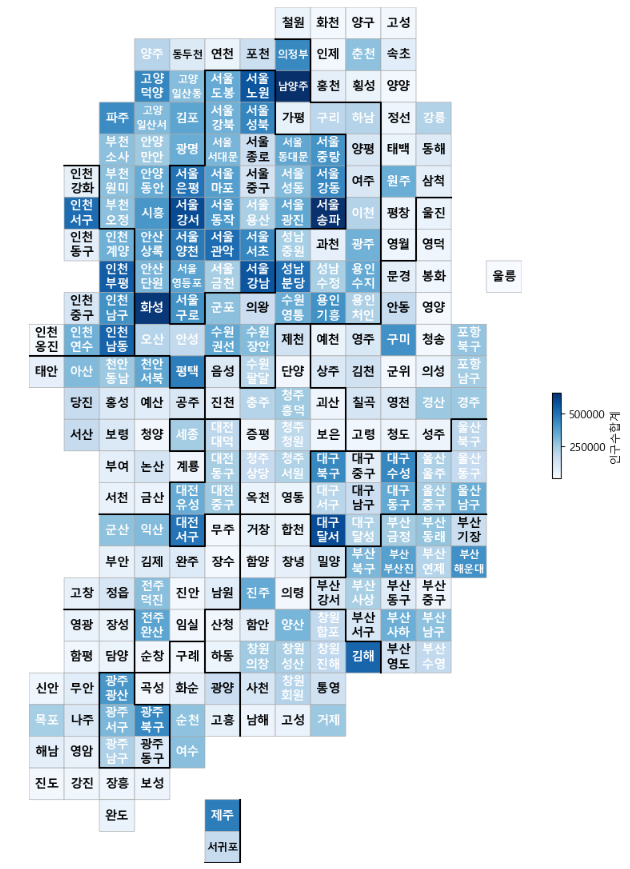
plt.show()drawKorea("인구수합계", pop, "Blues")
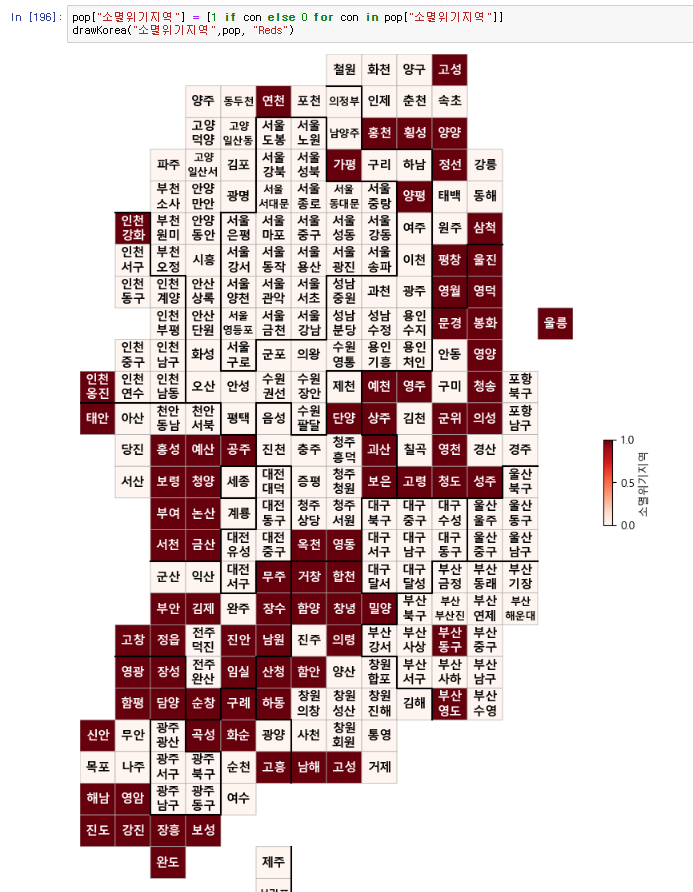
pop["소멸위기지역"] = [1 if con else 0 for con in pop["소멸위기지역"]]
drawKorea("소멸위기지역",pop, "Reds")
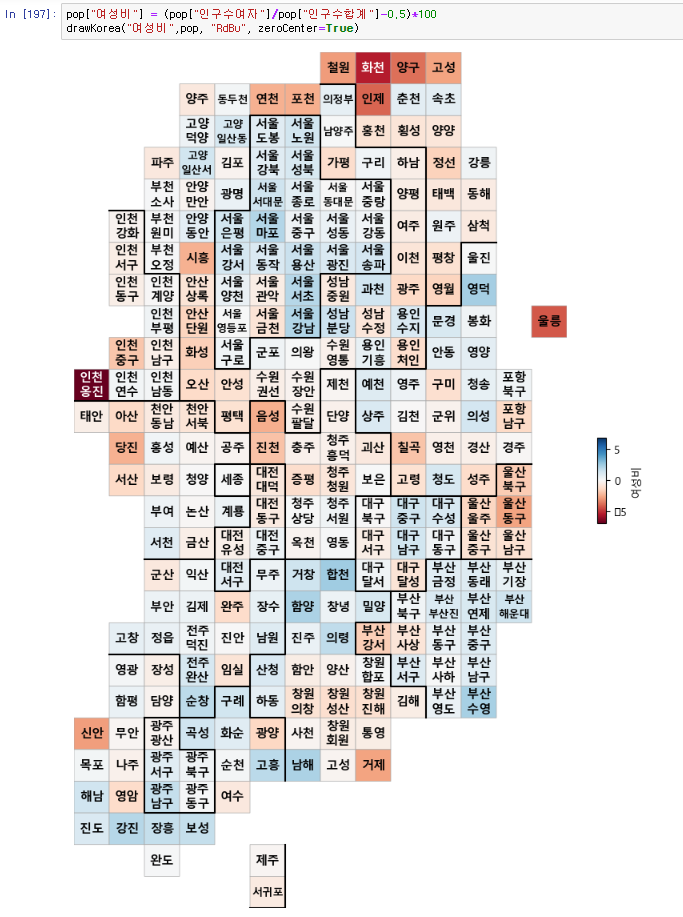
pop["여성비"] = (pop["인구수여자"]/pop["인구수합계"]-0.5)*100
drawKorea("여성비",pop, "RdBu", zeroCenter=True)
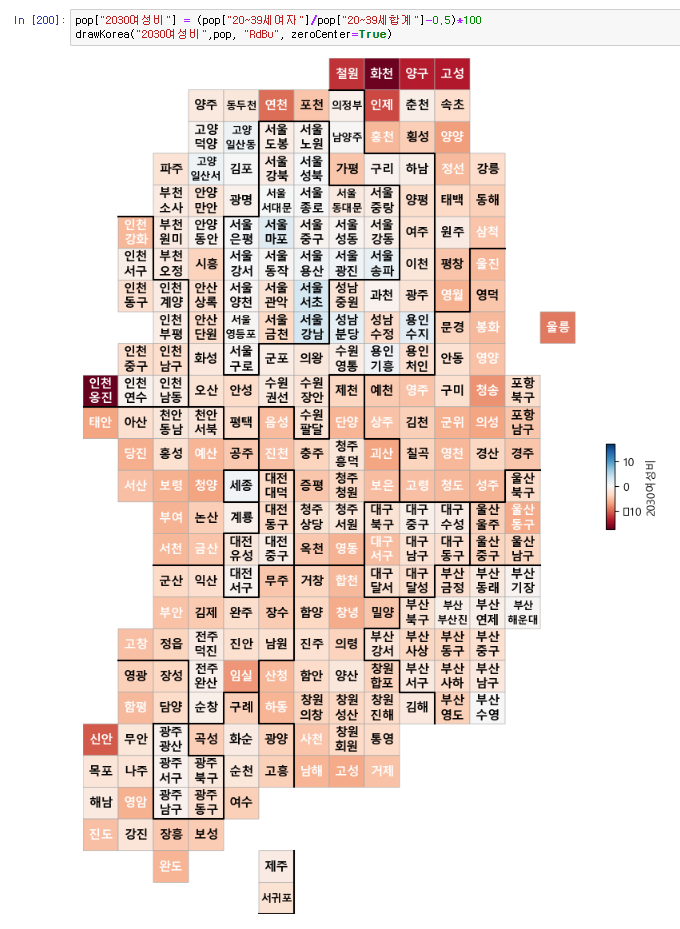
pop["2030여성비"] = (pop["20~39세여자"]/pop["20~39세합계"]-0.5)*100
drawKorea("2030여성비",pop, "RdBu", zeroCenter=True)프로젝트 완성
소멸위기지역을 시각화하니 서울과 경기도 외에 많은 지역이 소멸위기지역인 것으로 보여 인구감소와 저출산에 큰 문제가 있는것 같다.
후기
데이터 처리까지 할만했는데 지도 시각화를 위해 지역정리부터 너무 어렵고 이해가 안되어 카르토그램 그리기 실습에 어려움이 있었다. 이런 분석방법도 있구나 하고 넘어갈 수 밖에... 카르토그램 너무 어렵지만 시각화 완성된 결과물이 매우 가독성있고, 정보가 한눈에 보여서 좋은 차트인것 같다.
이글은 제로베이스 데이터 취업스쿨의 강의자료 일부를 발췌하여 작성되었습니다.

데이터 공부합니다