히스토그램을 그리고 싶을때 y variable 없이 ggplot을 이용해서 그려보자.
일단, frequency table로 수치 체크하기.
# data import
studentTime <- read.csv("studentTime.csv")

# frequency table, 내림차순
frq_table = sort(table(studentTime$faculty), decreasing = TRUE)
> frq_table
science medicine art others
30 15 10 5 그럼 이제 하나의 column 안의 각 faculty의 숫자를 보여주는 히스토그램을 그려보쟈..
먼저, 간단하게 barplot 활용할건데, 일반적으로 x, y를 모두 받아오는 바 그래프가 아닌, 히스토그램처럼 x variable 안에서 수치를 각각 구분하고 싶을때에는 table()을 이용하면 된다.
bar_plot = barplot(table(studentTime$faculty), ylim=c(0,35), main="Bar Plot of Faculty Frequency")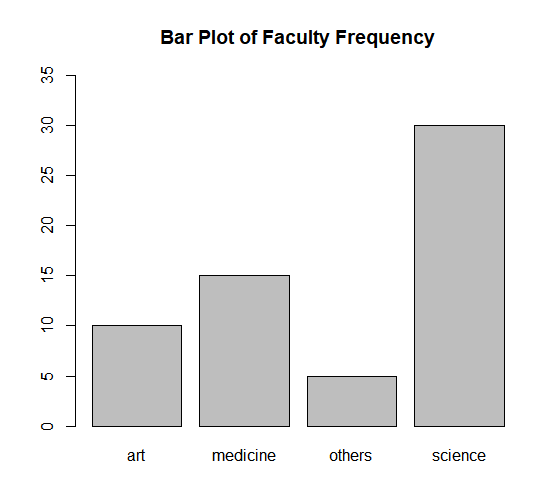
이번에는, ggplot을 활용해보쟈
- factor()을 활용하면 continuous x variable을 discrete로 취급할 수 있다.
- geom_text()로 데이터 레이블을 추가했음.
- labs()로 타이틀 추가
library(ggplot2)


ggplot(studentTime, aes(x=factor(faculty))) + geom_bar() + geom_text(aes(label = ..count..), stat = "count", vjust = 1.5, colour = "white") + labs(title = "Frequency of Faculty", x = "Type of Faculty", y = "count")

