-
개발환경 : Tomcat11, Spring boot 3.4, WAR
-
스프링부트에 Actuator + Prometheus 의존성 설치
- Actuator : 애플리케이션 메트릭과 상태 노출
- Prometheus : Prometheus 형식 메트릭 변환 및 노출
		<dependency>
		    <groupId>io.micrometer</groupId>
		    <artifactId>micrometer-registry-prometheus</artifactId>
		    <version>1.15.0</version>
		</dependency>
		<dependency>
		    <groupId>org.springframework.boot</groupId>
		    <artifactId>spring-boot-starter-actuator</artifactId>
</dependency>- application.yml에 엔드포인트 작성
management:
  endpoints:
    web:
      exposure:
        include: prometheus
  endpoint:
    prometheus: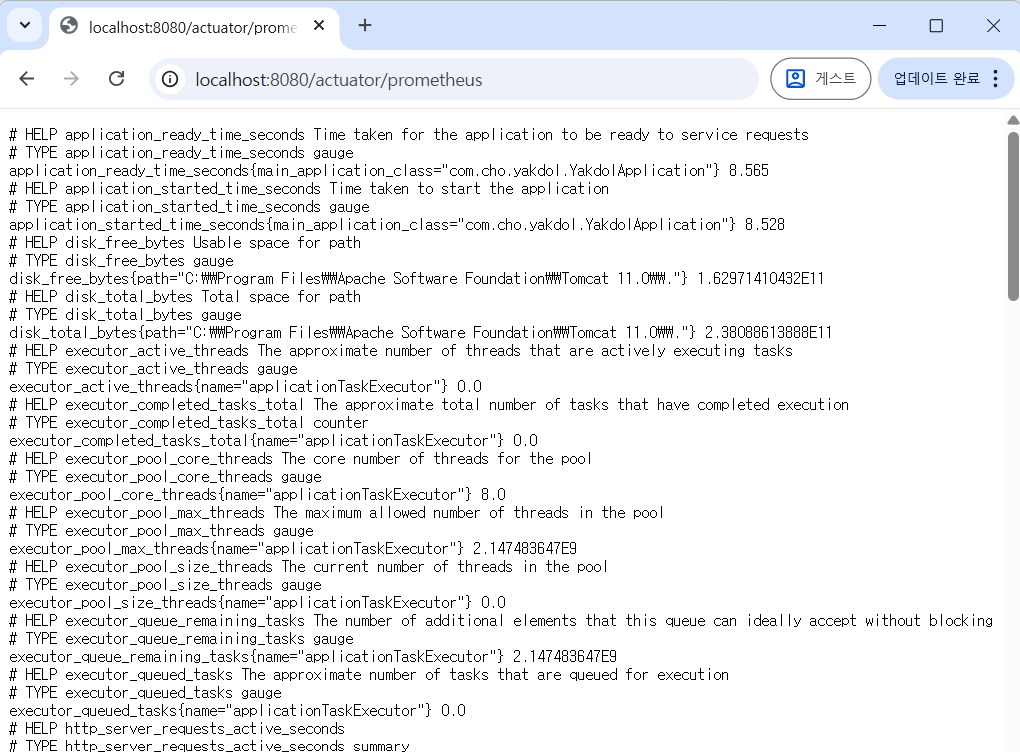
enabled: true- 톰캣에 서버 올리고, http://localhost:8080/actuator/prometheus 접속확인
- Prometheus 설치 + promethues.yml 수정
scrape_configs:
- job_name: "spring"
metrics_path: "/actuator/prometheus" #엔드포인트path
static_configs:
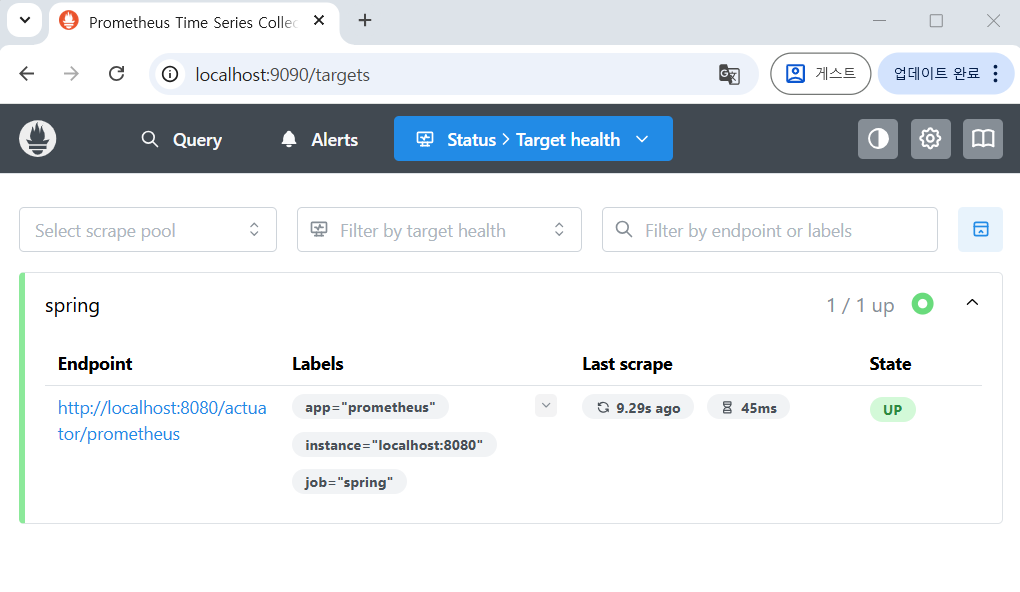
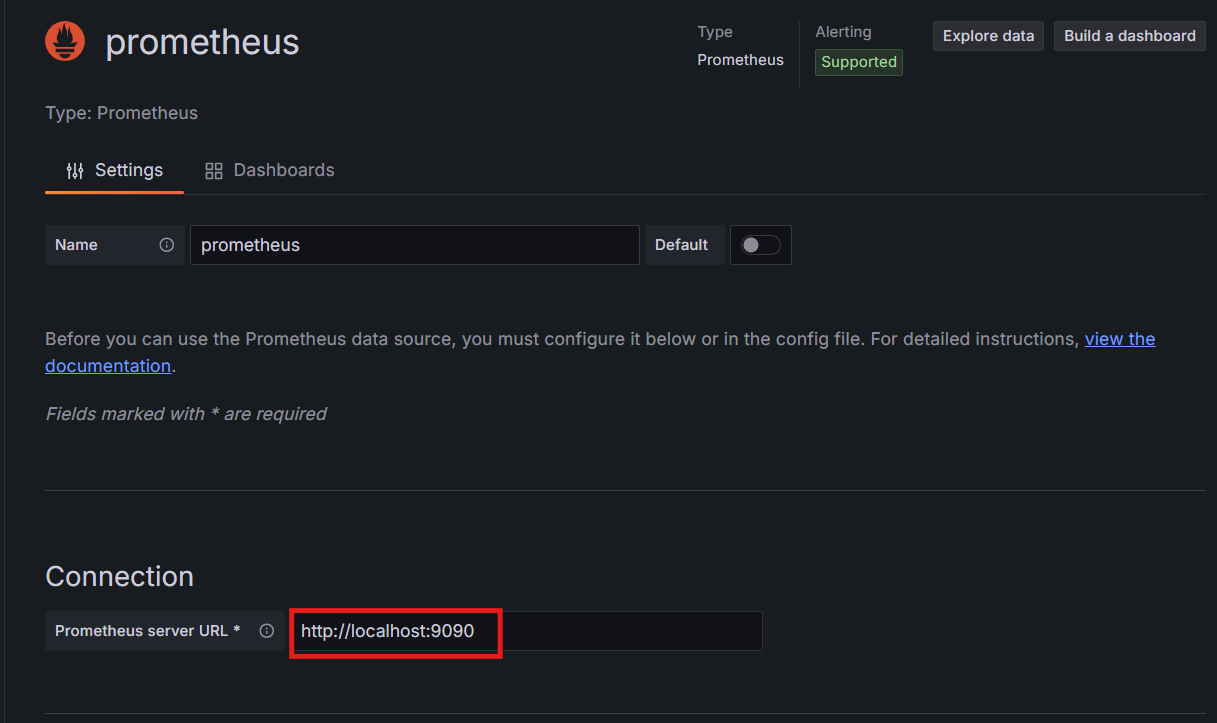
- targets: ["localhost:8080"] # 스크랩해올 서버- 프로메테우스 서버 접속 확인
(프로메테우스 기본 포트 9090)
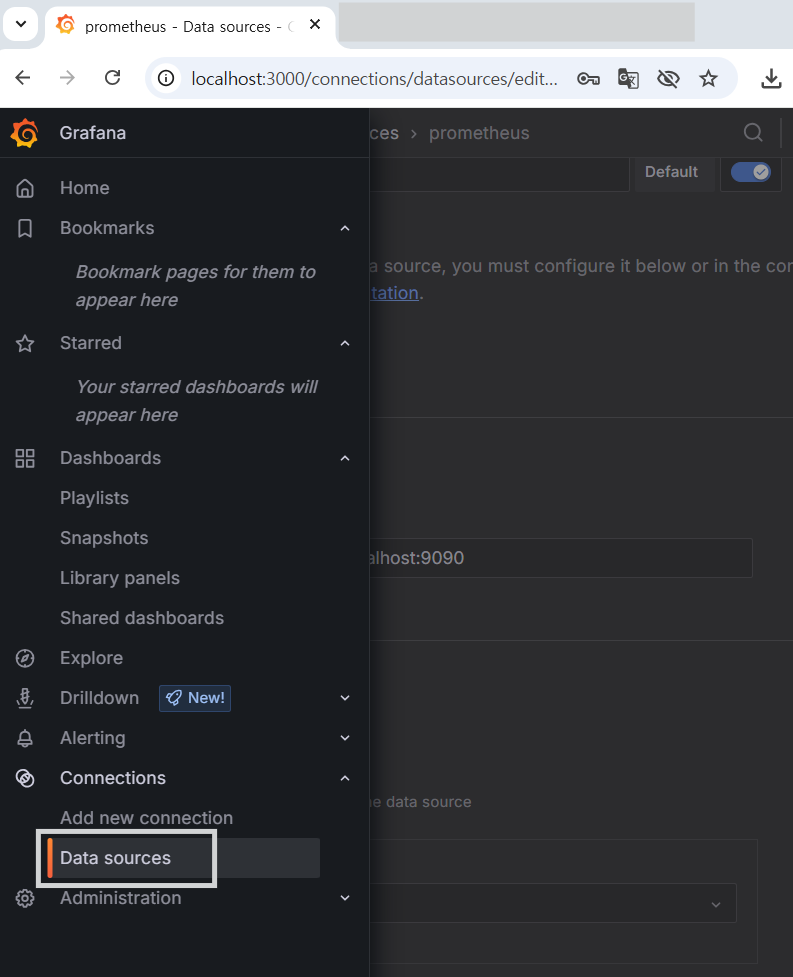
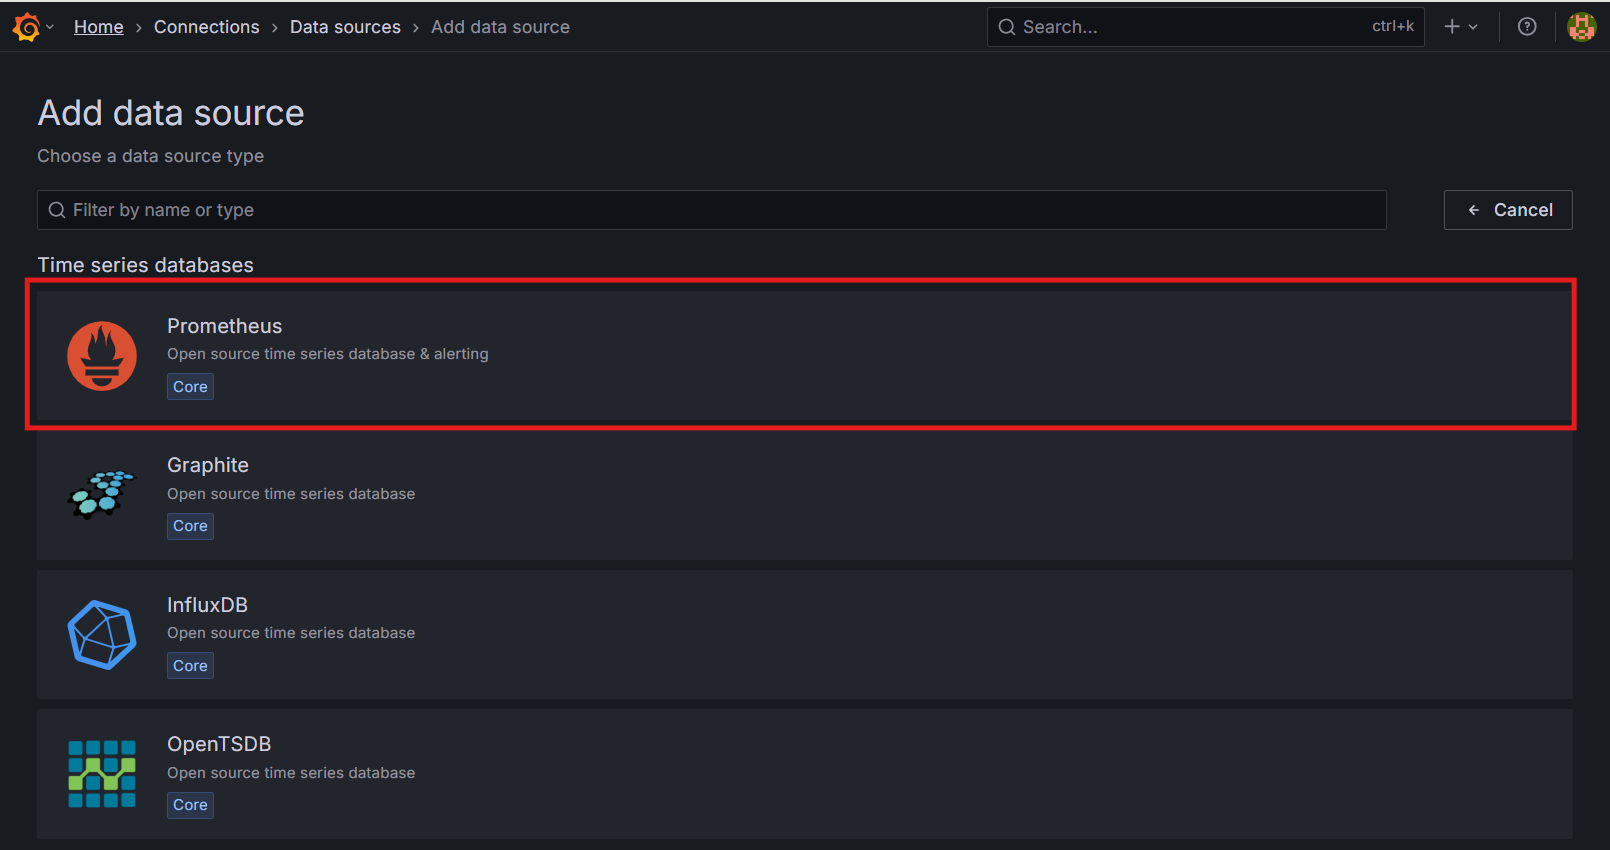
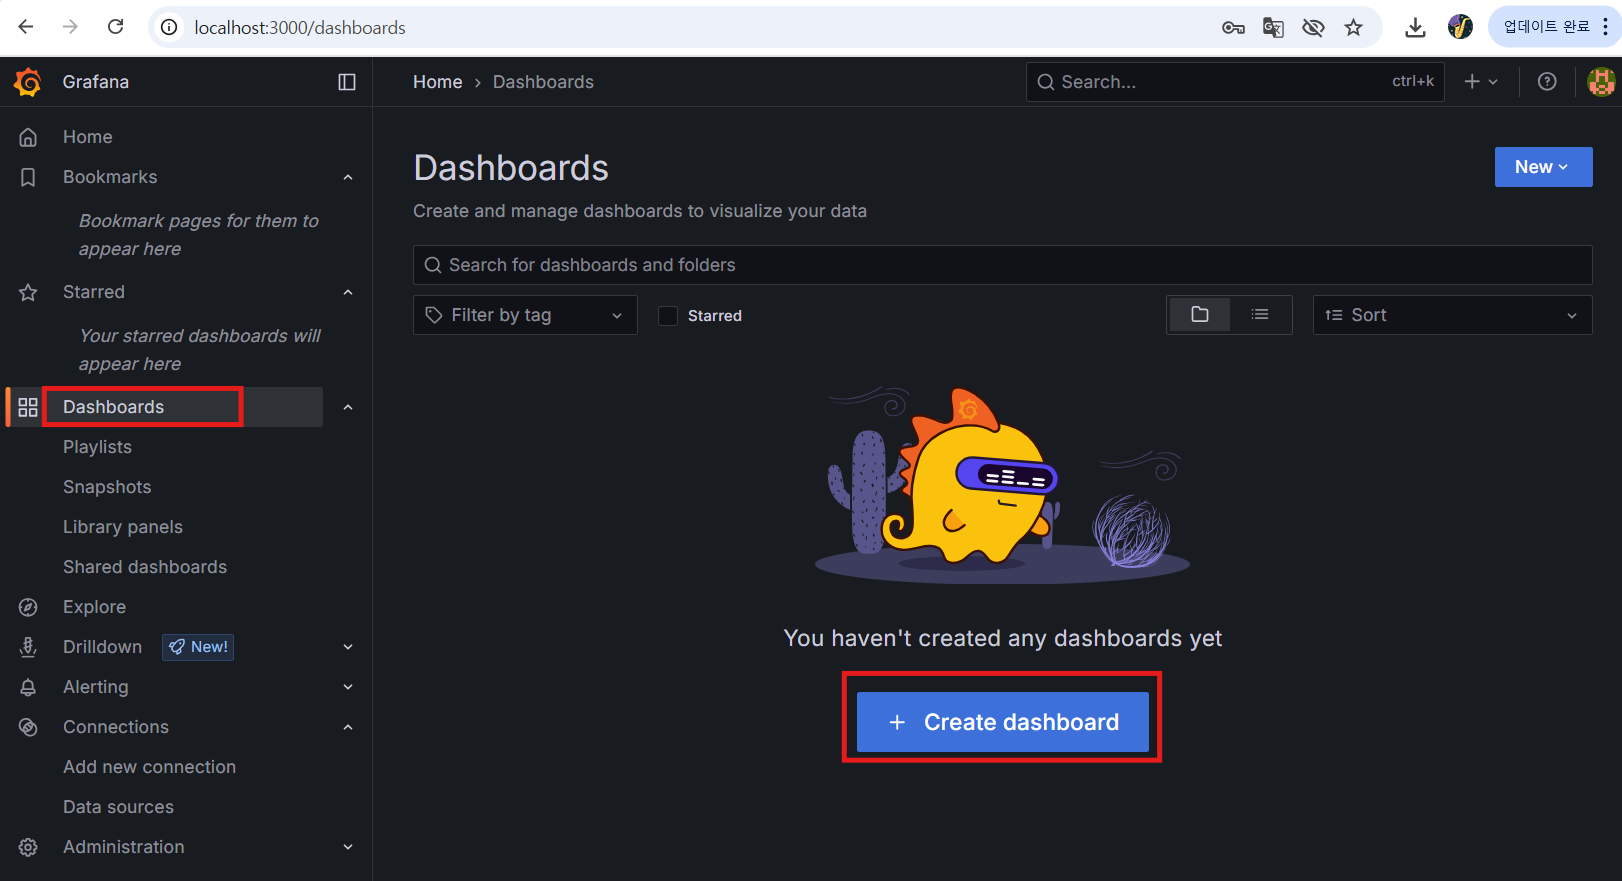
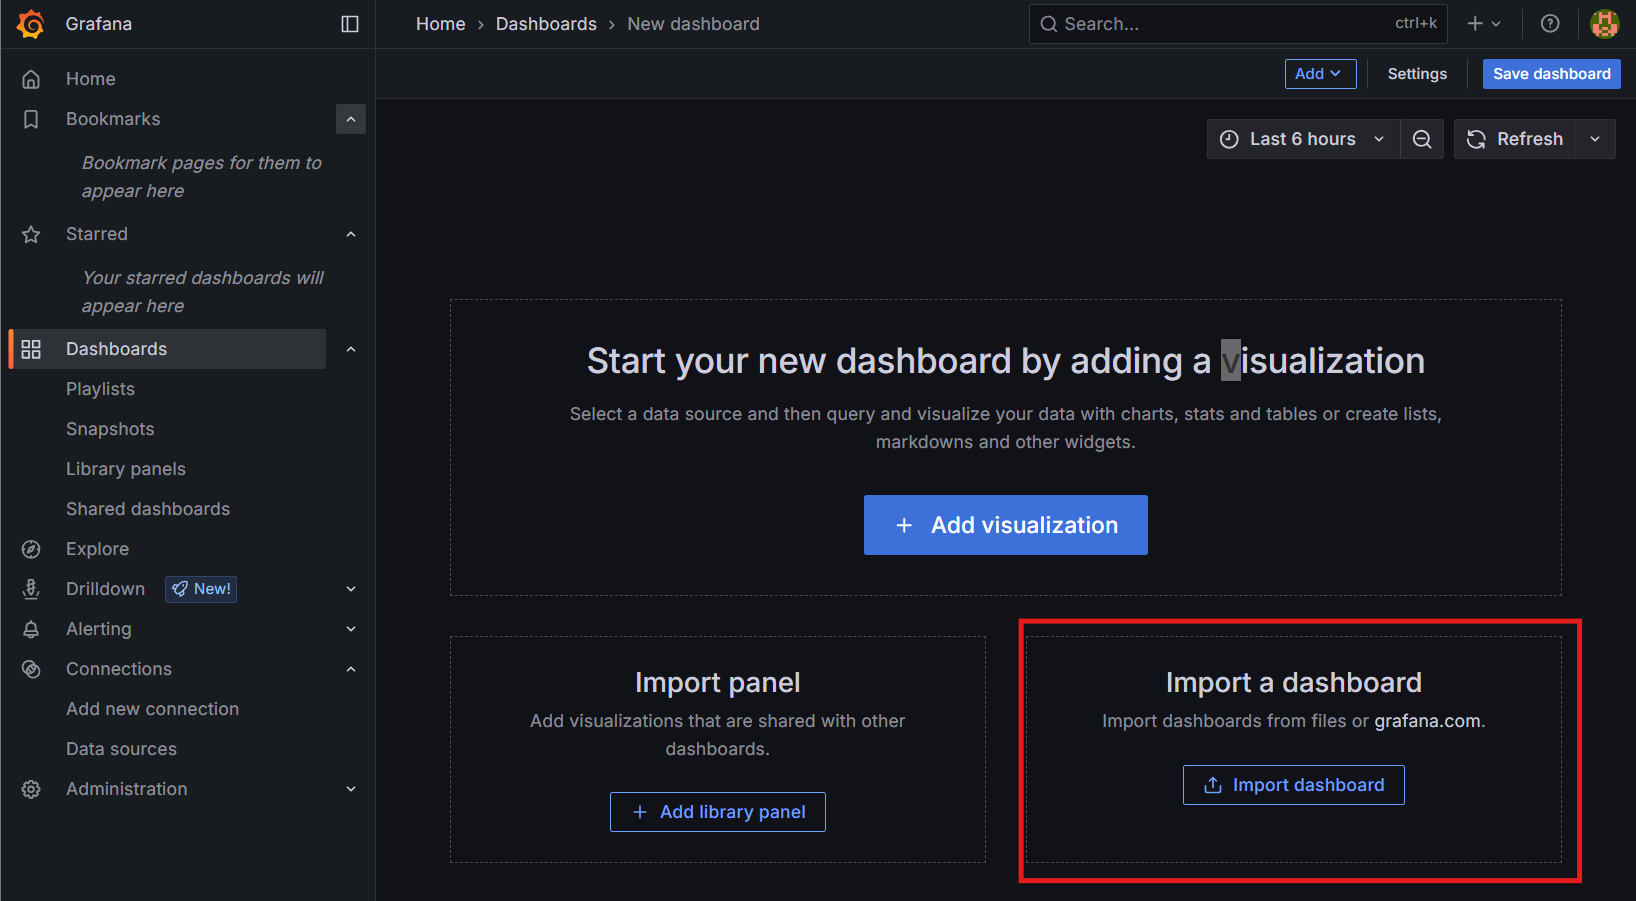
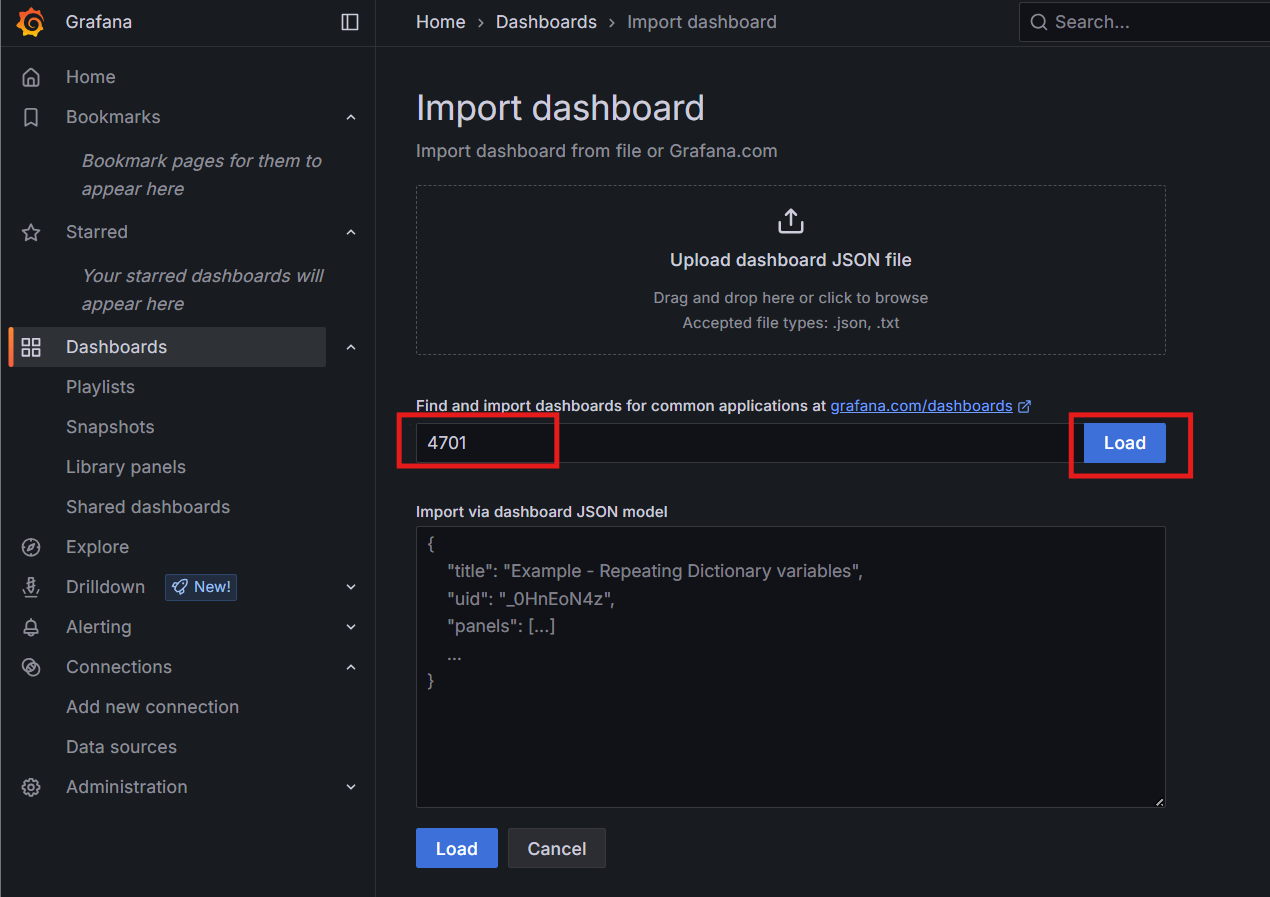
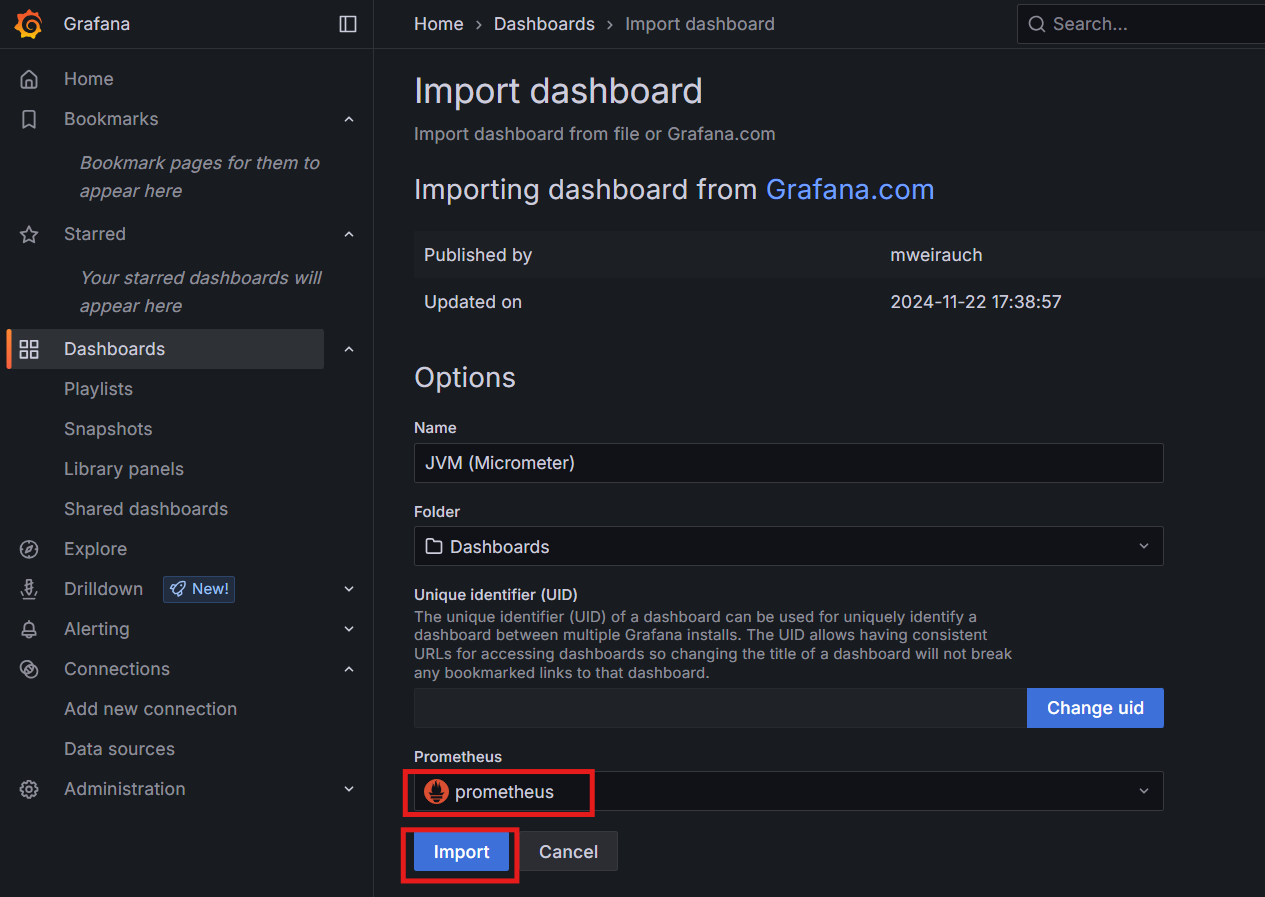
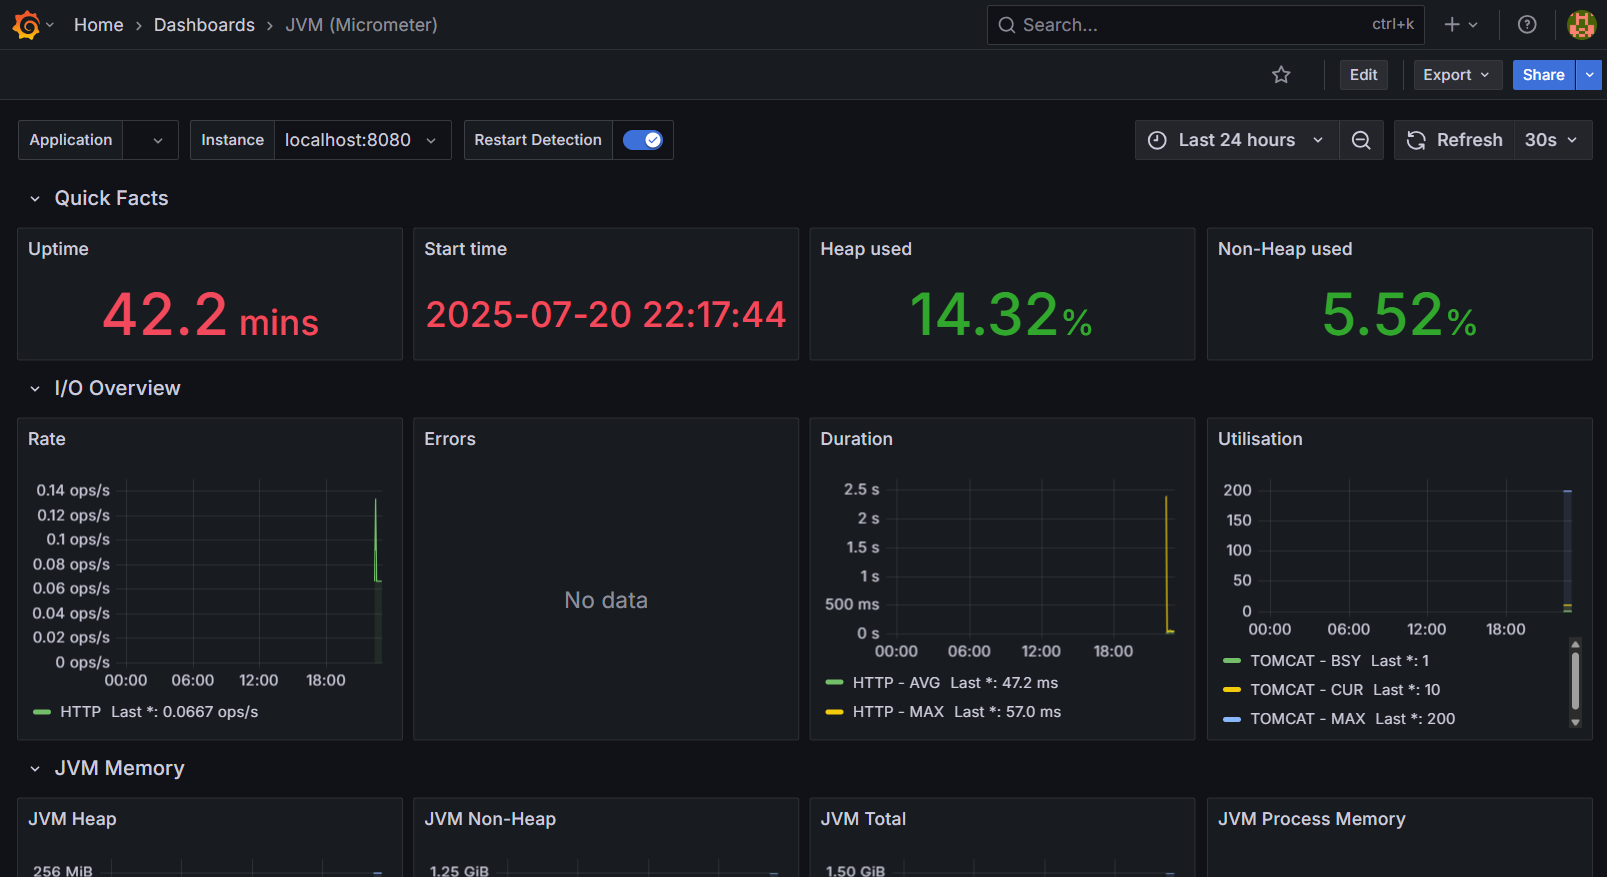
- 그라파나 설치
(그라파나 기본 포트 3000)

씩씩하게 공부중 (22.11~)