참고 +) 클래스 불균형 : Under Sampling & Over Sampling
- 전체 테이터 중에서 Target의 값이 1인 데이터가 매우 적을때 클래스 불균형이 일어남.
- 실무에서는 Accuracy가 낮아지더라도 1에 대한 recall을 높여야 할 경우가 있음
-> 이때 Under Sampling, Over Sampling을 사용
Under Sampling
- imblearn 설치
# imblearn 설치
#!pip install imbalanced-learn- 불러오기 : RandomOverSampler를 사용
# 불러오기
from imblearn.under_sampling import RandomUnderSampler

# Under Sampling
under_sample = RandomUnderSampler()
u_x_train, u_y_train = under_sample.fit_resample(x_train, y_train)

# 확인
print('전:', np.bincount(y_train))
print('후:', np.bincount(u_y_train))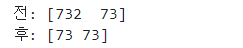
Over Sampling
- 불러오기 : RandomOverSampler 사용
# 불러오기
from imblearn.over_sampling import RandomOverSampler

# Over Sampling
over_sample = RandomOverSampler()
o_x_train, o_y_train = over_sample.fit_resample(x_train, y_train)

# 확인
print('전:', np.bincount(y_train))
print('후:', np.bincount(o_y_train))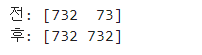
6. 앙상블(Ensemble)
• 통합은 힘이다(Unity is strength)
• 약한 모델이 올바르게 결합하면 더 정확하고 견고한 모델을 얻을 수 있다!
→ 여러 개의 모델을 결합하여 훨씬 강력한 모델을 생성하는 기법
• 캐글(Kaggle)과 같은 많은 기계학습 경쟁에서 상위 순위를 차지하고 있음
- 앙상블 방법
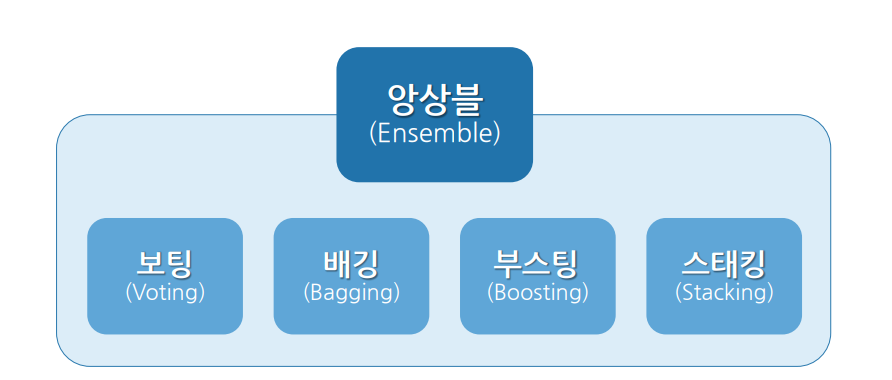
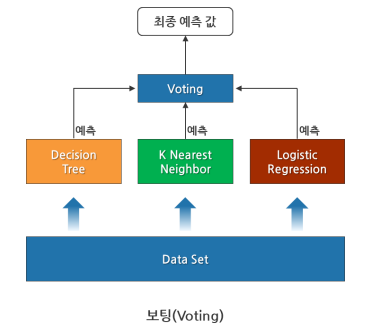
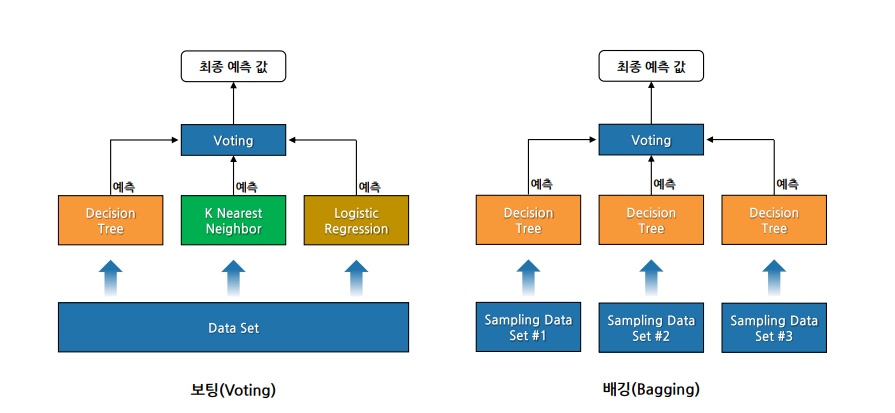
Chapter 2. 보팅(Voting)
여러 모델들(다른 유형의 알고리즘 기반 )의 예측 결과를 투표를 통해 최종 예측 결과를 결정하는 방법
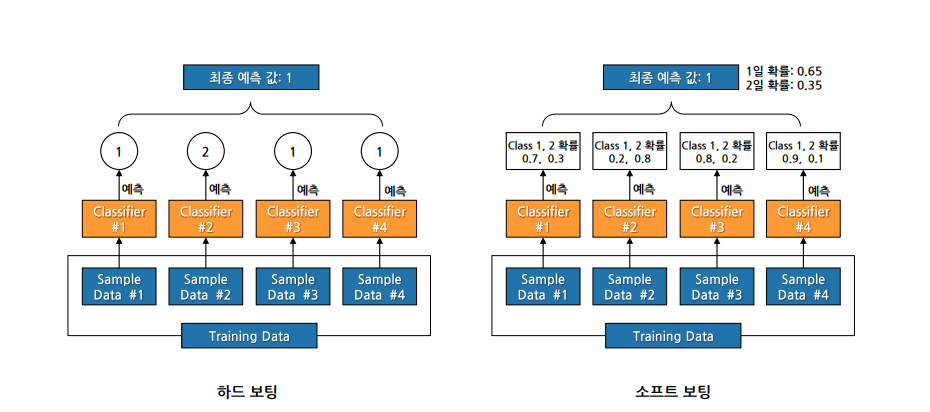
• 하드 보팅: 다수 모델이 예측한 값이 최종 결괏값
• 소프트 보팅: 모든 모델이 예측한 레이블 값의 결정 확률 평균을 구한 뒤 가장 확률이 높은 값을 최종 선택
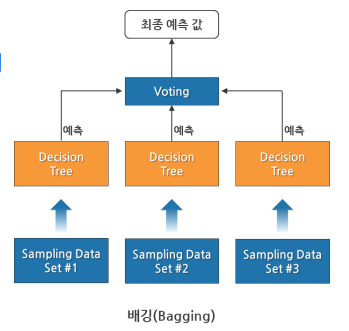
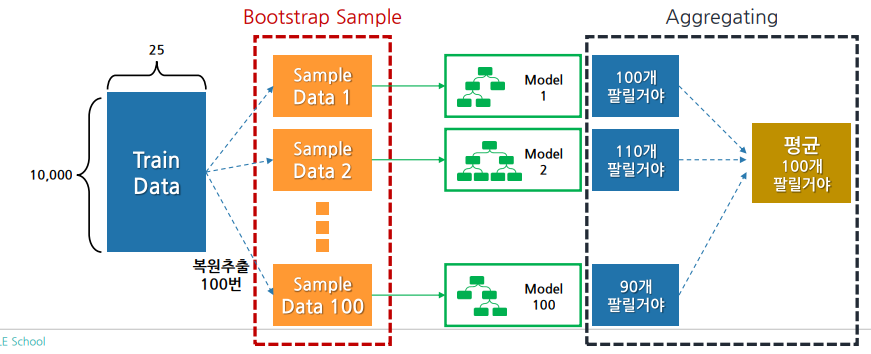
Chapter 3. 배깅(Bagging)
• Bootstrap Aggregating의 약자
• 데이터로부터 부트스트랩 한 데이터로 모델들을 학습시킨 후, 모델들의 예측 결과를 집계해 최종 결과를 얻는 방법
• 같은 유형의 알고리즘 기반 모델들을 사용
• 데이터 분할 시 중복을 허용(복원 랜덤 샘플링 방식이라고 함)
• 범주형 데이터(Categorical Data)는 투표 방식(Voting)으로 결과를 집계
• 연속형 데이터(Continuous Data)는 평균으로 결과를 집계
• 대표적인 배깅 알고리즘: Random Forest
랜덤 포레스트(Random Forest)
배깅(Bagging)의 가장 대표적인 알고리즘
• 여러 Decision Tree 모델이 전체 데이터에서 배깅 방식으로 각자의 데이터 샘플링
• 모델들이 개별적으로 학습을 수행한 뒤 모든 결과를 집계하여 최종 결과 결정
-
랜덤하게 데이터를 샘플링
-
개별 모델이 트리를 구성할 때 분할 기준이 되는 Feature를 랜덤하게 선정
- 무작위로 뽑은 n개의 Feature들 중에서 가장 정보이득이 큰 Feature를 기준으로 트리 분할 → 개별 모델마다 다른 구조의 트리를 구성할 것임
-
나무가 모여 숲을 이루듯 Decision Tree가 여러 개 모여 Forest가 됨
-
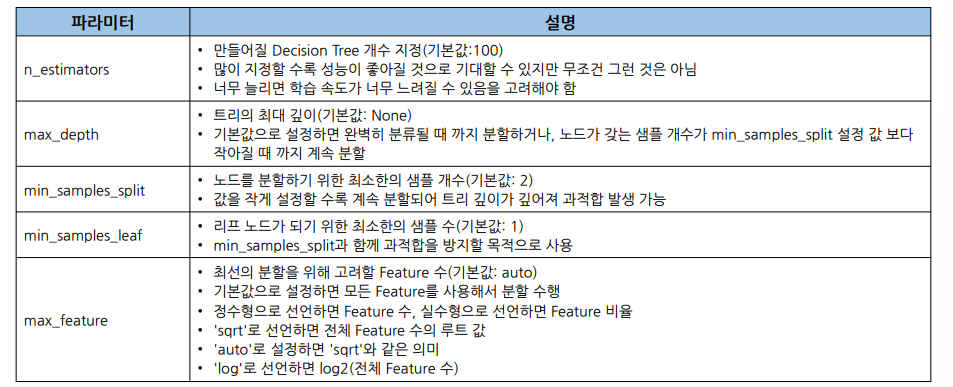
주요 파라미터
Chapter 4. 부스팅(Boosting)
• 같은 유형의 알고리즘 기반 모델 여러 개에 대해 순차적으로 학습을 수행
• 이전 모델이 제대로 예측하지 못한 데이터에 대해서 가중치를 부여하여 다음 모델이 학습과 예측을 진행하는 방법
• 계속하여 모델에게 가중치를 부스팅하며 학습을 진행해 부스팅 방식이라 함
• 예측 성능이 뛰어나 앙상블 학습을 주도함
• 배깅에 비해 성능이 좋지만, 속도가 느리고 과적합 발생 가능성이 있음
→ 상황에 맞게 적절히 사용해야 함
• 대표적인 부스팅 알고리즘: XGBoost, LightGBM
Gradient Boost
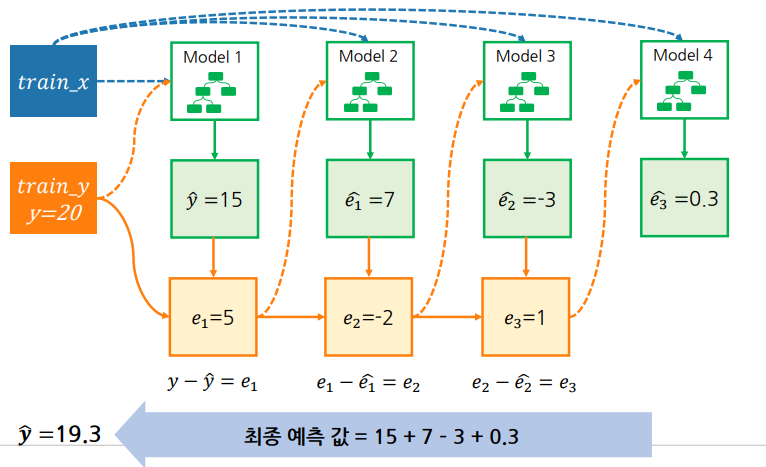
오차를 찾아 오차를 모두 더하면 최종 예측 값이 됨.
XGBoost(eXtreme Gradient Boosting)
부스팅을 구현한 대표적인 알고리즘 중 하나가 GBM(Gradient Boost Machine)
• GBM 알고리즘을 병렬 학습이 가능하도록 구현한 것이 XGBoost
• 회귀, 분류 문제를 모두 지원하며, 성능과 자원 효율이 좋아 많이 사용됨
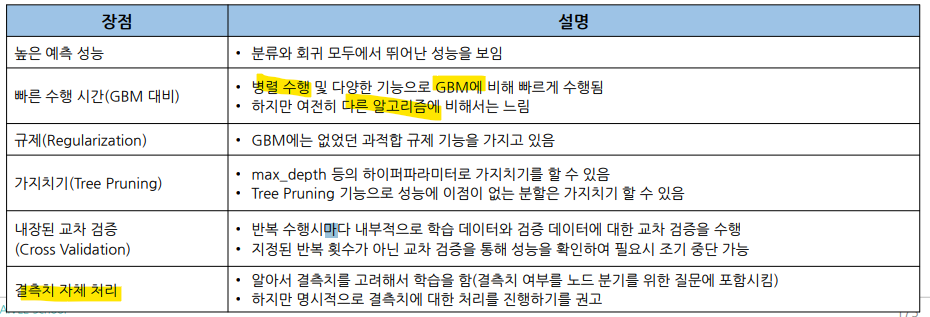
• XGBoost 장점
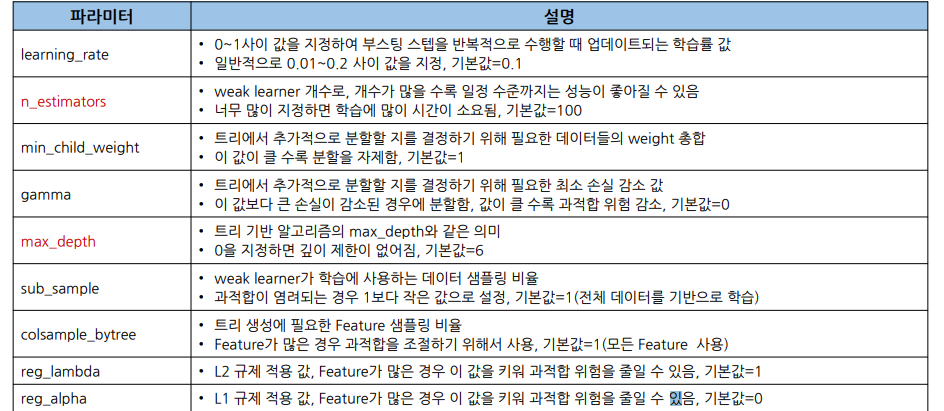
- 하이퍼파라미터
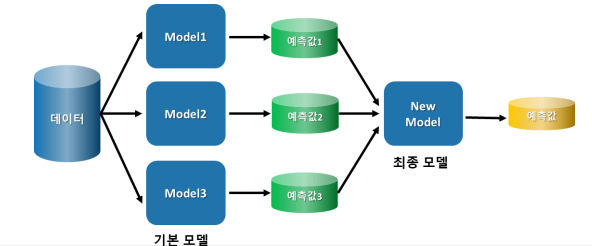
Chapter 5. 스태킹(Stacking)
• 여러 모델의 예측 값을 최종 모델의 학습 데이터로 사용하여 예측하는 방법
• 예를 들면
• KNN, Logistic Regression, XGBoost 모델을 사용해 4종류 예측값을 구한 후
• 이 예측 값을 최종 모델인 Randomforest 학습 데이터로 사용
• 현실 모델에서 많이 사용되지 않으며, 캐글(Kaggle) 같은 미세한 성능 차이로 승부를 결정하는 대회에서 사용됨
• 기본 모델로 4개 이상 선택해야 좋은 결과를 기대할 수 있음
앙상블 실습 : Admission
...
모델링
- xgboost 설치
# xgboost 설치
#!pip install xgboost- xgboost 설치
# lightgbm 설치
!pip install lightgbm- 라이브러리
# 라이브러리 불러오기
from sklearn.neighbors import KNeighborsClassifier
from sklearn.tree import DecisionTreeClassifier
from sklearn.linear_model import LogisticRegression
from sklearn.ensemble import RandomForestClassifier
from xgboost import XGBClassifier
from lightgbm import LGBMClassifier

from sklearn.metrics import *- 1) KNN
# 선언하기
model = KNeighborsClassifier(n_neighbors=5)

# 학습하기
model.fit(x_train_s, y_train)

# 예측하기
y_pred = model.predict(x_test_s)

# 평가하기
print(confusion_matrix(y_test, y_pred))
print(classification_report(y_test, y_pred))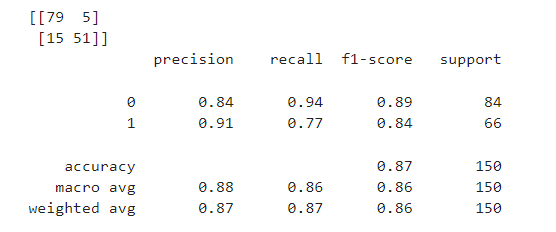
- 2) Decision Tree
# 선언하기
model = DecisionTreeClassifier(max_depth=5, random_state=1)

# 학습하기
model.fit(x_train, y_train)

# 예측하기
y_pred = model.predict(x_test)

# 5단계: 평가하기
print(confusion_matrix(y_test, y_pred))
print(classification_report(y_test, y_pred))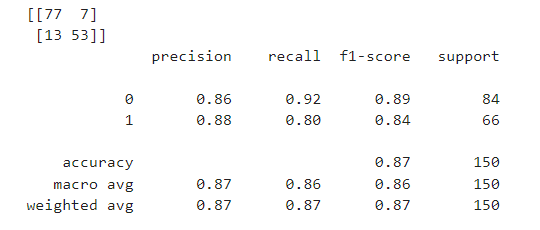
- 3) Logistic Regression
# 선언하기
model = LogisticRegression()

# 학습하기
model.fit(x_train, y_train)

# 예측하기
y_pred = model.predict(x_test)

# 5단계: 평가하기
print(confusion_matrix(y_test, y_pred))
print(classification_report(y_test, y_pred))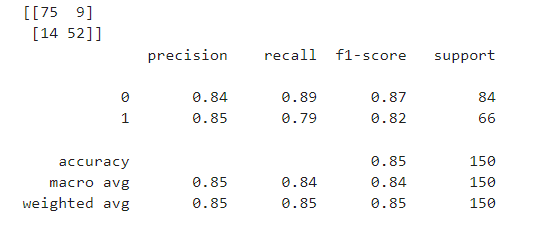
- 4) Random Forest
# 선언하기
model = RandomForestClassifier(max_depth=5)
# 학습하기
model.fit(x_train, y_train)
# 예측하기
y_pred=model.predict(x_test)
# 5단계: 평가하기
print(confusion_matrix(y_test, y_pred))
print(classification_report(y_test, y_pred))
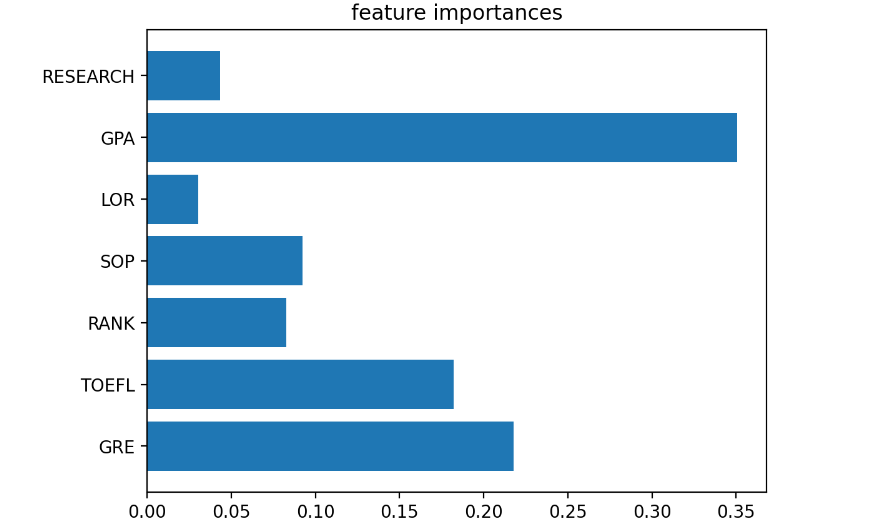
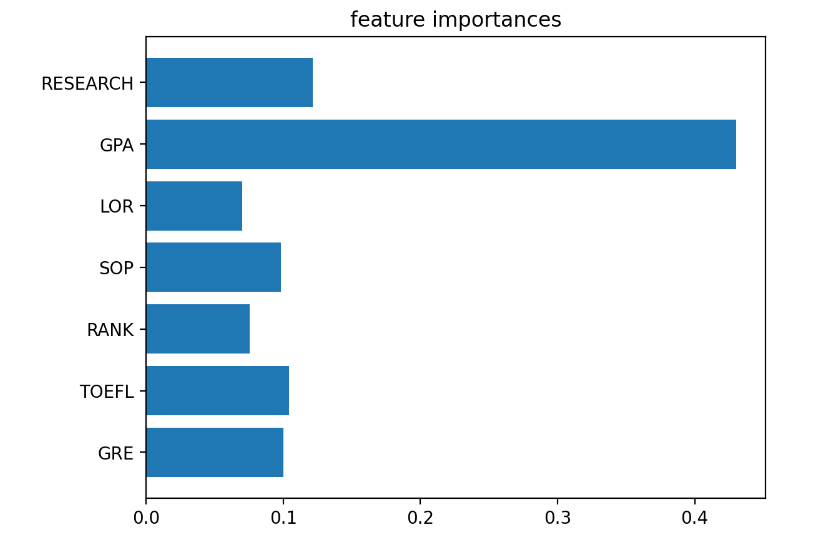
# Feature 중요도 확인
plt.barh(list(x),model.feature_importances_)
plt.title("feature importances")
plt.show()
- 5) XGBoost
# 선언하기
model = XGBClassifier(max_depth=5)

# 학습하기
model.fit(x_train,y_train)

# 예측하기
y_pred = model.predict(x_test)

# 평가하기
print(confusion_matrix(y_test, y_pred))
print(classification_report(y_test, y_pred))

# Feature 중요도 확인
plt.barh(list(x),model.feature_importances_)
plt.title("feature importances")
plt.show()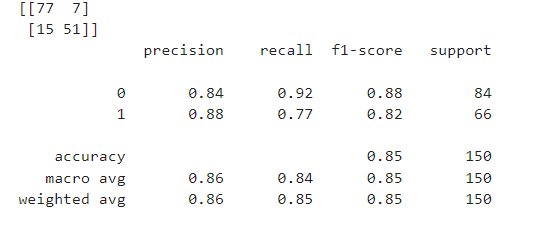
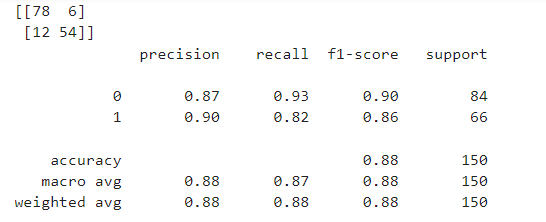
- 6) LightGBM
# 선언하기 (verbose: 피팅과정 보이기 생략)
model = LGBMClassifier(max_depth=5 , verbose=-1,importance_type='gain' )
# 학습하기
model.fit(x_train, y_train)
# 예측하기
y_pred=model.predict(x_test)
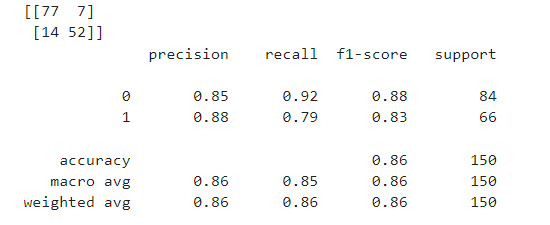
# 평가하기
print(confusion_matrix(y_test, y_pred))
print(classification_report(y_test, y_pred))
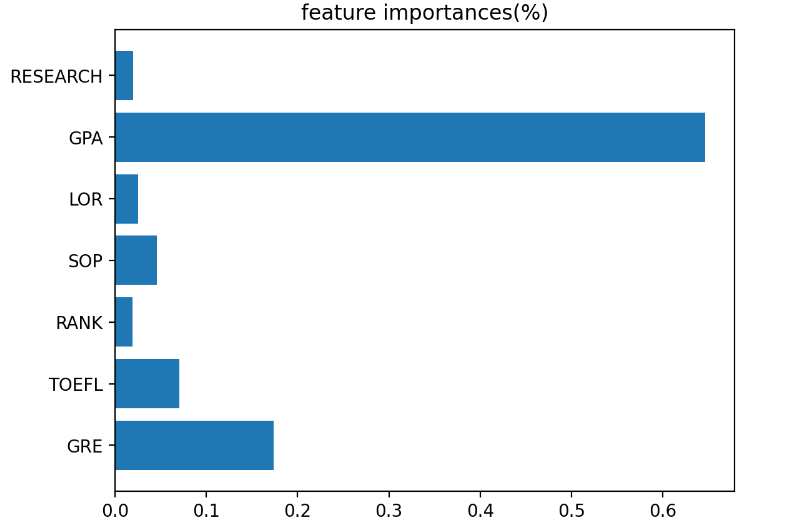
# Feature 중요도 확인
tmp=model.feature_importances_
tmp2=tmp/np.sum(tmp)
plt.barh(list(x),tmp2)
plt.title("feature importances(%)")
plt.show()