SC21x
3D plotly
!pip install plotly==4.* #설치(DAY22에도 있음)import plotly.express as px px.scatter_3d( homes, x='GrLivArea', y='HouseStyle', z='SalePrice', title='House Prices' )pairplot
sns.set(style='whitegrid', context='notebook')
cols = ['feature1', 'feature2','feature3']
sns.pairplot(df[cols], height=2);
- 데이터셋을 통째로 넣으면 숫자형 특성에 대하여 각각에 대한 히스토그램과 두 변수 사이의 scatter plot을 그린다
- 데이터를 한눈에 보기 쉬워서 애용
- 다른 기능이나 유연성이 더 필요하다면 pairgrid를 사용
출처Strip Plot
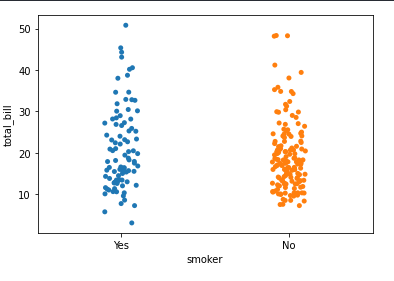
sns.stripplot(y = homes['feature1'], x = homes['feature2'])
- 연속형 변수와 범주형 변수 사이의 그래프
- 산점도(scatter plot)로 표시되는데, 범주형 변수의 인코딩을 추가로 사용한다.
출처보기 편하게 회귀계수
coefficients=pd.Series(model.coef_, X_train.columns)
coefficients
데이터셋에서 numeric column만 있는 데이터 프레임 출력하기
df._get_numeric_data()
N213
가장 score가 좋은 colmns 뽑아내기
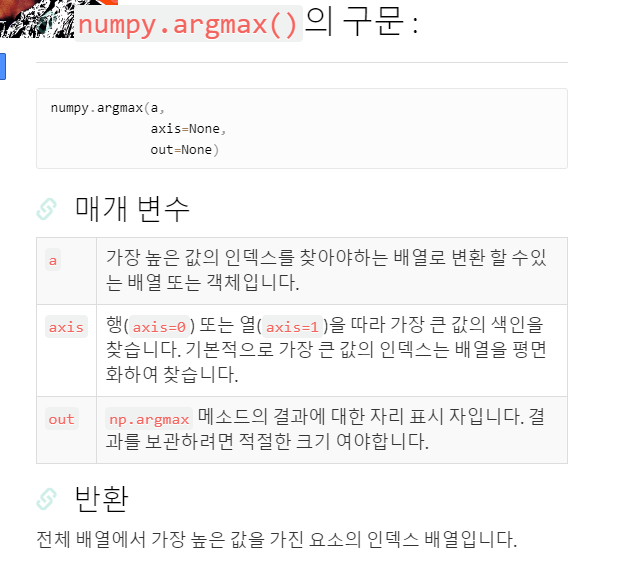
selector = SelectKBest(score_func=f_regression, k=20)# selctor에서 점수 추출 (배열) score = selector.scores_ # 가장 높은 점수의 인덱스 번호 추출 best_score_index = np.argmax(score) # 0 # 학습 데이터셋 컬럼에서 인덱스번호에 해당하는 컬럼 이름 확인 all_names[best_score_index] # all_names[0]
더 알아봐야 할것
- test, train,val 갯수 정하기
- 블로그에 있는 시각화 관련 사이트 및 블로그 보기


