DAY 30
시계열 데이터 train/test
- train set: 가장 오래된 데이터
- val set: 그 다음 최근 데이터
- test set: 가장 최근 데이터
# str을 시계열 데이터로 비끄기
pd.to_datetime(df['game_date'])
# test/val 나누기
train= df.loc[df.game_date <'2014-01-01',:]
test= df.loc[df.game_date >='2014-01-01',:]
timedelta object 에서 Day 부분 지우기
>>>df['Seconds remaining in the period']= pd.to_timedelta(df['Seconds remaining in the period'], unit='s')
-----------------------------------------------------------
0 days 00:00:42

>>>>df['Seconds remaining in the period'] = df['Seconds remaining in the period'].astype(str).map(lambda x: x[7:])
---------------------------------------------------------------
00:00:42DAY 35
count plot
: 카테고리 값별로 데이터가 얼마나 있는지 표시
import seaborn as sns

sns.countplot(x=train['Inspection Fail']);pie plot
plt.subplots(figsize = (5,5))
plt.pie(train['feature'].value_counts(), labels = train['feature'].value_counts().index,
        autopct="%.1f%%", shadow = True, startangle = 90)
plt.title('제목뭐로하지', size=20)
plt.show()
Cardinality 줄이기
- 'feature' upper case > value_counts TOP10 이외는 etc로 처리
df["feature"] = df["feature"].str.upper()
facility_top10 = df["feature"].value_counts().sort_values(ascending=False).head(10).index.to_list()
df["feature"] = [i if i in facility_top10 else "ETC" for i in df['feature']]- 'Violations' 결측치 0으로 보완 > "|"으로 Split > len()을 사용하여 위반사항 "개수"로 변환
df["Violations"].fillna(0, inplace=True)
df["Violations"] = [0 if i == 0 else len(i.split("| ")) for i in df["Violations"]]- MCDONALD, MC DONALD'S, MC DONALDS 포함된 변수들을 MCDONALDS로 바꾸기
df["Name"] = df["DBA Name"].str.upper()
macdonald = set(df_temp["Name"][df_temp["Name"].str.contains("MCDONALD|MC DONALD'S|MC DONALDS")].values)
df.replace(macdonald, 'MCDONALDS', inplace=True)
str.contain()
str.contain()-여러개
연도, 월 추출
df["Date"] = df['Date'].apply(pd.to_datetime)
df["year"] = df["Date"].dt.year
df["month"] = df["Date"].dt.month
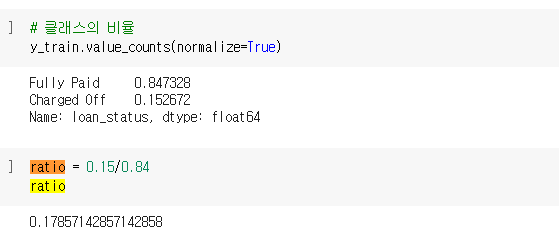
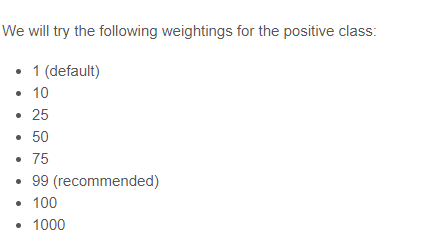
scale_pos_weight

model = XGBClassifier(n_estimators=1000, verbosity=0, n_jobs=-1, scale_pos_weight=ratio)

