model-agnostic
: 학습에 사용된 model이 무엇인지에 구애받지 않고 독립적으로 모델을 해석할 수 있다는 의미
- 학습에 사용되는 모델과 설명에 사용되는 모델을 분리하겠다는 것
- PDP, ShapV
- model-agnostic 방법 외에 많이 사용하는 방법
- 해석가능한 모델(ex.선형회귀)
- model-specific한 해석방법(ex.랜덤포레스트의 feature importance)를 활용
출처
Feature Importances,PDP, SHAP의 특징
서로 관련이 있는 모든 특성들에 대한 전역적인(Global) 설명
- Feature Importances
- Drop-Column Importances
- Permutaton Importances
타겟과 관련이 있는 개별 특성들에 대한 전역적인 설명
- Partial Dependence plots
개별 관측치에 대한 지역적인(local) 설명
- Shapley Values
앞으로 우린 예측모델의 결과를 해석하는 PDP, ShapV에 대해서 이야기 하겠다
pip 설치
!pip install pdpbox!pip install shapPartial Dependence Plots(PDP): 1 특성
: 관심있는 특성들이 타겟에 어떻게 영향을 주는지 쉽게 파악
- 장점: 종속 변수와 관심 있는 독립 변수의 관계가 선형인지, 단조적인지, 복잡한지(고차) 다양한 형태의 관계를 볼 수 있다는 것
from pdpbox.pdp import pdp_isolate, pdp_plot

feature = 'annual_inc'
isolated = pdp_isolate(
model=boosting,
dataset=X_val_encoded,
model_features=X_val_encoded.columns,
feature=feature,
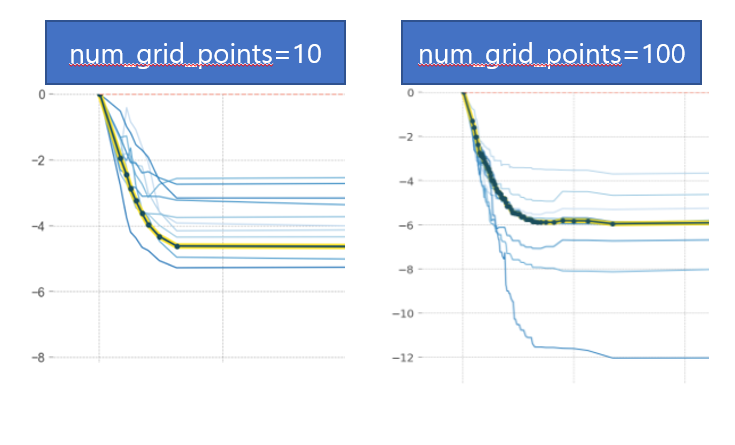
# grid point를 크게 주면 겹치는 점이 생겨 Number of unique grid points는 grid point 보다 작을 수 있습니다.
#num_grid_points=100
)
pdp_plot(isolated, feature_name=feature);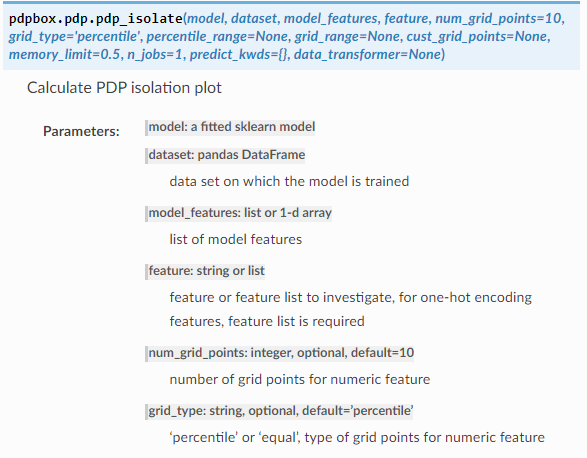
num_grid_points
ICE 곡선(Individual Conditional Expectation Curves)
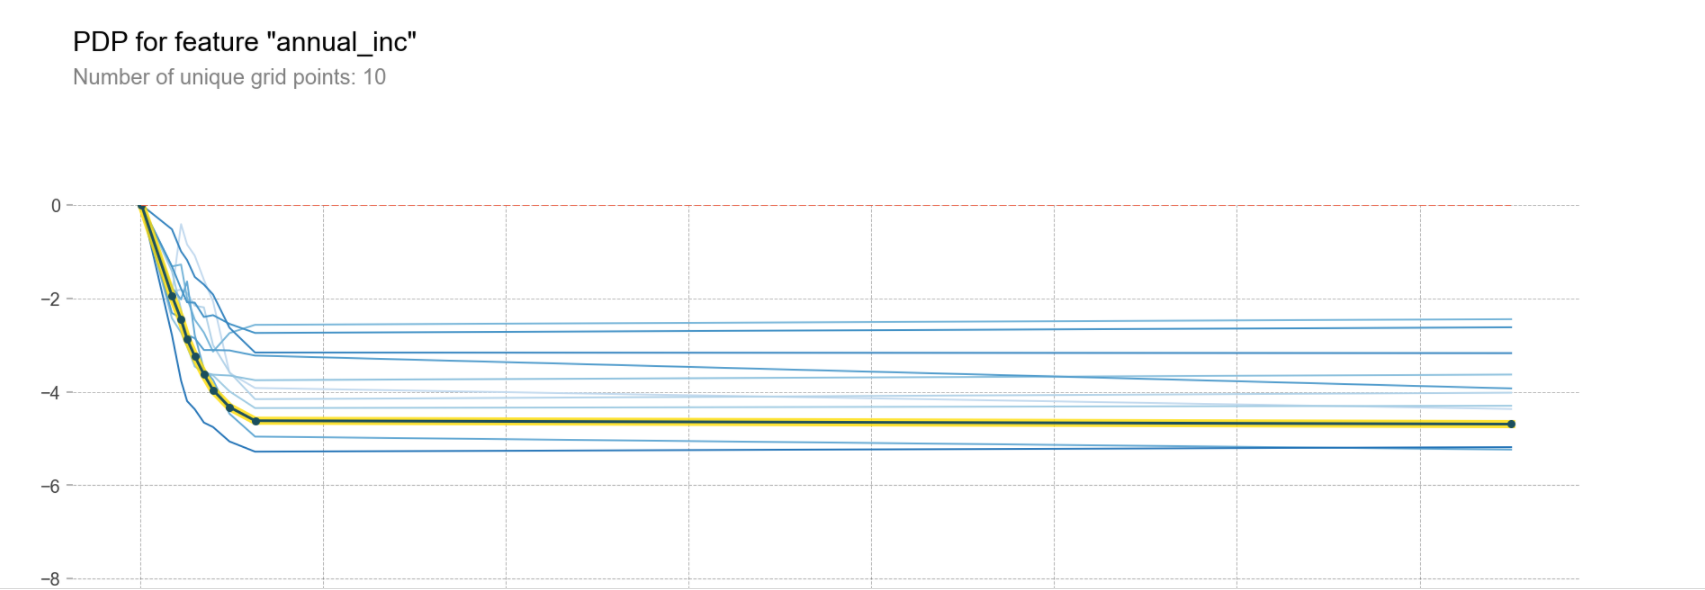
- ICE 곡선은 하나의 관측치에 대해 관심 특성을 변화시킴에 따른 타겟값 변화 곡선(파란색)
- ICE들의 평균이 PDP(노란색 곡선)
pdp_plot(isolated
         , feature_name=feature
         , plot_lines=True # ICE plots
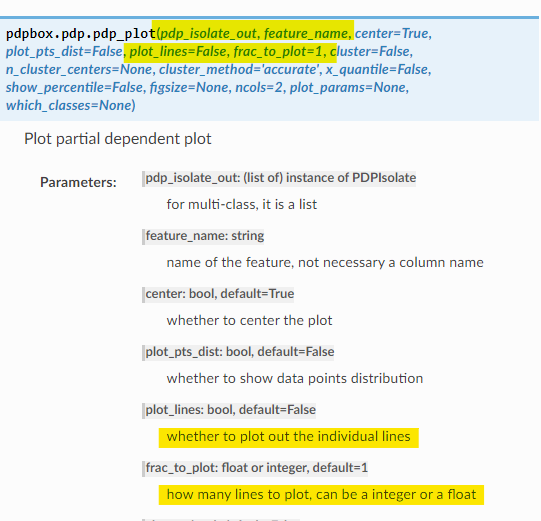
         , frac_to_plot=0.001 # or 10 (# 10000 val set * 0.001)# ICE곡선의 갯수(비율로)
         , plot_pts_dist=True)

plt.xlim(20000,150000);PDP: 두 특성 간의 상호작용(2 특성)
from pdpbox.pdp import pdp_interact, pdp_interact_plot

features = ['annual_inc', 'fico_range_high']

interaction = pdp_interact(
    model=boosting,
    dataset=X_val_encoded,
    model_features=X_val.columns,
    features=features
)
# 시각화
pdp_interact_plot(interaction, plot_type='grid',
feature_names=features);
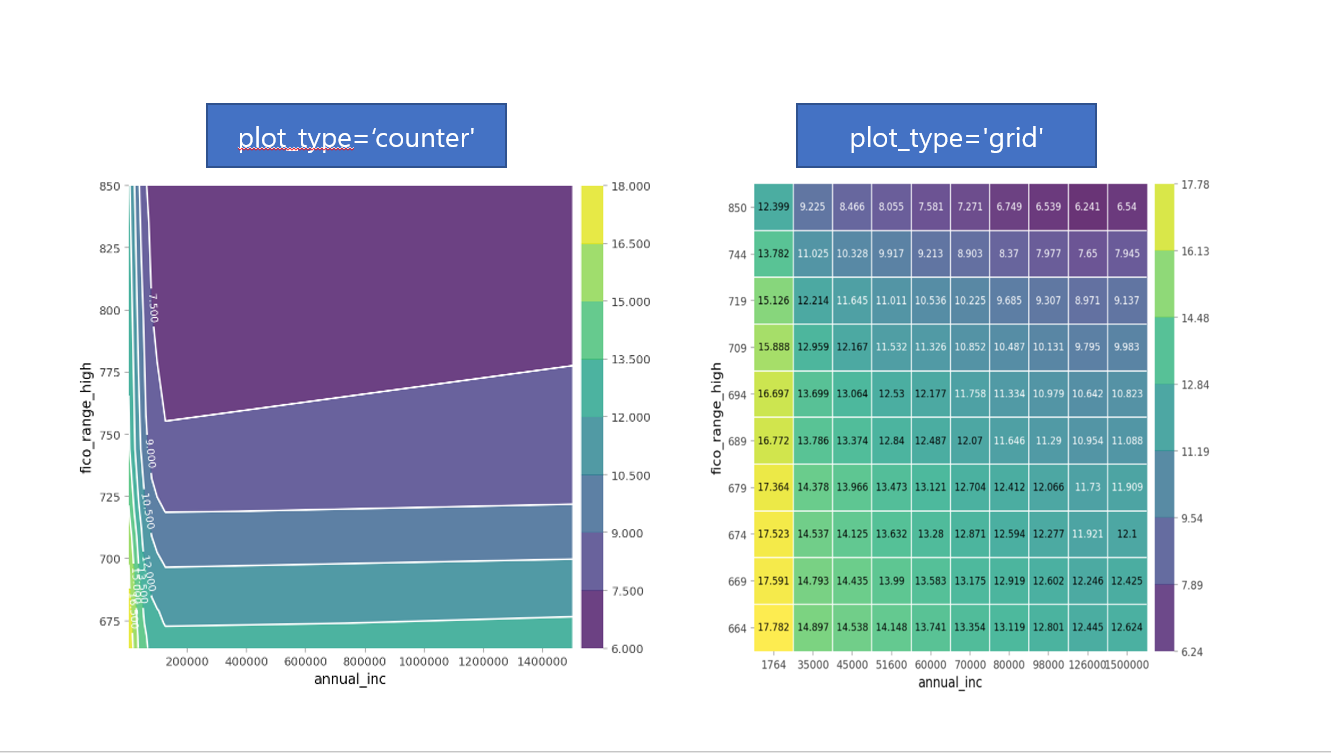
PDP를 Plotly를 사용하여 3D로 출력 가능(N234)
PDP: 카테고리특성 사용
PDP: 카테고리특성 사용(1특성)
import matplotlib.pyplot as plt
from pdpbox import pdp
feature = 'sex'
pdp_dist = pdp.pdp_isolate(model=rf dataset=X_encoded, model_features=features, feature=feature)
pdp.pdp_plot(pdp_dist, feature); # 인코딩된 sex 값을 확인할 수 있습니다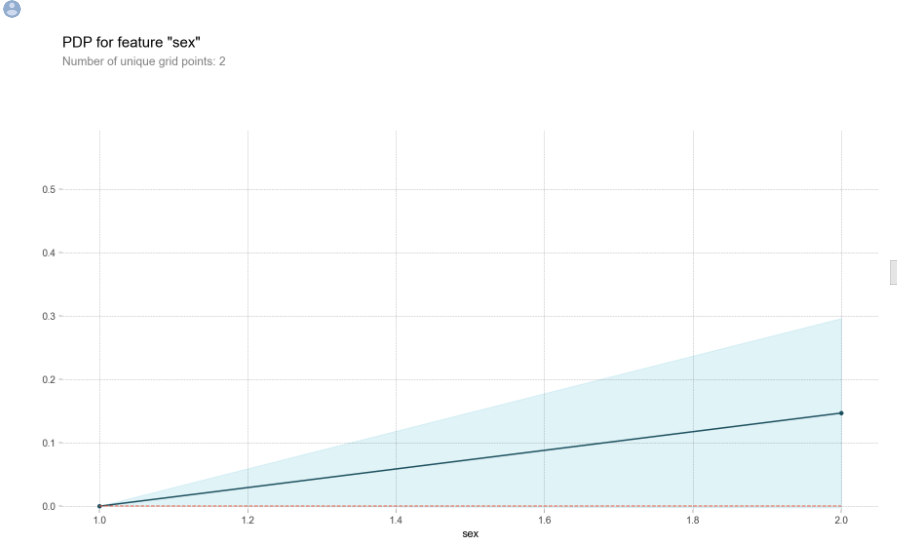
- male(x축0)에서 female(x축1)로 갈 때 0.3만큼 target이 1이 될 확률(생존할 확률)이 증가한다.
# encoder 맵핑을 확인합니다, {male:1, female:2} 로 인코딩 되어 있습니다
encoder.mappingpdp.pdp_plot(pdp_dist, feature)
# xticks labels 설정을 인코딩된 코드리스트와, 카테고리 값 리스트를 넣어 수동으로 해보겠습니다.
plt.xticks([1, 2], ['male', 'female',]);
#y는 생존의 예측 값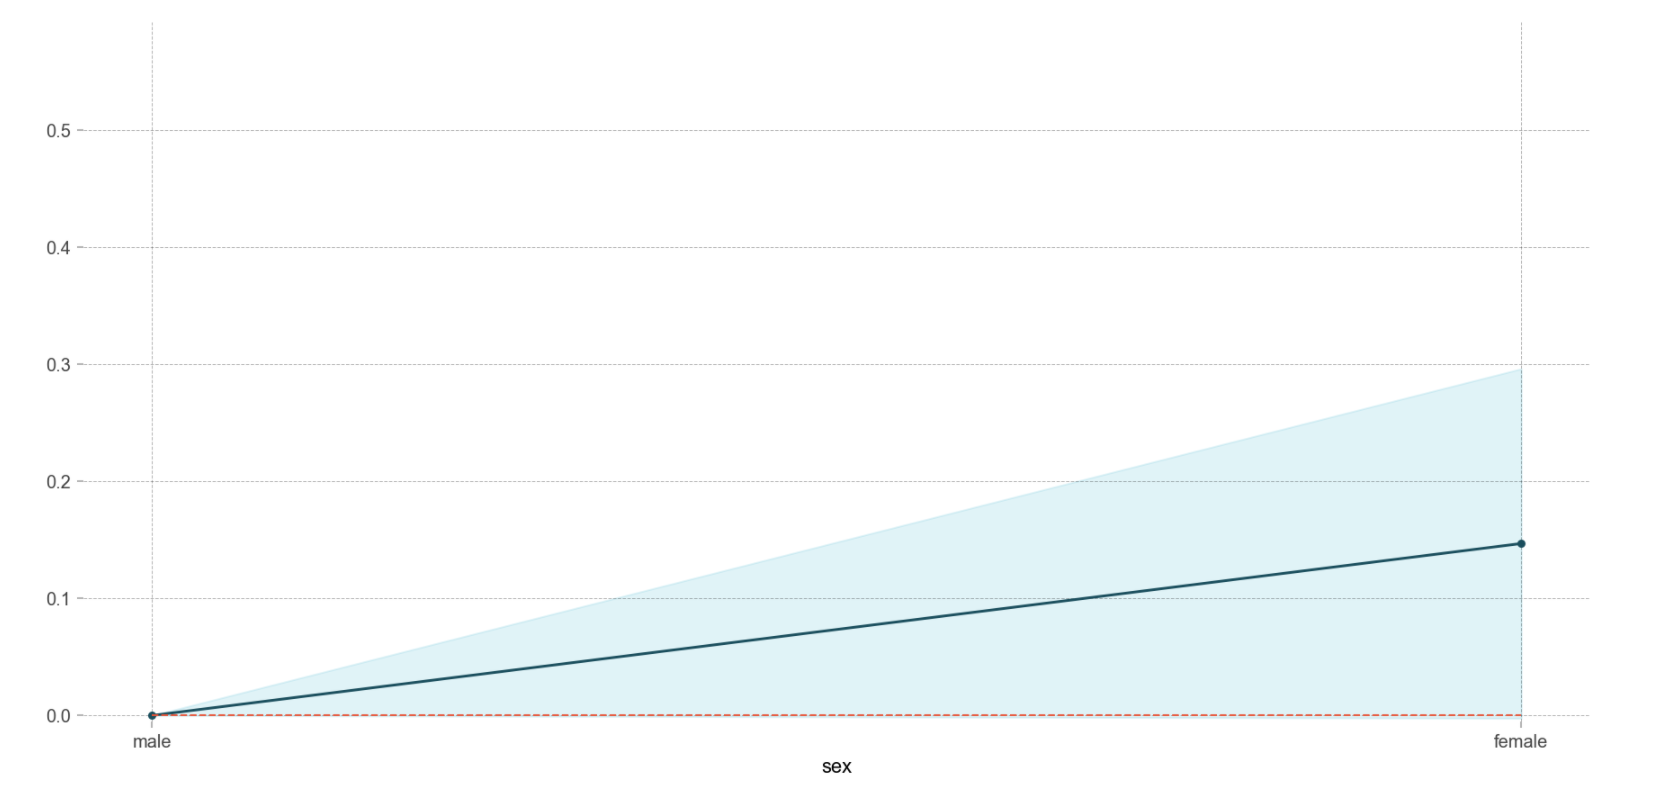
PDP: 카테고리특성 사용(2특성)
features = ['sex', 'age']

interaction = pdp_interact(
    model=rf,
    dataset=X_encoded,
    model_features=X_encoded.columns,
    features=features
)

pdp_interact_plot(interaction, plot_type='grid', feature_names=features);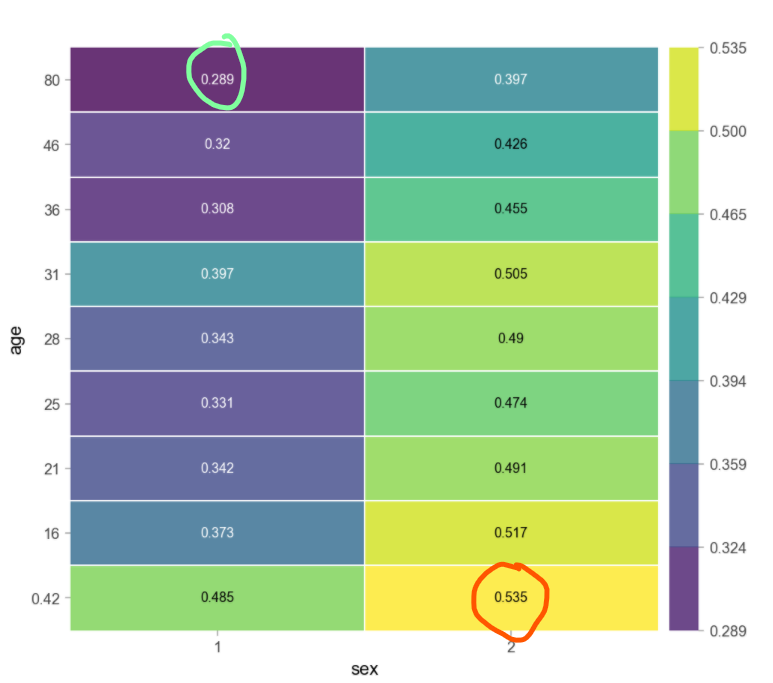
- 안에 있는 값 자체는 예측값이다!!
- 나이가 어리고 여자인 사람은 살 확률이 높고, 반면에 나이가 많고 남자인 사람은 살 확률이 적다
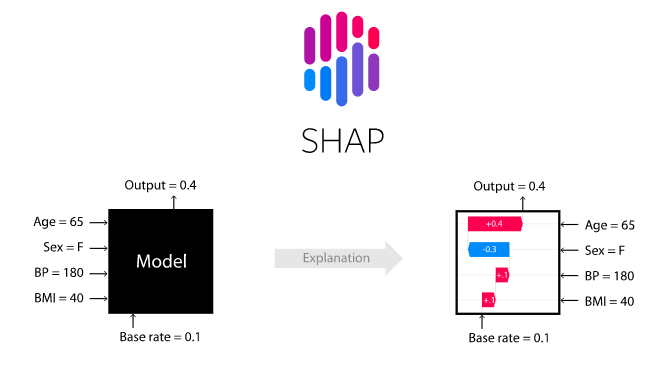
SHAP value
:특성들의 기여도(feature attribution)를 계산하기 위한 방법
force_plot
: 변수들의 영향력을 그래프로 표현하는 것
- 파란색(lower)은 안좋은 영향을 끼쳤음을 의미
- 빨간색(higher)은 좋은 영향을 끼쳤음을 의미
force_plot: 한 샘플(local)에 대한 shape_value
row = X_test.iloc[[1]]
rowy_test.iloc[[1]]# 실제 값: 323000.0
model.predict(row) # 예측값:341878.50142523import shap
explainer = shap.TreeExplainer(model) # 트리모델 shape value 계산 객체 지정
shap_values = explainer.shap_values(row) # Shap value 계산
shap_values
-------------------------------------------------------------
array([[ -26522.39096789, 33507.9223697 , -1347.04735052,
-189024.90759352]]shap.initjs() # 자바스크립트 초기화
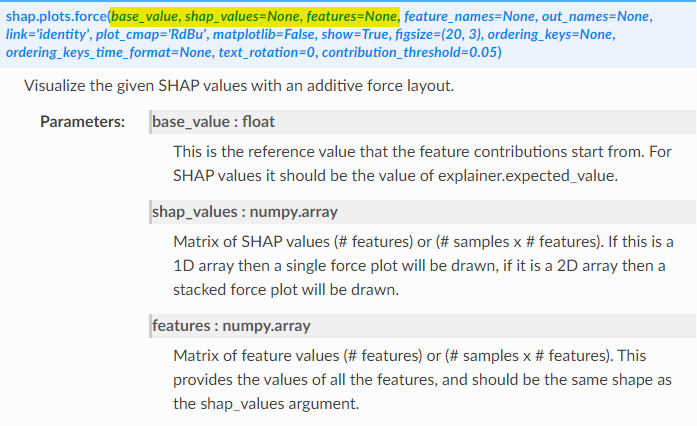
shap.force_plot(
base_value=explainer.expected_value,
shap_values=shap_values,
features=row
)

- 평균값이 기준값으로 정해져있고, 평균값보다 낮은 이유는 위치,룸이 영향을 끼쳤다
force_plot: X_testd의 Shap_value
shap.initjs()
shap_values = explainer.shap_values(X_test.iloc[:100])
shap.force_plot(explainer.expected_value, shap_values, X_test.iloc[:100])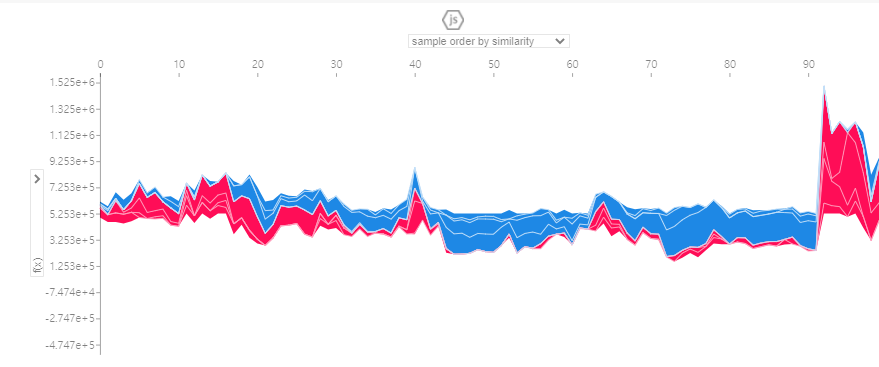
summary_plot
- 특성 중요도(feature importance)와 특성 효과(feature effects)를 결합
shap_values = explainer.shap_values(X_test)
shap.summary_plot(shap_values, X_test)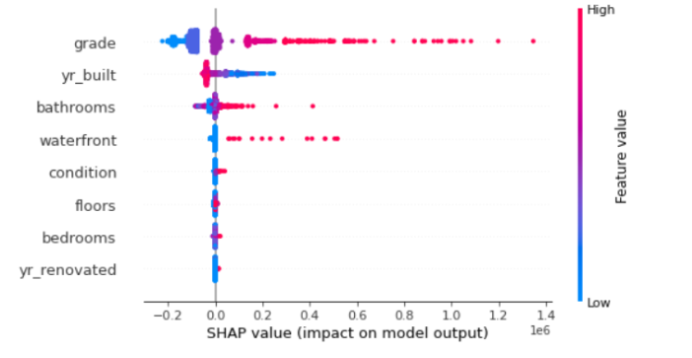
- grade : 변수의 값이 높을수록, 예상 가격이 높은 경향성이 있다.
- yr_built : 변수의 값이 낮을수록, 예상 가격이 높은 경향성이 있다.( 옛날 집일수록 집값 높음)
- bathrooms : 변수의 값이 높을수록, 예상 가격이 높은 경향성이 있다.
- bedrooms : 변수의 값이 높을수록, 예상 가격이 높은 경향성이 있다.
- condition : 변수의 값이 높을수록, 예상 가격이 높은 경향성이 있다.
- waterfront : 변수의 값이 높을수록, 예상 가격이 높은 경향성이 있다.
- floors : 해석이 모호하다. (빨간색 값이 왼쪽,오른쪽 다있음)
- yr_renovated : 해석이 모호하다. (빨간색 값이 왼쪽,오른쪽 다있음)
shap.summary_plot(shap_values, X_test.iloc[:300], plot_type="violin")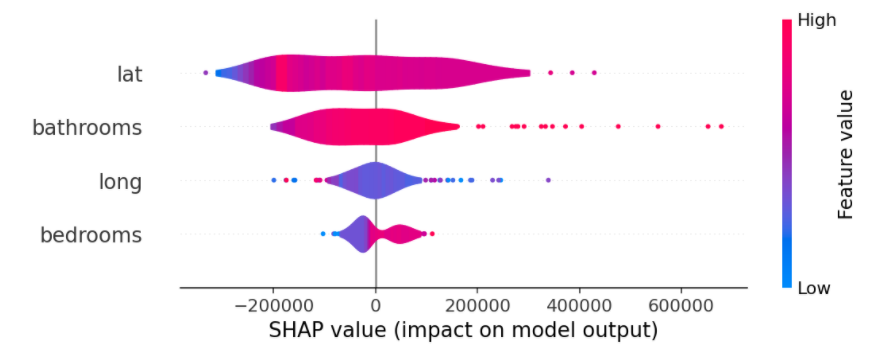
영향력의 고저를 판단하는 기준
- 폭을 넓을수록 영향력이 높다
- 색의 농도가 영향력을 많이 준것
- shap value의 기준점인 0 위에가 positive effect이고 0아래가 negative로 주는 것이고 색은 그 영향을 주는 정도를 표시
shap.summary_plot(shap_values, X_test, plot_type="bar")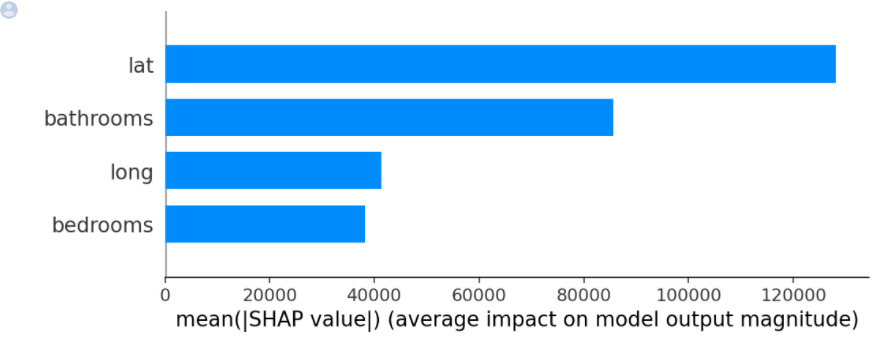
가장 영향력이 큰 특성:lat
