Pandas
- 2차원 데이터를 가장 쉽게 다룰 수 있음
- 데이터 처리를 위한 라이브러리
- 시계열 데이터에 최적화
Pandas 구성요소
DataFrame
- 2차원 데이터 셋
- Column 과 Rows 로 구성
Series
- 1차원 데이터 셋
- 1개의 컬럼(Column)으로만 구성
- 컬럼명이 없음
- 컬럼값으로만 구성
Index
- DataFrame, Serise의 고유한 Key값 객체
DataFrame의 생성
- dict를 변환
dic1 = {'Name': ['Chulmin', 'Eunkyung','Jinwoong','Soobeom'],
        'Year': [2011, 2016, 2015, 2015],
        'Gender': ['Male', 'Female', 'Male', 'Male']
       }
print(type(dic1))

# 딕셔너리를 DataFrame으로 변환
data_df = pd.DataFrame(dic1)
print(data_df)
print(type(data_df))
인덱스와 컬럼명 출력 및 확인
print("columns:",titanic_df.columns)    # 컬럼명 출력

print("index:",titanic_df.index)    # 객체가 반환, RangeIndex(start=0, stop=891, step=1)
print("index value:", titanic_df.index.values)    # 인덱스의 값을 출력
컬럼 추가
# 새로운 컬럼명을 추가
data_df = pd.DataFrame(dic1, columns=["Name", "Year", "Gender", "Age"])
print(data_df)
index값 변경
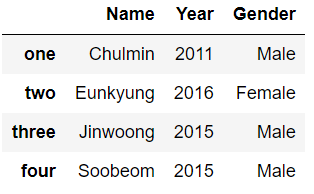
# 인덱스를 새로운 값으로 할당.
data_df = pd.DataFrame(dic1, index=['one','two','three','four'])
print(data_df)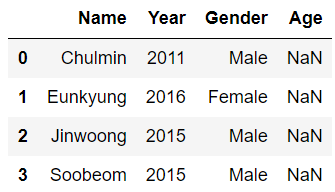
Pandas 기본API
read_csv()
- csv 파일을 편리하게 DataFrame으로 로딩
- sep 인자를 콤마(,)가 아닌 다른 분리자로 변경하여 다른 유형의 파일도 로드 가능
import pandas as pd

titanic_df = pd.read_csv('titanic_train.csv')
print('titanic 변수 type:',type(titanic_df))- tab으로 분리된 파일을 로드할 경우
titanic_df = pd.read_csv('titanic_train.tsv', sep='\t')
print('titanic 변수 type:',type(titanic_df))
head()
- DataFrame의 맨 앞 일부 데이터만 추출
- default로는 앞의 5줄만 출력
- head(10) : 앞의 10줄만 출력
titanic_df.head(3)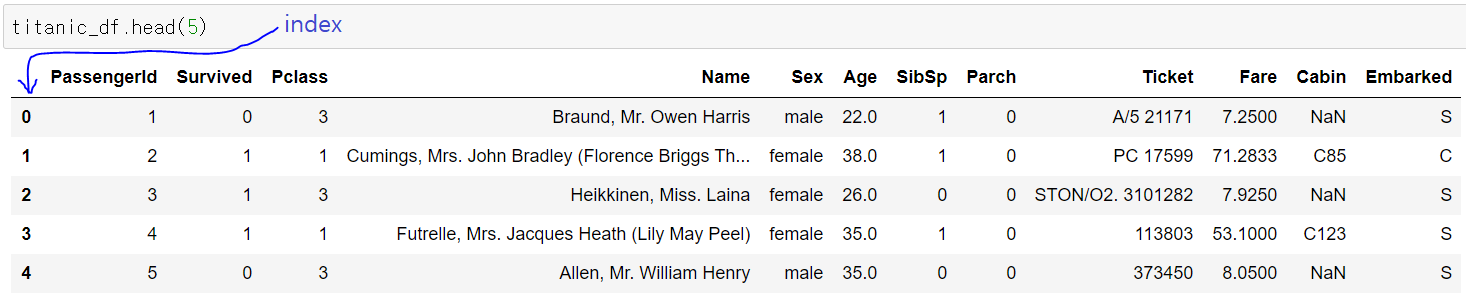
- Pandas의 DataFrame은 NumPy의 ndarray로 만들어짐
- 컬럼값, index, value 모두 ndarray로 구성됨
shape()
- DataFrame의 행(Row)와 열(Column) 크기를 가지고 있는 속성
- index는 포함되지 않음
print('DataFrame 크기: ', titanic_df.shape) # (891, 12)info()
- DataFrame 내의 컬럼명, 데이터 타입, Null건수, 데이터 건수 정보를 제공
titanic_df.info()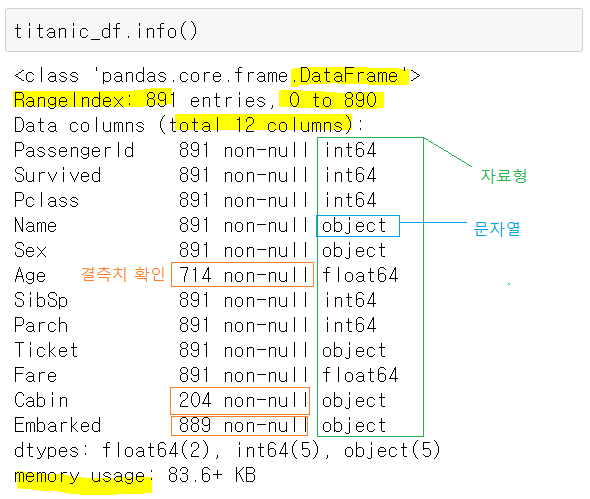
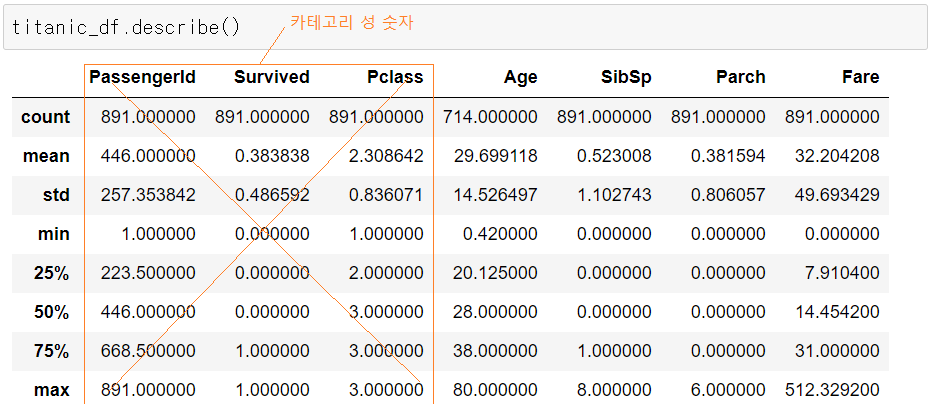
describe()
- 데이터값들의 평균,표준편차,4분위 분포도를 제공
- 숫자형 컬럼들에 대해서만 해당 정보를 제공
titanic_df.describe()- count : 개수
- mean : 평균
- std : 표준편차
- min : 최소값
- 25, 50, 75% :
- max : 최대값
value_counts()
- 동일한 개별 데이터 값이 몇건이 있는지 정보를 제공
- 개별 데이터값의 분포도를 제공
- 히스토그램에 사용 시 유용
- Series객체에서만 호출
- DataFrame을 단일 컬럼으로 입력하여 Series로 변환한 뒤 호출
value_counts = titanic_df['Pclass'].value_counts()
print(type(value_counts))
print(value_counts)
sort_values()
- by='정렬할 기준의 컬럼명'
- ascending=True(오름차순) 또는 False(내림차순)
- 여러개의 컬럼을 정렬하려면 by에 리스트의 형태로 컬럼을 전달
titanic_df.sort_values(by='Pclass', ascending=True)

titanic_df[['Name','Age']].sort_values(by='Age')
titanic_df[['Name','Age','Pclass']].sort_values(by=['Pclass','Age'])
DataFrame에서 Series추출
# DataFrame객체에서 []연산자내에 한개의 컬럼만 입력하면 Series 객체를 반환
series = titanic_df['Name']
print(series.head(3))
print("type:", type(series))
DataFrame에서 원하는 컬럼(column)만 추출
# DataFrame객체에서 []연산자내에 여러개의 컬럼을 리스트로 입력하면
# 그 컬럼들로 구성된 DataFrame 반환
filtered_df = titanic_df[['Name', 'Age']]
print(filtered_df.head(3))
print("type:", type(filtered_df))

# DataFrame객체에서 []연산자내에 한개의 컬럼을 리스트로 입력하면
# 한개의 컬럼으로 구성된 DataFrame 반환
one_col_df = titanic_df[['Name']]
print(one_col_df.head(3))
print("type:", type(one_col_df))
Record Everything!!