캐글의 산탄데르 고객 만족 데이터셋에 대해 LigthGBM과 XGBoost를 활용하여 예측한다. feature은 총 370개, 클래스 레이블 명은 TARGET이고, 이때 해당 값이 1이면 불만을 가진 고객, 0이면 만족한 고객을 의미한다.
이때, 불균형 데이터셋이므로 모델 성능 평가는 정확도가 아닌 roc-auc로 진행한다.
ch4.9 Data
데이터셋은 여기 https://www.kaggle.com/c/santander-customer-satisfaction 에서 다운받을 수 있다.
- 데이터 로드
import numpy as np
import pandas as pd
import matplotlib.pyplot as plt
import matplotlib
cust_df = pd.read_csv("/content/drive/MyDrive/파이썬 머신러닝 완벽 가이드/data/santander-customer-satisfaction/train.csv", encoding='latin-1')cust_df.shape- 데이터 확인
- 370개의 feature, 1개의 class 열로 구성된 dataframe
- 260개의 정수형 feature, 111개의 실수형 feature로 구성됨
- 결측값은 없음
cust_df.info()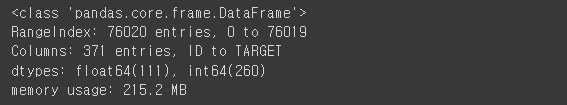
## 각 피처의 분포 확인
cust_df.describe()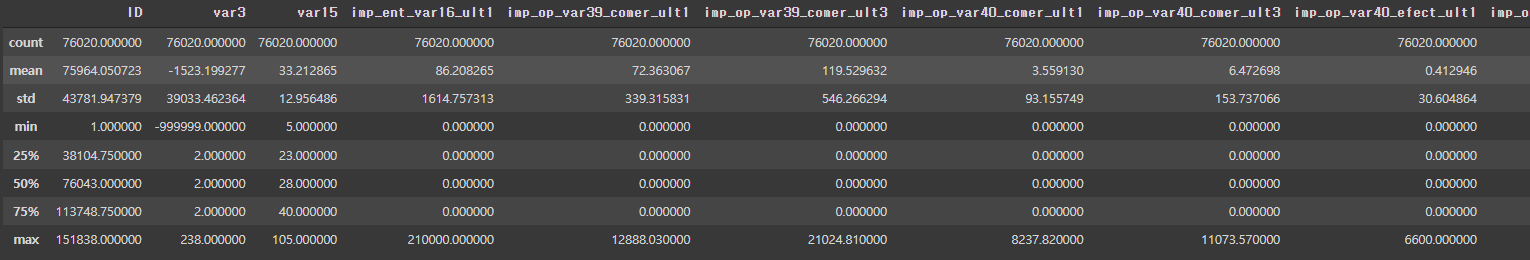
위 결과를 살펴보면, var3의 경우 min 값이 -999999이다. 해당 값은 NaN 또는 이상치 값에 해당되므로 가장 값이 많은 2로 변환할 예정이다. (아래 전처리 정리 내용 참고)
ch4.9 Preprocessing
- feature var3 의 이상치 부분 확인
## var3의 -999999 값 => 116개 은 결측값 혹은 이상치에 해당함
## 해당 값을 가장 값이 많은 2로 변환함
cust_df['var3'].value_counts()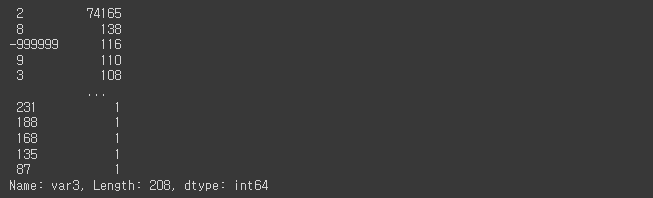
- 해당 값을 값이 가장 많은 2로 변환
## -999999 => 2
cust_df['var3'].replace(-99999, 2, inplace=True)- feature ID 는 단순 식별자에 해당하므로 드롭
## ID 열은 단순 식별자에 해당하므로 드롭
cust_df.drop('ID', axis=1, inplace=True)
- feature 과 class 분리
## feature과 class 분리
X_features = cust_df.iloc[:, :-1]
y_labels = cust_df.iloc[:, -1]- train, val, test 으로 데이터셋 분리 (불균형 데이터셋임을 고려하여 비슷한 비율로 split 되었는지를 확인!)
from sklearn.model_selection import train_test_split

## train, test 데이터 분리
X_train, X_test, y_train, y_test = train_test_split(
    X_features,
    y_labels,
    test_size=0.2,
    random_state=0
)
## 불균형한 데이터셋이므로 traget 값 분포도 확인
print(y_train.value_counts() / y_train.count())
print(y_test.value_counts() / y_test.count())## XGBoost, LightGBM의 early stopping을 사용하기 위해 train => train, val로 다시 분리
X_tr, X_val, y_tr, y_val = train_test_split(
X_train,
y_train,
test_size=0.3,
random_state=0
)ch4.9 XGBoost Model
- HyperOpt를 사용하여 XGBoost 최적 하이퍼 파라미터 찾기
- 지난 글에서 정리한 바와 같이 HyperOpt를 사용하여 하이퍼 파라미터 튜닝을 수행할 때, 1) 검색 공간 설정 2) 목적 함수 설정 3) fmin()으로 최적 하이퍼 파라미터 찾기 순서로 진행됨
- 주의사항은 XGBoost와 LightGBM에서는 cross_val_score()를 적용하면 early stopping 지원 불가하다는 것! 따라서 KFold 방식으로 직접 구현해야 함
## 1) 검색 공간 설정

from hyperopt import hp

xgb_search_space = {
    'max_depth':hp.quniform('max_depth', 5, 15, 1),                     ## 정수형 하이퍼 파라미터 => quniform 사용
    'min_child_weight':hp.quniform('min_child_weight', 1, 6, 1),        ## 정수형 하이퍼 파라미터 => quniform 사용
    'learning_rate':hp.uniform('learning_rate', 0.01, 0.2),
    'colsample_bytree':hp.uniform('colsample_bytree', 0.5, 0.95),
}

## 2) 목적 함수 설정

from sklearn.model_selection import KFold
from sklearn.metrics import roc_auc_score
from xgboost import XGBClassifier
from sklearn.metrics import roc_auc_score

def objective_func(search_space):

  xgb_clf = XGBClassifier(
      n_estimators=100,
      max_depth=int(search_space['max_depth']),                ## int형으로 형변환 필요
      min_child_weight=int(search_space['min_child_weight']),  ## int형으로 형변환 필요
      learning_rate=search_space['learning_rate'],
      colsample_bytree=search_space['colsample_bytree'],
      #eval_metric='logloss' => 불균형 데이터셋이므로 성능 평가 지표를 roc-auc로 설정
      )

      ## XGBoost와 LightGBM에서는 cross_val_score()를 적용하면 early stopping 지원 불가, KFold 방식으로 직접 구현해야 함
      ## 3개의 k-fold 방식으로 평가된 roc-auc 지표를 담는 list
  roc_auc_list = []

  ## 3개의 k-fold 방식 적용
  kf = KFold(n_splits=3)

  for tr_index, val_index in kf.split(X_train):

    X_tr, y_tr = X_train.iloc[tr_index], y_train.iloc[tr_index]
    X_val, y_val = X_train.iloc[val_index], y_train.iloc[val_index]

    xgb_clf.fit(
        X_tr, y_tr,
        early_stopping_rounds=30,
        eval_metric='auc',
        eval_set=[(X_tr, y_tr), (X_val, y_val)]
    )

    score = roc_auc_score(
        y_val,
        xgb_clf.predict_proba(X_val)[:, 1]
    )

    roc_auc_list.append(score)

  return (-1) * np.mean(roc_auc_list)

## 3) fmin()을 사용하여 최적 하이퍼 파라미터 찾기

from hyperopt import fmin, tpe, Trials

trials = Trials()

best = fmin(
    fn=objective_func,
    space=xgb_search_space,
    algo=tpe.suggest,
    max_evals=50,
    trials=trials,
)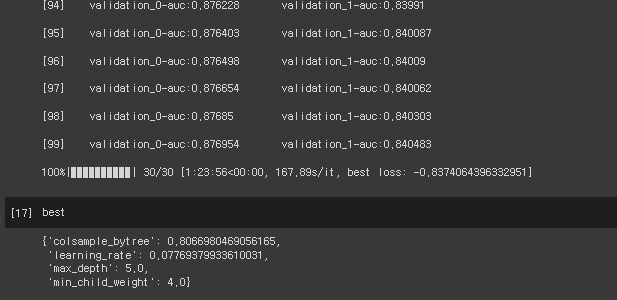
- 최적 하이퍼 파라미터를 이용하여 XGBoost 모델 선언
## 획득한 최적의 하이퍼 파라미터를 이용하여 모델 선언
xgb_wrapper = XGBClassifier(
    n_estimators=500,
    learning_rate=round(best['learning_rate'], 5),
    max_depth=int(best['max_depth']),
    min_child_weight=int(best['min_child_weight']),
    colsample_bytree=round(best['colsample_bytree'], 5)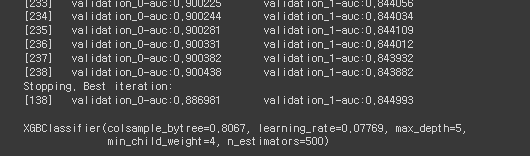
)- 모델 학습
xgb_wrapper.fit(
    X_tr, y_tr,
    early_stoppin_rounds=100,
    eval_metric='auc',
    eval_set=[(X_tr, y_tr), (X_test, y_test)]
)
- 모델 평가
xgb_roc_score = roc_auc_score(
    y_test,
    xgb_wrapper.predict_proba(X_test)[:, 1]
)

xgb_roc_score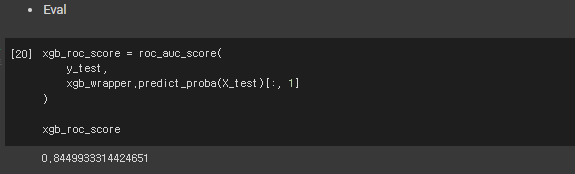
- feature importance 확인
from xgboost import plot_importance
import matplotlib.pyplot as plt

fig, ax = plt.subplots(1, 1, figsize=(10, 8))
plot_importance(xgb_wrapper,
                ax=ax,
                max_num_features=20,
                height=0.4,
                )
행복한 소히의 이것저것