[인공지능사관학교] Pandas (3)
2025년 6월 20일 (금) 전자신문 AI 관련 기사
과기정통부, 부처 협업 기반 공공분야 AI 활용 확산한다
이스트소프트, 이큐비알과 AI 휴먼 키오스크 사업 협력
AI 모델 학습비용 증가 해결한다…국가AI연구거점, 첫 성과 보고
[데스크가 만났습니다] 윤완수 웹케시그룹 부회장 “금융, 말로하는 시대”
EU, 머스크 'X' 디지털법 위반 들여다본다…xAI의 X 인수도 조사
시계열 데이터
- 일정한 시간을 간격으로 하는 데이터의 연속, 또는 일정한 날짜를 간격으로 하는 데이터가 연속된 것이 시리즈의 인덱스로 사용된 경우 이러한 인덱스를 가진 시리즈를 시계열이라고 한다.
dates = pd.date_range('2021-07-01','2021-07-06')
print(dates)
print(type(dates))
DatetimeIndex(['2021-07-01', '2021-07-02', '2021-07-03', '2021-07-04',
'2021-07-05', '2021-07-06'],
dtype='datetime64[ns]', freq='D')
<class 'pandas.core.indexes.datetimes.DatetimeIndex'>temps1 = pd.Series([80,82,85,90,83,87], index =dates)
temps12021-07-01 80
2021-07-02 82
2021-07-03 85
2021-07-04 90
2021-07-05 83
2021-07-06 87
Freq: D, dtype: int64-
[80,82,85,90,83,87]부분이 이미지일 수도 있고, 결제 기록일 수도 있음 -
Freq: D는 해당 시계열 인덱스(날짜 인덱스)의 주기(frequency)가 '하루(Day)'임을 의미- 만약 다른 주기를 사용했다면, 예를 들어 Freq: M은 1개월(Month), Freq: H는 1시간(Hour) 간격임을 의미
- 이러한 주기 정보는 pandas에서 시계열 데이터를 만들 때 pd.date_range() 등의 함수에서 freq='D'와 같이 지정할 수 있으며, 기본값이 'D'(하루)로 설정되어 있음
- 사진 메타정보(EXIF)
- 사진과 관련된 추가적인 정보를 담고 있는 데이터
- 사진의 촬영 날짜, 시간, 카메라 모델, 위치 정보, 설정값 등 다양한 내용을 포함
- EXIF(Exchangeable Image File Format): 표준 규격
아래의 코드는 두 개의 시리즈를 이용하여 데이터 프레임을 만듭니다.
아래의 코드는 두 개의 컬럼을 갖는 Dataframe 객체 temps_df를 만든다
이 데이터 프레임의 구성요소인 컬럼(세로로 길죽한것)은 위에서 만든 temps1 과 temps2의 시리즈 객체이다.
위의 셀에서 언급한 것처럼 temps1과 temps2는 동일한 인덱스인 dates를 가지므로
데이터 프레임이라는 데이터 구조를 만들때 2021-07-01 부터 2021-07-06까지의 인덱스가
temps1과 temps2에서 공통적으로 사용되었기에 데이터 프레임의 인덱스가 되기에 어려움이 없다(유리하다).
temps_df = pd.DataFrame(  {  'Missoula': temps1, 'Pliladelphia': temps2  }   )
print(temps_df)
df에 새로운 열 추가
간단한 할당(할당 연산자)
- 리스트나 넘파이 배열을 새로운 열 이름에 할당
df['NewColumn'] = [1, 2, 3, 4].insert()
- pandas.DataFrame.insert
insert(loc=, column=, value=)- 세 개의 인자를 필요로 함
- loc: 새로운 열을 삽입할 열의 인덱스
- column: 새로운 열의 이름
- value: 새로운 열에 할당할 값
df.insert(loc=1, column='NewColumn', value=[1, 2, 3, 4]).concat()
- pandas.concat
- 두 데이터프레임을 인자로 받아 축 1을 따라 연결
- 두 데이터프레임을 축 1을 따라 연결하여 새로운 열을 추가
- 새로운 열은 기존 데이터프레임의 오른쪽에 추가됨
df2 = pd.DataFrame({'NewColumn': [1, 2, 3, 4]})
df = pd.concat([df, df2], axis=1)
.assign()
- pandas.DataFrame.assign
- 딕셔너리를 인수로 사용하여 각 키가 새로운 열 이름을, 각 값이 새로운 열의 값들을 나타내도록 함
- 데이터프레임에서 새로운 열을 생성하고 해당 열의 값을 포함하는 새로운 데이터프레임을 반환
df = df.assign(NewColumn=[1, 2, 3, 4]).reindex()
- pandas.DataFrame.reindex
columns = 데이터프레임 이름.columns.tolist() + 추가하고 싶은 열 리스트형태로 열을 추가할 수 있음
df2 = df.reindex(columns = df.columns.tolist() + ['추가1', '추가2'] 6. .apply(func, axis=)
- pandas.DataFrame.apply
axis=- 0은 행, 1은 열
df['추가'] = df.apply(lambda _: None, axis=1)DataFrame 열 이름 바꾸기
rename()
단열 열 이름 변경
# 샘플 DataFrame 생성
import pandas as pd

data = {'Name': ['John', 'Alex', 'Peter'],
        'Age': [25, 24, 28],
        'Gender': ['Male', 'Male', 'Male']}

df = pd.DataFrame(data)

# 'Age' 열의 이름을 'Years'로 변경
df = df.rename(columns={'Age': 'Years'})

# DataFrame 출력
print(df)
Name Years Gender
0 John 25 Male
1 Alex 24 Male
2 Peter 28 Male다중 열 이름 변경
# 샘플 DataFrame 생성
import pandas as pd

data = {'Name': ['John', 'Alex', 'Peter'],
        'Age': [25, 24, 28],
        'Department': ['IT', 'HR', 'Marketing']}

df = pd.DataFrame(data)

# 'Age' 및 'Department' 열 이름 변경
df = df.rename(columns={'Age': 'Years', 'Department': 'Dept'})

# DataFrame 출력
print(df)
Name Years Dept
0 John 25 IT
1 Alex 24 HR
2 Peter 28 Marketingdf의 인덱스를 이용
- old column과 new column index를 딕셔너리 형태로 받아 열 이름을 바꿈
# Create a sample DataFrame
import pandas as pd

data = {'Name': ['John', 'Alex', 'Peter'],
        'Age': [25, 24, 28],
        'Department': ['IT', 'HR', 'Marketing']}

df = pd.DataFrame(data)

# Rename the '2' to 'Dept' column by index
df = df.rename(columns={2: 'Dept'})

# Print the DataFrame
print(df)
Name Age Dept
0 John 25 IT
1 Alex 24 HR
2 Peter 28 Marketingcolumns()
- 전체를 한 번에 바꿔야 할 때 사용
열 이름 리스트를 이용
# Create a sample DataFrame
import pandas as pd

data = {'Name': ['John', 'Alex', 'Peter'],
        'Age': [25, 24, 28],
        'Department': ['IT', 'HR', 'Marketing']}

df = pd.DataFrame(data)

# Rename the 'Name' and 'Department' columns using a list of column names
df.columns = ['ID', 'Years', 'Dept']

# Print the DataFrame
print(df)
ID Years Dept
0 John 25 IT
1 Alex 24 HR
2 Peter 28 MarketingList Comprehension
# Create a sample DataFrame
import pandas as pd

data = {'Name': ['John', 'Alex', 'Peter'],
        'Age': [25, 24, 28],
        'Department': ['IT', 'HR', 'Marketing']}

df = pd.DataFrame(data)

# Rename the 'Age' and 'Department' columns using list comprehension
df.columns = [col.replace('_', ' ').title() for col in df.columns]

# Print the DataFrame
print(df)
Name Age Department
0 John 25 IT
1 Alex 24 HR
2 Peter 28 Marketing- 리스트 컴프리헨션을 사용하여 밑줄을 공백으로 바꾸고 title() 메소드를 사용하여 첫 문자를 대문자로 바꾸어 열 이름을 바꿈
set_axis()
# Create a sample DataFrame
import pandas as pd

data = {'Name': ['John', 'Alex', 'Peter'],
        'Age': [25, 24, 28],
        'Gender': ['Male', 'Male', 'Male']}

df = pd.DataFrame(data)

# Rename the 'Age' and 'Gender' columns by index
df.columns = df.columns.set_axis(['a', 'Years', 'b'], axis=1, inplace=False)

# Print the DataFrame
print(df)
Name Age Dept
0 John 25 IT
1 Alex 24 HR
2 Peter 28 Marketing- 유연하고 편리한 방법이며, 동시에 여러 개의 이전 열 이름과 새 열 이름을 변경할 수 있음
- 인덱스 위치를 통해 열 이름 변경
- 라벨, 축, 그리고 inplace 세 가지 매개변수
- 새 열 이름으로 라벨을 설정
- 축을 나타내는 숫자 1을 사용
- inplace 매개변수는 새로운 DataFrame을 반환하기 위해 False로 설정
- 라벨, 축, 그리고 inplace 세 가지 매개변수
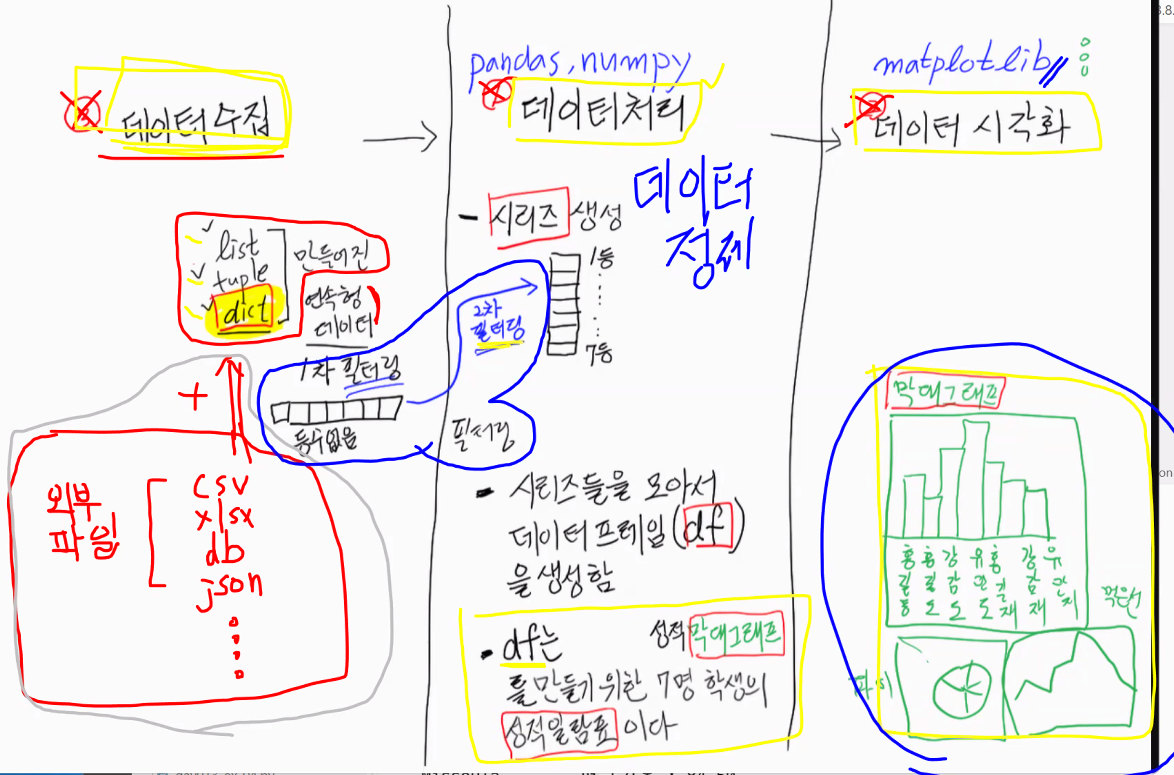
전체 과정 정리
프로그래머가 코딩하는 입장에서 정리해 봅시다.
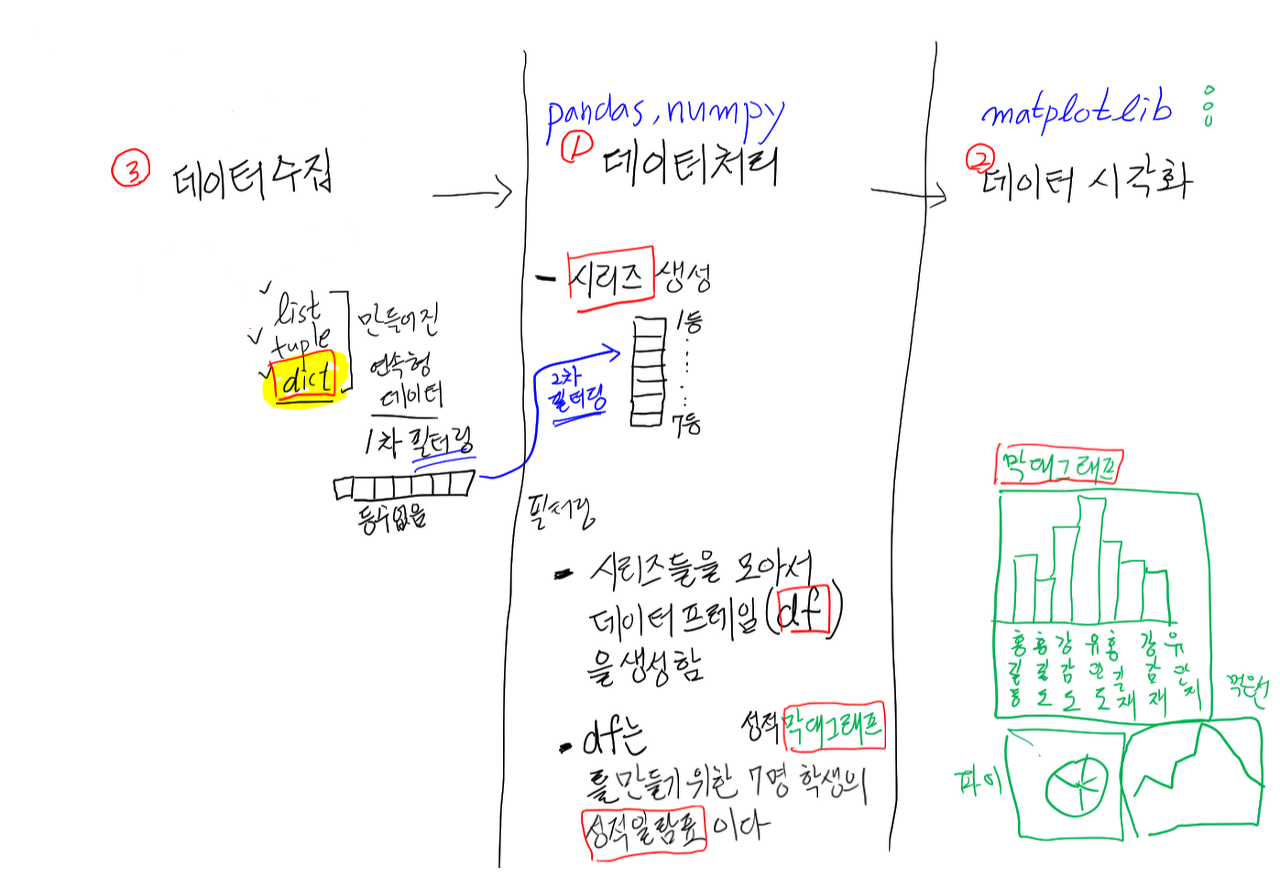
- 데이터 수집
- 연속형 데이터(집합형 데이터)
- list, tuple, dict
- 외부 파일
- csv, xlsx, db, json, …
- 굉장히 다양한 방법론이 존재
- 연속형 데이터(집합형 데이터)
사고의 폭을 유연하게 가질 필요가 있음
: AX/DX 엔지니어가 되든, 서비스쪽이드, 모델러이든 상관 없이 모두 지녀야 하는 공통 분모
→ 외부 파일에 대한 이해가 필요
→ 운영체제, 데이터베이스, 서버 등에 대한 공부가 필요함
-
데이터 정제
- 필터링 ★★★
- 각 단계별 전환이 일어날 때마다 필요함
- 필터링 ★★★
-
최종 목표: 시각화 결과물
Pandas DataFrame의 개념
판다스의 시리즈는 각 인덱스 레이블 당 한 개의 값(values)만 가진다.
그러나 데이터 프레임을 사용하면 인덱스 한 개당 복수개의 값을 가질 수 있다
데이터 프레임은 인덱스 레이블을 기준으로 배열된 한 개 이상의 시리즈의 집합을 의미한다.
각 시리즈는 데이터 프레임의 컬럼(열)이며 각각의 컬럼(열)은 자신만의 이름을 갖는다.
Pandas DataFrame의 특징
데이터 프레임은 데이터 베이스의 테이블 개념과 비슷하다.
서로다른 유형의 데이터 컬럼을 한 개 이상 갖는다는 점과, 한 컬럼의 모든 데이터는 동일한 유형이라는 점이 비슷한 점이다.
예시
import pandas as pd
import numpy as np
import matplotlib.pyplot as plt

dates = pd.date_range('2021-07-01','2021-07-06')
temps1 = pd.Series([80,82,85,90,83,87], index=dates)
temps2 = pd.Series([70,75,69,83,79,77], index=dates)

temps_df = pd.DataFrame({'Missoula':temps1, 'Philadelphia':temps2})

print(temps_df['Missoula']) # 데이터프레임에서 특정한 컬럼을 참조하기
print(type(temp_df)) # temps_df 는 데이터프레임 형식임
print('---')
print(type(temps1))
print(type(temps_df['Missoula']))
aa = temps_df['Missoula']
print(type(aa))
bb = temps_df.Missoula # 데이터프레임에 속해 있는 시리즈를 꺼내오는 새로운 문법임
# 직전의 temps_df['Missoula'] 문법과 비교할 것
print(bb)
print(type(bb))
2021-07-01 80
2021-07-02 82
2021-07-03 85
2021-07-04 90
2021-07-05 83
2021-07-06 87
Freq: D, Name: Missoula, dtype: int64
<class 'pandas.core.frame.DataFrame'>
---
<class 'pandas.core.series.Series'>
<class 'pandas.core.series.Series'>
<class 'pandas.core.series.Series'>
2021-07-01 80
2021-07-02 82
2021-07-03 85
2021-07-04 90
2021-07-05 83
2021-07-06 87
Freq: D, Name: Missoula, dtype: int64
<class 'pandas.core.series.Series'>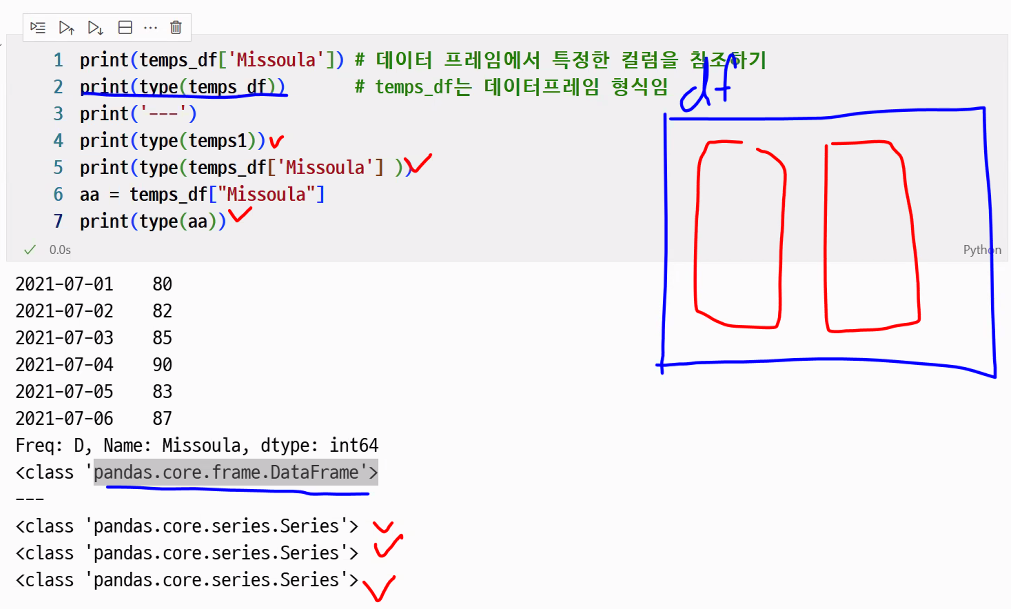
- 리스트 안의 요소가 특징을 그대로 유지하는 것과 동일한 맥락
데이터프레임에 속해 있는 시리즈를 꺼내오기
# 두 가지 문법 비교
temps_df['Missoula']
temps_df.Missoula-
temps_df['Missoula']- 설명:
대괄호([]) 안에 컬럼 이름을 문자열로 넣어서 해당 컬럼(시리즈)을 선택 - 특징:
- 컬럼 이름에 공백이나 특수문자가 들어가도 사용 가능
→ 예:temps_df['Missoula City']처럼 공백이 있어도 OK - 동적으로 컬럼 이름을 변수로 지정해 사용 가능
→ 예:col = 'Missoula'; temps_df[col] - 일반적으로 권장되는 방식
- 컬럼 이름에 공백이나 특수문자가 들어가도 사용 가능
- 설명:
-
temps_df.Missoula- 설명:
점(.) 연산자를 사용해서 컬럼 이름을 직접 적어서 시리즈를 선택 - 특징:
- 컬럼 이름이 변수명 규칙을 만족해야 사용 가능
→ 예:Missoula는 알파벳만 있으니 사용 가능, 하지만temps_df.Missoula City는 에러 발생 (공백 불가) - 코드가 간결해 보임
- 컬럼 이름이 예약어(예:
sum,mean등)와 겹치면 사용 불가 - 동적으로 컬럼 이름을 변수로 지정해 사용 불가
- 컬럼 이름이 변수명 규칙을 만족해야 사용 가능
- 설명:
- 요약
| 문법 | 동적 컬럼명 지원 | 공백/특수문자 컬럼명 가능 | 예약어 컬럼명 가능 | 일반적 권장 여부 |
|---|---|---|---|---|
temps_df['Missoula'] | O | O | O | O |
temps_df.Missoula | X | X | X | △ |
- 결론
- 안전하고 범용적으로 사용하려면
temps_df['Missoula']를 쓰세요. - 컬럼명이 변수명 규칙을 준수하고, 코드가 간결해 보이길 원하면
temps_df.Missoula도 사용 가능합니다.
(하지만 대부분의 경우 대괄호 방식이 더 안전합니다.)
- 안전하고 범용적으로 사용하려면
두 개 이상의 컬럼 선택
- 데이터 프레임을 구성하는 두 개 이상의 컬럼(시리즈)을 한 번에 가져올 때에는 대괄호를 중첩하여야 함
temps_df [[ 'Philadelphia','Missoula' ]] Missoula Philadelphia
2021-07-01 80 70
2021-07-02 82 75
2021-07-03 85 69
2021-07-04 90 83
2021-07-05 83 79
2021-07-06 87 77
Freq: D, dtype: int64시리즈 간 산술연산
temps_diff = temps_df.Missoula - temps_df.Philadelphia
print(temps_diff)
print(type(temps_diff))
print(temps_df)
2021-07-01 10
2021-07-02 7
2021-07-03 16
2021-07-04 7
2021-07-05 4
2021-07-06 10
Freq: D, dtype: int64
<class 'pandas.core.series.Series'>
Missoula Philadelphia
2021-07-01 80 70
2021-07-02 82 75
2021-07-03 85 69
2021-07-04 90 83
2021-07-05 83 79
2021-07-06 87 77시리즈 추가
temps_df['Difference'] = temps_diff
print(temps_df)
Missoula Philadelphia Difference
2021-07-01 80 70 10
2021-07-02 82 75 7
2021-07-03 85 69 16
2021-07-04 90 83 7
2021-07-05 83 79 4
2021-07-06 87 77 10컬럼명 반환
print(    temps_df.columns    )
print(   list(temps_df.columns)   )
Index(['Missoula', 'Philadelphia', 'Difference'], dtype='object')
['Missoula', 'Philadelphia', 'Difference']컬럼 레이블명 변경
col_list = list(temps_df.columns)
col_list[0] = 'Misu'
temps_df.columns = col_list  #  데이터프레임의 컬럼명(시리즈 레이블명)변경됨
print(list(temps_df.columns))
['Misu', 'Philadelphia', 'Difference']print(temps_df)Misu Philadelphia Difference
2021-07-01 80 70 10
2021-07-02 82 75 7
2021-07-03 85 69 16
2021-07-04 90 83 7
2021-07-05 83 79 4
2021-07-06 87 77 10print(temps_df.Misu)2021-07-01 80
2021-07-02 82
2021-07-03 85
2021-07-04 90
2021-07-05 83
2021-07-06 87
Freq: D, Name: Misu, dtype: int64시리즈 슬라이싱
print(temps_df.Misu[1:4])
print(temps_df.Misu[3:])
2021-07-02 82
2021-07-03 85
2021-07-04 90
Freq: D, Name: Misu, dtype: int64
2021-07-04 90
2021-07-05 83
2021-07-06 87
Freq: D, Name: Misu, dtype: int64- 사용자가 정의해 준 인덱스와 위치 인덱스 구분하기
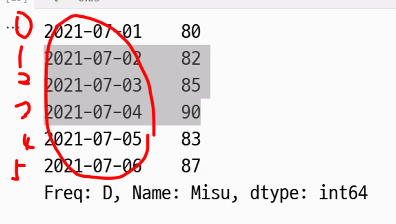
[1:4]의 숫자는 내재된 인덱스(시스템 인덱스)임
.loc와 .iloc
.loc는 인덱스 레이블을 사용해 검색- 사용자 인덱스를 참조하는 loc 명령은 존재하지 않을 때 에러 발생
.iloc는 제로베이스 위치를 사용해 검색
print(temps_df)
print('-'*40)
print(temps_df.iloc[5])temps_df.iloc[5]- 데이터 프레임에서
[n], n번째 행을 참조하라는 뜻
- 데이터 프레임에서
print(temps_df.iloc[3].index)
print(temps_df.loc['2021-07-06'])
Index(['Misu', 'Philadelphia', 'Difference'], dtype='object')
Misu            87
Philadelphia    77
Difference      10
Name: 2021-07-06 00:00:00, dtype: int64print(temps_df.iloc[5])Misu 87
Philadelphia 77
Difference 10
Name: 2021-07-06 00:00:00, dtype: int64print('-'*40) print(temps_df.Seoul[-3:]) print('-'*40) print(temps_df.Seoul[3:6]) print('-'*40) print(temps_df[['Seoul']][3:]) print('-'*40) print(temps_df2['Seoul'].tail(3)) print('-'*40) print(temps_df.loc['20210704':'20210706',['Seoul']]) print('-'*40) print(temps_df.loc['2021-07-04':'2021-07-06',['Seoul']]) # 위의 소스와 비교---------------------------------------- 2021-07-04 82 2021-07-05 77 2021-07-06 85 Freq: D, Name: Seoul, dtype: int64 ---------------------------------------- 2021-07-04 82 2021-07-05 77 2021-07-06 85 Freq: D, Name: Seoul, dtype: int64 ---------------------------------------- Seoul 2021-07-04 82 2021-07-05 77 2021-07-06 85 ---------------------------------------- 2021-07-04 82 2021-07-05 77 2021-07-06 85 Freq: D, Name: Seoul, dtype: int64 ---------------------------------------- Seoul 2021-07-04 82 2021-07-05 77 2021-07-06 85 ---------------------------------------- Seoul 2021-07-04 82 2021-07-05 77 2021-07-06 85
- 복수의 아이템 조회 시 대괄호 겹쳐 쓰기
temps_df.iloc[[ 1,3,5 ]: temps_df 데이터프레임에서 1,3,5번 인덱스 번호를 가져옴temps_df.iloc[[1, 3, 5]].Diff: temps_df 데이터프레임에서 가져온 1,3,5번 인덱스 번호 중 Column Diff(Series Diff) 에 해당하는 것만 추출
%pfile
-
%pfile명령어- 일반적으로 IPython(주피터 노트북 등)에서 특정 객체의 소스 코드를 파일로 출력하거나 보여주는 기능
- 예를 들어,
%pfile 모듈명.함수명또는%pfile 함수명처럼 사용하여 해당 객체가 정의된 파일의 내용을 볼 수 있음
-하지만,%pfile명령어는 파이썬 객체(함수, 클래스, 모듈 등)의 소스 코드를 찾아주는 용도로 설계되어 있어 만약 사용자가%pfile data/goog.csv와 같이 입력하면, 이 명령은data/goog.csv라는 파이썬 객체(함수, 클래스, 모듈 등)가 있는지 찾으려고 시도합니다.goog.csv는 파이썬 객체가 아니라 데이터 파일(CSV 파일)이기 때문에, 파이썬 인터프리터는 해당 객체를 찾지 못하고 "Objectdata/goog.csvnot found."라는 오류 메시지를 출력하게 됩니다.
-
명령어가 하는 일:
%pfile은 파이썬 객체의 소스 코드를 파일로 출력하는 IPython 매직 명령어입니다. -
%pfile data/goog.csv입력 시 에러 메시지가 나오는 이유:data/goog.csv는 파이썬 객체가 아니라 데이터 파일이므로, 해당 객체를 찾을 수 없어서 에러가 발생합니다.- CSV 파일을 읽으려면
pandas.read_csv("data/goog.csv")와 같은 명령어를 사용해야 합니다.
- CSV 파일을 읽으려면